Life changes and depressive symptoms: The effects of valence and amount of change
Bạn đang xem bản rút gọn của tài liệu. Xem và tải ngay bản đầy đủ của tài liệu tại đây (386.13 KB, 11 trang )
Bennik et al. BMC Psychology 2013, 1:14
/>
RESEARCH ARTICLE
Open Access
Life changes and depressive symptoms: the
effects of valence and amount of change
Elise C Bennik*, Johan Ormel and Albertine J Oldehinkel
Abstract
Background: Only few studies have focused on the effects of positive life changes on depression, and the ones
that did demonstrated inconsistent findings. The aim of the present study was to obtain a better understanding of
the influence of positive life changes on depressive symptoms by decomposing life changes into a valence and an
amount of change component.
Methods: Using hierarchical multiple regression, we examined the unique effects of valence (pleasantness/
unpleasantness) and amount of change on depressive symptoms in 2230 adolescents (Mage: 16.28 years) from the
TRAILS study.
Results: Adjusted for age, gender and pre-event depressive symptoms, the amount of life change was positively
associated with depressive symptoms. A small excess of positive life changes predicted fewer symptoms, but
experiencing a large excess of positive life changes did not have any additional beneficial effects, rather the
opposite. Valence was more strongly associated with cognitive-affective than with neurovegetative-somatic
symptoms.
Conclusions: More positive life changes relative to negative life changes can protect against depressive symptoms,
yet only when the amount of change is limited. This study encourages examination of the effects of life changes
on specific symptom clusters instead of total numbers of depressive symptoms, which is the current standard.
Keywords: Positive/ negative life events, Adolescents, Cognitive-affective, Neurovegetative-somatic depressive
symptoms
Background
Depression is a highly prevalent disorder, which is
expected to rank second in causes of disability worldwide by 2020 (Mathers & Loncar, 2006). Research into
depression underscores the role of life changes in its etiology. A substantial body of research has demonstrated
that life changes are associated with the onset and course
of depressive symptoms (e.g., Brilman & Ormel, 2001;
De Graaf et al. 2002; Friis et al. 2002; Kessler, 1997;
Ormel & Wohlfarth, 1991; Stroud et al. 2008). It is a challenging task to define the objective stressfulness of life
changes, since stress is imperceptible, shows a wide intracategory variance, and can be rated along varying dimensions (Dohrenwend, 2006; Ross & Mirowsky, 1979). Two
dimensions that have often been used in prior studies are
* Correspondence:
University of Groningen, University Medical Center Groningen, Department
of Psychiatry, Interdisciplinary Center Psychopathology and Emotion
Regulation (ICPE), Groningen, The Netherlands
the amount of change (Holmes & Rahe, 1967), and its
unpleasantness or threat (Brown et al. 1973; Ormel &
Wohlfarth, 1991; Paykel et al. 1971).
In the late seventies of the last century, several studies
compared these two dimensions of stressfulness with regard to the question which one of the two predicted
mental health problems best. The results were equivocal.
Dohrenwend (1973) and Fontana et al. (1979) found that
both the total amount of change and unpleasantness
predicted psychological distress, with the former being a
better predictor. In contrast, unpleasantness was more
strongly correlated with mental health problems than
was the amount of change in studies of Gersten et al.
(1974), Vinokur and Selzer (1975), Ross and Mirowsky
(1979) and Mueller et al. (1977). Since the publication of
these studies, the emphasis has been on unpleasant life
changes and remarkably little effort has been made to
© 2013 Bennik et al.; licensee BioMed Central Ltd. This is an Open Access article distributed under the terms of the Creative
Commons Attribution License ( which permits unrestricted use, distribution, and
reproduction in any medium, provided the original work is properly cited.
Bennik et al. BMC Psychology 2013, 1:14
/>
disentangle the effects of unpleasantness and amount of
change.
Due to the focus on unpleasantness rather than the
total amount of change, research on life changes has
been characterized by a preponderance of studies on the
influence of negative life changes on depression. Many
life changes are, to some degree, both pleasant and unpleasant (Ormel & Wohlfarth, 1991), but for the sake of
clarity we will refer to a negative life change when the
life change is largely unpleasant and to a positive life
change when the life change is largely pleasant. Seligman,
initiator of the positive psychology movement (Baumeister
et al. 2001), argued for a shift from the negative focus
dominating the psychology field towards a more positive
focus in 1991. His call increased the interest in beneficial
influences of positive stimuli on mental health somewhat,
but still few studies have focused on the effects of positive
life changes on mental health. The ones that did demonstrated inconsistent findings. Some studies found that
positive life changes were associated with increased life
satisfaction (Lu, 1999) and remission of depression (Gledhill
& Garralda, 2011; Kessler, 1997; Needles & Abramson,
1990; Oldehinkel et al. 2000), as well as with a diminished
effect of negative life changes on distress (Reich & Zautra,
1981), depression (Cohen & Hoberman, 1983; Dixon &
Reid, 2000; Leenstra et al. 1995) and self-esteem (Cohen
et al. 1987). In contrast, other studies revealed no direct
association between positive life changes and mental
health (Needles & Abramson, 1990; Sarason et al. 1978),
or even an association with increased distress (Brown &
McGill, 1989; Hirsch et al. 1985) and risk of depression
(Overbeek et al., 2010).
Distinguishing between the valence (i.e., the pleasantness or unpleasantness) of life changes and the amount
of change could provide an explanation for the inconsistent findings with regard to the effect of positive life
changes on depressive symptoms. Assuming that a pleasant experience generally reduces depressive symptoms,
whereas the effort required to adjust to (any) change rather tends to increase symptoms (Coddington, 1972), we
propose that two opposite forces are acting in the case of
positive life changes. Which one of the two dominates will
depend on the relative amount of pleasantness and
amount of change. In case of a negative life change, both
the valence and the change component act in the same
direction (i.e., towards more depressive symptoms), which
explains why findings regarding negative life changes have
been considerably more consistent than those regarding
positive life changes. Because negative and positive life
changes often co-occur and interact in depressed individuals (Overbeek et al., 2010), the effects of both types of
changes should be studied in conjunction, taking into account their overall valence and amount of change (Shahar
& Priel, 2002).
Page 2 of 11
We hypothesize that the association of both valence
and amount of change with depressive symptoms is not
represented by a straight line, but curvilinear. With regard to amount of change, this hypothesis is based on
the assumption that amount of change is only related to
depressive symptoms above a certain threshold and on a
study by Wildman and Johnson (1977), who found a
curvilinear relationship between amount of change and
mental health. With regard to valence, we expect depressive symptoms to be more strongly related to an excess
of unpleasantness (negative valence) than to an excess of
pleasantness (positive valence) for two reasons. The first
reason is that most adolescents did not have any, or only
few, depressive symptoms, resulting in little variation left
to benefit from a high amount of positive life changes
relative to the amount of negative life changes (ceiling
effect). The second reason is that depressive symptom
measures cover only the negative part of the continuum
ranging from happiness to depression.
It is generally acknowledged that depression is a heterogeneous disorder, which entails different underlying
pathologies (Chen et al. 2000; Kendler et al. 1996; Ormel
& de Jonge, 2011). Neurovegetative-somatic symptoms
(appetite or weight change, sleep problems, psychomotor
agitation or retardation, fatigue) and cognitive-affective
depressive symptoms (depressed mood, loss of interest,
feeling worthless, guilt, and suicidal ideation) have been
found to be differentially associated with demographic
characteristics, comorbid problems, clinical characteristics of the depression, and personality traits (Lux &
Kendler, 2010), as well as with cardiac autonomic and
HPA axis function (Bosch et al., 2009). Moreover, Keller
et al. (2007) demonstrated that chronic stress was particularly strongly associated with symptoms like fatigue
and hypersomnia, while losses (death of loved ones and
romantic breakups) were rather marked by anhedonia,
appetite loss, and guilt. Hence, although it has, to our
knowledge, never been examined directly, it is well conceivable that the relative importance of the valence and
amount of life change differs among depressive symptoms.
Valence might be especially associated with cognitiveaffective symptoms. Cognitive diathesis-stress theories of
depression postulate that individuals with a negative
cognitive diathesis tend to make negative inferences
about the causes, consequences, and self-implications of
a life change (Abramson et al. 1989; Beck, 1987). Most
likely, these inferences are based on the valence rather
than the amount of life changes. These negative inferences are believed to induce hopelessness and, in turn,
other cognitive-affective symptoms (Abramson et al.
1978). Conversely, the attribution of positive life changes
to internal, global and stable causes may reduce hopelessness and associated cognitive-affective symptoms
(Needles & Abramson, 1990). The amount of life change,
Bennik et al. BMC Psychology 2013, 1:14
/>
on the other hand, might be more strongly associated with
neurovegetative-somatic symptoms, because every change
requires energy. Frequent or persistent exposure to situations that require energy (i.e., life changes) may take more
energy than is easily available and hence lead to lack of
energy or disruption of physiological processes such as
metabolism and diurnal rhythm. This idea was already
expressed in 1936 by Selye, who postulated that organisms
have a generalized defense reaction to adapt to challenging
stimuli consisting of three phases: alarm phase, resistance
and exhaustion. The third phase is only reached when exposure to stressors persists (Selye, 1936). Recent chronic
stress research in humans underpins this idea (Armon et al.
2008; Grossi et al. 2003). Thus, neurovegetative-somatic depressive symptoms are hypothesized to be more strongly associated with the amount of life change than with valence.
The goal of the present study was to disentangle the
effects of valence and the amount of life change with regard to the development of depressive symptoms. Most
studies on the unique influences of valence and amount
of change on mental health were conducted back in the
late seventies of the last century, after which this topic
has been mainly neglected. We gave new impetus to
these findings by measuring depressive symptoms instead of global mental health, and by using regression analyses which allowed us to adjust for multiple
confounders (including pre-event depressive symptoms)
and to model curvilinear effects. In addition to a sum
score of depressive symptoms, we examined the effect
of two sub dimensions, that is, cognitive-affective and
neurovegetative-somatic symptoms. We hypothesized
that (1) valence and the amount of life change are independently associated with subsequent depressive symptoms; (2) the association of valence and amount of
change with depressive symptoms is curvilinear; and (3)
valence is associated most strongly with cognitiveaffective symptoms, whereas amount of change is associated most strongly with neurovegetative-somatic symptoms. These hypotheses were examined in a large
sample of adolescents (N = 2230) from the Dutch TRacking Adolescents’ Individual Lives Survey (TRAILS). Adolescents are an interesting study target because they
often experience changes in many life domains and the
incidence of depression rises considerably during this life
phase (Kessler et al. 2001). Disentangling valence and
the amount of life change may be a fruitful approach to
a better understanding of the influence of positive life
changes on depression, and to further explore the heterogeneity of depressive symptoms.
Methods
Participants and procedure
This study is part of TRAILS, a prospective cohort study
of Dutch adolescents. The study was approved by the
Page 3 of 11
Dutch Central Committee on Research Involving Human
Subjects. Data present in this article are from the second
and third wave of TRAILS, which ran respectively from
September 2003 to December 2004 and September 2005 to
Augustus 2008. The sample selection consisted of two
steps. First, 3483 names and addresses of all inhabitants
born between October 1, 1989 and September 30, 1990
(first two municipalities) or October 1, 1990 and September
30, 1991 (last three municipalities), were collected at the
selected municipalities. Second, primary schools (including schools for special education) within these municipalities were simultaneously approached with the request to
participate in TRAILS. TRAILS staff approached eligible
children and their parents only when they participated in
school. Of the 135 primary schools within the municipalities, 122 (90.4% of the schools accommodating 90.3% of
the children) agreed to participate in the study. Seventysix percent of the approached adolescents (N = 3145) were
enrolled in the study (N = 2230, 50.8% girls, Mage =
11.09 years, SD = 0.56). All adolescents and their parents
gave written informed consent. Detailed information
about sample characteristics, sample selection and analysis
of non-response bias has been reported elsewhere (de
Winter et al., 2005; Huisman et al., 2008). Of the 2230
baseline participants, 96.4% (N = 2149, 51.0% girls, Mage =
13.65, SD = 0.53) participated in the second wave (T2),
which was held two to three years after the first wave
(T1). At the third wave (T3), which was held two to three
years after wave 2, the response was 81.4% (N = 1816,
52.3% girls, Mage = 16.27, SD = 0.73).
Measures
Depressive symptoms
Depressive symptoms were assessed with the Youth SelfReport (YSR), a self-reported evaluation of the child’s
emotional and behavioral problems in the past 6 months
(Achenbach & Rescorla, 2001). The 13 items of the YSR
Affective Problems scale (Cronbach’s α = .76, test-retest
reliability: r = .79) reflect symptoms of a Major Depressive Episode according to the DSM-IV (Achenbach
et al., 2003). Participants were asked to rate the items on
a 3-point scale (0 = not true, 1 = sometimes or a bit true,
2 = often or very true). The scale score reflects the sum
score of the individual items (T2: M = 3.57, SD = 3.38,
T3: M = 3.81, SD = 3.50). A high level of depressive
symptoms was defined as a sum score of 7.0 (85th percentile) or more, which has been established as a good
predictor of clinical depressive episodes in adolescents
(Aebi et al. 2009). Adolescents with a score below 7.0
were indicated as having low level of depressive symptoms. This cut-off score was also used to define transition groups. For example, adolescents who scored below
7.0 at T2 and above 7.0 at T3, were classified as having
moved from low to high levels of depressive symptoms.
Bennik et al. BMC Psychology 2013, 1:14
/>
Based on our understanding of the constructs measured by the scales and confirmative factor analyses, 12
items (the item “I sleep more than most other children”
was omitted from the scales in order to increase internal
consistency) of the Affective Problems Scale were divided into two scales, namely neurovegetative-somatic
symptoms (less sleep, sleeping problems, overtiredness,
loss of energy and eating problems) and cognitiveaffective symptoms (anhedonia, depressed mood, crying
a lot, feelings of worthlessness, feelings of guilt, self-harm
and suicide ideation). More details about the construction
of the scales are described in the article of Bosch et al.
(2009). Cronbach’s alphas for the neurovegetative-somatic
symptoms scale were .64 and .67 and for the cognitiveaffective symptoms scale .73 and .74 for the T2 data and
the T3 data, respectively.
Life changes
Life changes were measured using the Turning Point
Questionnaire (TPQ), which was specifically developed
for TRAILS. Adolescents were asked to indicate in
which of seven life domains positive or negative changes
had occurred in the preceding two years. The domains
were romantic relationships, friendships, achievements,
family, peer group, school and religion. School was excluded from the analyses because of a low test-retest reliability (κ = .48), and religion because only very few (< 3%)
of the adolescents reported a life change in this domain.
Analyses with inclusion of the school domain in the analyses yielded nearly the same results as analyses without
changes in the school domain except that the effects of
amount of change and valence were slightly larger than
without the life change scores in the school domain. An
important feature of the TPQ is that it is symmetrical, in
that positive and negative life changes are assessed with
regard to the same domains. With regard to family, for instance, the two life changes assessed are ‘There has been a
change in your family for the better’ (positive life change)
and ‘There has been a change in your family for the worse’
(negative life change). Please note that the valence and
amount of life change scores are not based on the actual
number of life changes, but on the number of life domains
in which the adolescent experienced a change in the preceding two years.
The TPQ test-retest reliability across a period of two
weeks was examined in a sample of 150 adolescents
(Mage = 16.57, SD = 0.75, 52.7% boys), who followed preuniversity (47.3%) or higher general secondary education
(52.7%) at two different schools. The test-retest reliabilities (Cohen’s kappa) for the different domains of change
ranged from .59 to .78. The test-retest correlation
(Spearman rho) of the sum scores for positive and negative life changes were, respectively, .81 (p < .01) and .78
(p < .01) (Bennik et al., 2011).
Page 4 of 11
Based on these sum scores we constructed two measures: (1) the amount of change, which refers to the total
number of life changes irrespective of valence; and (2)
the valence of the life changes, which was calculated as
the number of domains with positive life changes minus
the number of domains with negative life changes (i.e.,
the higher the valence, the larger the relative number of
positive life changes). We chose a difference score of
positive life changes minus negative life changes instead
of a ratio score of positive life changes divided by negative life changes because some adolescents experienced
zero negative life changes, and it is mathematically not
possible to divide a number by zero.
The Turning point questionnaire was only administered at T3, covering the period between T2 and T3.
Therefore only life change measures between T2 and T3
were available. Depressive symptoms were measured at
T1, T2 and T3, but we only used the data from T2 and
T3 since we were interested in the influence of life
changes on depressive symptoms at T3, adjusted for the
depressive symptoms before the life changes took place
(at T2).
Statistical analyses
All analyses were performed with SPSS 18.0.3. (SPSS
Inc., Chicago). Complete data from 1532 adolescents
were available, while in 31.3% of the 2230 adolescents
information was partly or wholly missing, presumably at
random. We used multiple imputation techniques (Fully
Conditional Specification and Predictive Mean Matching)
to impute missing values in any of the included variables.
Since Bodner (2008) recommended using at least as many
imputations as the percentage of missing data, the number
of imputations was 33. Significance levels (two-tailed)
were set at p < .05 for all analysis.
To test the hypothesis that Valence and Amount of
change are independently associated with depressive
symptoms, we conducted ordinary regression analyses.
First, we screened data and examined assumptions for
regression analyses. The variance inflation factor (VIF)
was calculated to check for multicollinearity. Since all
the VIFs were below 1.8, there were no indications of
multicollinearity. Assumptions of ordinary regression
analyses were not fully met, but additional analyses with
robust regression yielded results that corroborated the
ones found with ordinary linear regression results. We
chose to present the results of the ordinary linear regression analyses in this article because these models provided
more relevant information (i.e., proportion explained variances and betas) than robust regression models. The
dependent variable was depressive symptoms at T3. The
Valence and Amount of change score were entered simultaneously in the model, so that we could assess their
unique contribution, adjusted for each other. We also
Bennik et al. BMC Psychology 2013, 1:14
/>
controlled for T2 depressive symptoms, gender, and age.
In a second step, quadratic terms of the Valence and
Amount of Change scores were included in the model to
investigate whether there was a curvilinear pattern in
addition to the linear pattern. To prevent multicollinearity, the quadratic variables were centered (original variable minus its mean).
We have also considered incorporation of positive
valence, negative valence, and amount of change separately in the models. However, since the total amount of
change score is a linear combination (i.e., sumscore) of
positive and negative changes, adding the amount of
change score to a model with positive and negative life
changes is statistically not possible. Hence, the only way
to disentangle change and valence in a model with both
positive and negative changes is to use difference scores.
It is important to note that no information will be lost
with our approach, because the separate effects of positive and negative life changes could be derived from the
regression coefficients of valence and amount of change
(B4 valence = B4 pos. changes – neg. changes; B5 amount
of change = B5 pos. changes + neg. changes). The regression coefficient of the specific effect of positive life
changes is B4 valence + B5 amount of change, and the regression coefficient of the specific effect of negative life
changes is –B4 valence + B5 amount of change.
We chose to use a difference score for valence and an
amount of change score in the analyses, because these
variables directly test our hypotheses about valence and
change and are easy to interpret without loss of information of the absolute effects of positive and negative life
changes. We do not have specific questions or hypotheses about the interaction of valence and amount of
change and therefore we left them out the analyses.
As additional analysis to get closer to clinically meaningful findings, we examined whether Valence and Amount
of change predicted a transition from low (T2) to high
(T3) levels of depressive symptoms, or vice versa. This
was tested in two logistic regression analyses; one involving adolescents with low levels of depressive symptoms at
T2, with high versus low T3 symptom levels as outcome
variable; and the other involving adolescents with high
levels of depressive symptoms at T2, with low versus high
T3 symptom levels as outcome variable.
Finally, ordinary linear regression analyses with, respectively, neurovegetative-somatic and cognitive-affective symptoms as dependent variables were performed to test
whether Valence and Amount of change were differentially
associated with different symptom clusters. To examine
the unique influence of valence and amount of life change
on the different symptom clusters we performed an additional ordinary linear regression analysis with the difference between the cognitive-affective and neurovegetativesomatic symptom scores as dependent variable.
Page 5 of 11
Results
Descriptive statistics
Table 1 shows the proportions of adolescents experiencing positive and negative life changes in each of the five
domains. Adolescents reported more positive than negative life changes in most domains, except for family. The
over report of positive life changes for the domains romantic relationship and peer group may be due to the
development of romantic and adolescent friendship relationships which have not yet ended or not ended in an
unpleasant manner (13–16 years). Descriptive statistics
of the variables used in this study are listed in Table 2.
The Valence score and Amount of change score ranged
respectively from −3 to 5 and from 0 to 10. These two
life change variables were moderately correlated: the larger the excess of positive life changes, the larger the
amount of change score. The correlations with gender
and T2 depressive symptoms were very weak (Amount
of change) or negligible (Valence).
Change in total depressive symptoms
Adjusted for gender, age, T2 depressive symptoms and
each other, both Valence and Amount of change were associated with T3 depressive symptoms (see Table 3a).
Valence had a negative effect on depressive symptoms
which uniquely explained 2% of the variance (R2 change =
.020, F = 45.39, p < .001); Amount of change had a positive
effect on depressive symptoms at T3 and added 3.5%
unique explained variance to the model (R2 change = .035,
F = 80.64, p < .001). All predictors together explained 32%
of the variance in T3 depressive symptoms (R2 = .318).
There were no indications that Valence predicted T3 depressive symptoms to a greater extent than Amount of
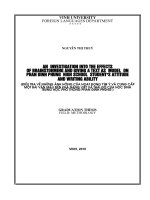
change or vice versa (deducted from the overlapping confidence intervals). The effect of Valence was curvilinear, as
indicated by a significant quadratic effect (R2 change =
.007, F = 8.76, p < .001 and see Table 3a), which is illustrated in Figure 1: high amounts of unpleasantness had
stronger effects on depressive symptoms than high
amounts of pleasantness. The graph reached its nadir at
about a Valence score of 3, indicating that an excess of
more than three positive life change did not have
Table 1 Proportions and standard deviations of
experienced life changes subdivided into different
domains and valence
Domains life changes
Negative life change
Positive life change
Proportion (SD)
Proportion (SD)
Romantic relationship
.13 (.34)
.37 (.48)
Friendship
.09 (.29)
.35 (.48)
Achievement
.07 (.26)
.44 (.56)
Family
.19 (.39)
.13 (.33)
Peer group
.03 (.17)
.32 (.46)
Bennik et al. BMC Psychology 2013, 1:14
/>
Page 6 of 11
Table 2 Correlations, means and standard deviations among the study variables
M
SD
.49
.50
Variable
1. Gender (0 = girls, 1 = boys)
2. T3 Age (years)
1
2
3
4
5
6
7
8
16.29
0.72
.01
3. T2 depr. symptomsa
3.57
3.38
-.17**
b
4. Amount of change
2.12
1.65
-.08**
-.04
.11**
5. Valencec
1.08
1.29
.01
-.07**
-.02
.53**
6. T2 C-a symptoms
1.40
1.91
-.17**
-.01
.78**
.10**
-.03
7. T2 N-s symptoms
2.02
1.94
-.14**
-.03
.88**
.10**
-.02
.46**
8. T3 C-a symptoms
1.30
1.90
-.21**
-.00
.39**
.15**
-.10**
.42**
.29**
9. T3 N-s symptoms
2.32
2.06
-.18**
.04
.45**
.16**
-.03
.32**
.46**
.45**
3.81
3.50
-.21**
.04
.50**
.18**
-.06*
.42**
.45**
.75**
a
10. T3: depr. symptoms
9
-.02
.89**
Note. M = mean, SD = standard deviation, depr = depressive, C-a = Cognitive-affective symptoms, N-s = Neurovegetative-somatic symptoms.
a
Sum score of total depressive symptoms. bAmount of change: sum score of negative and positive life changes. cDifference between number of positive life
changes and number of negative life changes.
*p < .05. **p < .01.
Table 3 Ordinary multiple regression models predicting respectively T3 depressive symptoms (3a), T3
neurovegetative-somatic symptoms (3b), T3 cognitive-affective symptoms (3c) from valence and amount of change
Predictor
Step 1
B
Step 2
β
95% CI
t
B
β
95% CI
t
a: Dependent variable: T3 depressive symptoms
T2 depressive symptoms
0.51
.49
[ 0.47, 0.55]
23.49***
0.51
.49
[ 0.46, 0.55]
23.48***
−0.80
-.12
[−1.06, -0.54]
−5.97***
−0.79
-.11
[−1.06, -0.53]
−5.94***
0.16
.03
[−0.03, 0.36]
1.63
0.16
.03
[−0.04, 0.35]
1.56
−0.44
-.16
[−0.57, -0.31]
−6.61***
−0.43
-.16
[−0.56, -0.29]
−6.30***
0.45
.21
[ 0.36, 0.55]
9.13***
0.38
.18
[ 0.27, 0.49]
6.64***
Valence
0.08
.05
[ 0.01, 0.14]
2.31*
Amount of change2
0.03
.03
[−0.01, 0.06]
1.48
Gender
Age
Valence
Amount of change
2
b: Dependent variable: T3 neurovegetative-somatic symptoms
T2 N-s symptoms
0.47
.44
[ 0.43, 0.51]
21.75***
0.47
.44
[ 0.43, 0.51]
21.68***
−0.38
-.09
[−0.54, -0.21]
−4.51***
−0.37
-.09
[−0.54, -0.21]
−4.48***
0.14
.05
[ 0.02, 0.26]
2.23*
0.13
.05
[ 0.01, 0.25]
2.14*
−0.16
-.10
[−0.24, -0.09]
−4.15***
−0.15
-.09
[−0.22, -0.07]
−3.60***
0.23
.18
[ 0.17, 0.28]
7.38***
0.17
.14
[ 0.10, 0.24]
4.89***
Valence
0.04
.04
[−0.00, 0.08]
1.88
Amount of change2
0.03
.05
[ 0.01, 0.05]
2.37*
Gender
Age
Valence
Amount of change
2
c: Dependent variable: T3 cognitive-affective symptoms
T2 C-a symptoms
0.45
.45
[ 0.40, 0.49]
19.22***
0.44
.45
[ 0.40, 0.49]
19.16***
Gender
−0.46
-.12
[−0.61, -0.31]
−6.00***
−0.46
-.12
[−0.60, -0.31]
−5.97***
Age
−0.00
-.00
[−0.11, 0.11]
−0.04
−0.00
-.00
[−0.12, 0.11]
−0.07
Valence
−0.28
-.19
[−0.36, -0.21]
−7.37***
−0.29
-.19
[−0.36, -0.21]
−7.25***
0.23
.20
[ 0.18, 0.29]
8.15***
0.22
.19
[ 0.15, 0.28]
6.56***
0.03
.04
[−0.01, 0.07]
1.65
−0.00
-.01
[−0.02, 0.02]
0.24
Amount of change
2
Valence
Amount of change2
Note. CI = Confidence Interval, N-s = Neurovegetative-somatic Symptoms, C-a = Cognitive-affective symptoms.
*p < .05. ***p < .001.
Bennik et al. BMC Psychology 2013, 1:14
/>
Page 7 of 11
Figure 1 Curvilinear effect of valence1 on T3 depressive symptoms. 1A negative valence score indicates a higher amount of negative life
changes than positive life changes, whereas a positive valence score indicates a higher amount of positive life changes than negative life
changes. For example, a score of 3 means that three more positive life changes than negative life changes were reported.
additional beneficial effects anymore, rather the opposite.
The regression coefficient of the specific effect of positive
life changes is B4 valence + B5 amount of change =
(−0.44) + (0.45) = 0.01, and the regression coefficient of
the specific effect of negative life changes is –B4 valence +
B5 amount of change = −B4 valence + B5 amount of
change = − (−0.44) + (0.45) = 0.89 (see Table 3a).
Additional transition analyses
Table 4 presents the Odds ratios (OR) and corresponding 95% confidence intervals (CI’s) for the transition
from low (T2) to high (T3) levels of depressive symptoms and vice versa. The transition from low to high
levels of depressive symptoms was significantly predicted
by both Valence and Amount of change. Valence decreased the likelihood of the transition from low to high
levels of depressive symptoms, while Amount of change
increased its likelihood. The associations of Valence and
Amount of change with a transition from high to low
levels of depressive symptoms was just the other way
around and about equally strong. The effects of Valence
Table 4 Logistic regression models predicting the
likelihoods of transition of depressive symptoms
From low to higha
From high to lowb
OR
95% CI
OR
95% CI
Gender
0.31
[0.20, 0.46]***
1.45
[0.82, 2.56]
Age
1.07
[0.83, 1.39]
0.92
[0.63, 1.34]
Valence (Pos-Neg)
0.69
[0.60, 0.80]***
1.46
[1.14, 1.87]*
Amount of change
1.40
[1.26, 1.56]***
0.80
[0.68, 0.93]*
Note. OR = odds ratio; CI = confidence interval.
a
Transition from low to high level of depressive symptoms (increasing versus
stable low). bTransition from high to low level of depressive symptoms
(decreasing versus stable high).
*p < .05. *** p < .001.
and Amount of change were linear rather than nonlinear
in this model, that is, the quadratic effects were not
significant.
Change in neurovegetative-somatic symptoms and
cognitive-affective symptoms
Adjusted for gender, age, T2 neurovegetative-somatic or
cognitive-affective symptoms and each other, Valence and
Amount of change were associated with both neurovegetative-somatic and cognitive-affective symptoms
(see respectively Table 3b and 3c). Valence had a negative
effect and Amount of change had a positive effect on the
two symptom dimensions. Valence predicted cognitiveaffective symptoms better than neurovegetative-somatic
symptoms (t = − 3.21, p = .001), while there was no difference for amount of change.
Discussion
The aim of the present study was to obtain a better understanding of the influence of positive life changes on
depression by decomposing life changes into a valence
and an amount of change component. The first hypothesis was that valence and amount of life change are independently associated with depressive symptoms. The
results are in accordance with this expectation. The second hypothesis, that valence and amount of life change
would demonstrate curvilinear associations with depressive symptoms, was partially supported by our data. We
found a curvilinear association between valence and
depressive symptoms, but not between amount of life
change and depressive symptoms. Finally, we hypothesized that valence would be relatively strongly associated
with cognitive-affective symptoms and amount of change
with neurovegetative-somatic symptoms. Although all associations were statistically significant, valence was more
Bennik et al. BMC Psychology 2013, 1:14
/>
strongly associated with cognitive-affective than with
neurovegetative-somatic symptoms, in accordance with
the hypothesis. The effects of amount of life change were
about equally strong for both symptom dimensions.
The findings of the current study commensurate with
those of Dohrenwend (1973) and Fontana et al. (1979),
who notified that both the amount of life change and
unpleasantness predict mental health problems. They
are in contrast with studies of Gersten et al. (1974),
Vinokur and Selzer (1975), Ross and Mirowsky (1979)
and Mueller et al. (1977) indicating that unpleasantness
is a better predictor of mental health problems than the
amount of life change. These inconsistent findings may
be caused by the use of different measures of (un)pleasantness. Gersten et al. (1974), Vinokur and Selzer (1975),
Ross and Mirowsky (1979) and Mueller et al. (1977)
used independent scores of pleasantness and unpleasantness in addition to balance scores (the number of pleasant life changes minus the number of unpleasant life
changes or vice versa), whereas Dohrenwend (1973) and
Fontana et al. (1979) only used balance scores. The use
of balance scores was criticized by Vinokur and Selzer
(1975), who pointed out that pleasant life changes are
not significantly associated with mental health problems
and cause high error variance in the balance score. As
outlined in the Introduction of this article, the lack of effects of positive life changes may be due to two opposite
life change-related forces: pleasantness versus the adjustment required by changes. By adjusting the effect of
pleasantness (valence) for the influence of amount of
change and vice versa, we were able to analyze their independent effects on depressive symptoms. Furthermore,
by taking into account the total amount of change, two
persons with the same valence score but with other absolute numbers of positive and negative life changes would
have different predictive values for depressive symptoms,
because their scores for amount of change are different.
Although perhaps not immediately evident, our findings are in accordance with previous studies suggesting
that the (inverse) effects of positive life changes on depressive symptoms are small (Needles & Abramson,
1990; Sarason et al., 1978). When accounting for amount
of change, an excess of positive life changes was associated with fewer depressive symptoms. However, the effects were curvilinear and revealed that these beneficial
effects of positive life changes on depressive symptoms
were less strong than the detrimental effects of negative
life changes. More than three positive life changes relative to negative life changes did not have additional
beneficial effects anymore, rather the opposite.
The effect sizes found in our study were small. Our
whole model explained 32 percent of the variance of T3
depression, with T2 depression accounting for two third
of this explained variance. Gender, valence and amount
Page 8 of 11
of change explained the other one third of the variance.
Although the proportion explained variance of the quadratic terms is small (0.7 percent) and appears of small
clinical relevance, adding the quadratic terms to the
model significantly improved the model which has
resulted in our conclusion that the effect of valence was
rather curvilinear than linear. This proportion is small,
because it reflects the unique explained variance of the
quadratic effects of valence and amount of change up
and above the linear effects of valence and amount of
change.
The hypothesis that valence is more strongly associated with cognitive-affective symptoms and amount of
life change more strongly with neurovegetative-somatic
symptoms, was partially confirmed. Contrary to our hypothesis, the amount of life change was approximately
similar associated with both symptom dimensions.
Possibly, cognitive-affective symptoms are indirect consequences of neurovegetative-somatic symptoms. In burnout for example, exhaustion is the core symptom, but it is
accompanied by cognitive-affective symptoms (Schaufeli
& Enzmann, 1998). Since we could not determine the
exact time points of the life changes and changes in depressive symptoms in our study, it is impossible to compare direct and indirect effects of valence and amount of
life change on symptom clusters.
Our study has several notable strengths. One important asset is the use of a life changes questionnaire that is
symmetrical, in that both positive and negative life
changes are assessed with regard to the same domains
(romantic relationships, friendships, achievements, family and peer group), and that the items assessing positive
and negative life changes only differed with regard to the
valence of the life changes. In other words, the number
of negative life changes and positive life changes assessed were equal in this study, while previous studies
were often hampered by an underrepresentation of positive life changes in their life changes measures (Mueller
et al., 1977). Another asset is the large sample size
compared with most previous studies, which formed an
adequate representation of the population of Dutch adolescents (de Winter et al., 2005). Finally, due to the longitudinal design of the TRAILS study, we were able to adjust for pre-event depressive symptoms.
Several limitations require that the results be interpreted
with some caution. First, the occurrence of life changes
was obtained via self-report rather than interviewer-based
measures. Therefore, the relationship between life changes
and depressive symptoms might be confounded by the
mental health state of the adolescent (Monroe, 2008). This
would lead to an overestimation of the size of the positive
association between depressive symptoms and negative
life changes, and the negative association between depressive symptoms and positive life changes. Because we
Bennik et al. BMC Psychology 2013, 1:14
/>
found that experiencing a high number of positive life
changes was associated with more instead of fewer depressive symptoms, we suspect the confounding effect to be
limited at the most. A second limitation is the observational nature of the study which does not allow clarifying
causal relationships between life changes and depressive
symptoms (Kraemer et al., 1997). Third, the life changes
measures involved a simple count of the number of domains in which a change occurred, and the changes were
not rated with regard to the amount of required readjustment (e.g. Holmes & Rahe, 1967). The questionnaire used
did not allow free responses of the participants to describe
which changes took place and therefore we did not have
specific information about the changes. However, reported
correlations between the number of life changes and readjustment ratings are high (Swearingen & Cohen, 1985),
and most studies found that a simple sum score of life
changes was associated virtually similarly with mental
health problems as a life change measure based on readjustment ratings (e.g. Gersten et al., 1974; Vinokur &
Selzer, 1975). Since only five domains were measured our
life change measures did not cover all domains of life
changes, but we do think that we have measured the most
important domains. Possibly more important is that the
valence and amount of life change scores are not based on
the actual number of life changes, but on the number of
life domains in which the adolescent experienced a (positive/negative) change. Part of the adolescents may have
experienced multiple life changes within a domain, which
was not reflected in the scores. The life change scores
used in the present study are therefore presumably an
underestimation of the actual score. However, it is unlikely
that this underestimation resulted in a systematic bias.
The questionnaire used was designed to measure important life changes (potential turning points) rather than
more minor life changes, because major life changes have
been primarily associated with the onset of depression
(e.g. Monroe & Harkness, 2005). Furthermore, we think
our approach to measure the number of life domains rather than individual changes also has an important benefit:
it provides an indication of the (amount of) areas of stability and instability.
Another limitation of the current study is that wellknown cognitive vulnerability factors influencing the association between (positive) life changes and depressive
symptoms were not incorporated in the analyses, including self-esteem (Cohen et al., 1987), neuroticism
(Oldehinkel et al., 2000), social support (Jackson &
Warren, 2000), and attributional style (Needles &
Abramson, 1990). Therefore, we did not have information about whether the associations of valence and
amount of change with depressive symptoms were mediated or moderated by other factors. Individuals with
greater cognitive vulnerability may exhibit stronger
Page 9 of 11
associations between life changes and depressive symptoms, particularly cognitive-affective symptoms.
It may be interesting for future research to examine
whether specific positive life changes are differentially associated with depressive symptoms. The finding that the
change component of positive life changes suppressed the
beneficial effect of the valence component implies another
hypothesis in consequence: positive life changes which
require relatively little adjustment have most beneficial
effects since they are not overshadowed by the efforts required to adjust to the change. Furthermore, future studies should not only investigate the relationship between
life changes and depressive symptoms, but also the relationship between life changes and happiness.
Conclusion
The present study demonstrated that amount of life change
was associated with more depressive symptoms, whereas a
certain amount of excess of positive life changes was related to less depressive symptoms. However, experiencing
a large excess of positive life changes did not have any
additional beneficial effects, rather the opposite. In other
words, more positive life changes relative to negative life
changes have the potential to protect against depressive
symptoms, yet only when the amount of change is limited.
Furthermore, this study encourages examination of the effects of life changes on specific symptom clusters instead
of total numbers of depressive symptoms, which is the
current standard.
Competing interests
The authors declare that they have no competing interests.
Authors’ contributions
EB reviewed the literature, analysed the data and wrote the drafts of this
article. JO and AO contributed to the design of the analysis and
interpretation of data and critically reviewed and edited all sections of the
article. All authors read and approved the final manuscript.
Acknowledgements
This research is part of the TRacking Adolescents’ Individual Lives Survey (TRAILS).
TRAILS has been financially supported by various grants from the Netherlands
Organization for Scientific Research NWO (Medical Research Council program
grant GB-MW 940-38-011; ZonMW Brainpower grant 100-001-004; ZonMw Risk
Behavior and Dependence grants 60-60600-98-018 and 60-60600-97-118;
ZonMw Culture and Health grant 261-98-710; Social Sciences Council mediumsized investment grants GB-MaGW 480-01-006 and GB-MaGW 480-07-001;
Social Sciences Council project grants GB-MaGW 457-03-018, GB-MaGW 452-04
-314, and GB-MaGW 452-06-004; NWO large-sized investment grant
175.010.2003.005; NWO Longitudinal Survey and Panel Funding 481-08-013);
the Sophia Foundation for Medical Research (projects 301 and 393), the Dutch
Ministry of Justice (WODC), the European Science Foundation (EuroSTRESS
project FP-006), and the participating universities. Participating centers of
TRAILS include various departments of the University Medical Center and
University of Groningen, the Erasmus University Medical Center Rotterdam, the
University of Utrecht, the Radboud Medical Center Nijmegen, and the Parnassia
Bavo group, all in the Netherlands.
Received: 13 November 2012 Accepted: 6 August 2013
Published: 21 August 2013
Bennik et al. BMC Psychology 2013, 1:14
/>
References
Abramson, LY, Seligman, ME, & Teasdale, JD. (1978). Learned helplessness in
humans: critique and reformulation. J Abnorm Psychol, 87(1), 49–74.
Abramson, LY, Metalsky, GI, & Alloy, LB. (1989). Hopelessness depression: a
theory-based subtype of depression. Psychol Rev, 96(2), 358–372.
Achenbach, TM, & Rescorla, LA. (2001). Manual for the ASEBA school-age forms
and profiles. Burlington, VT: University of Vermont, Research center for
children, youth and families.
Achenbach, TM, Dumenci, L, & Rescorla, LA. (2003). DSM-oriented and empirically
based approaches to constructing scales from the same item pools. J Clin
Child Adolesc Psychol, 32(3), 328–340.
Aebi, M, Metzke, CW, & Steinhausen, H. (2009). Prediction of major affective
disorders in adolescents by self-report measures. J Affect Disord,
115(1–2), 140–149.
Armon, G, Shirom, A, Shapira, I, & Melamed, S. (2008). On the nature of burnoutinsomnia relationships: a prospective study of employed adults. J Psychosom
Res, 65(1), 5–12.
Baumeister, RF, Bratslavsky, E, Finkenauer, C, & Vohs, KD. (2001). Bad is stronger
than good. Rev Gen Psychol, 5(4), 323–370.
Beck, AT. (1987). Cognitive models of depression. J Cogn Psychother, 1(1), 5–37.
Bennik, EC, Oldehinkel, AJ, & Ormel, J. (2011). Test-retest reliability Turningpoint
Questionnaire, Unpublished Manuscript. The Netherlands: University of
Groningen.
Bodner, TE. (2008). What improves with increased missing data imputations?
Struct Eq Model, 15(4), 651–675.
Bosch, NM, Riese, H, Dietrich, A, Ormel, J, Verhulst, FC, & Oldehinkel, AJ. (2009).
Preadolescents’ somatic and cognitive-affective depressive symptoms are
differentially related to cardiac autonomic function and cortisol: the TRAILS
study. Psychosom Med, 71(9), 944–950.
Brilman, E, & Ormel, J. (2001). Life events, difficulties and onset of depressive
episodes in later life. Psychol Med, 31(5), 859–869.
Brown, JD, & McGill, KL. (1989). The cost of good fortune: when positive life
events produce negative health consequences. J Pers Soc Psychol,
57(6), 1103–1110.
Brown, GW, Harris, TO, & Peto, J. (1973). Life events and psychiatric-disorders: II.
nature of causal link. Psychol Med, 3(2), 159–176.
Chen, L, Eaton, W, Gallo, J, & Nestadt, G. (2000). Understanding the
heterogeneity of depression through the triad of symptoms, course
and risk factors: a longitudinal, population-based study. J Affect Disord,
59(1), 1–11.
Coddington, RD. (1972). The significance of life events as etiologic factors in the
diseases of children: II. a study of a normal population. J Psychosom Res,
16(3), 205–213.
Cohen, S, & Hoberman, HM. (1983). Positive events and social supports as buffers
of life change stress. J App Soc Psychol, 13(2), 99–125.
Cohen, LH, Burt, CE, & Bjorck, JP. (1987). Life stress and adjustment: Effects of life
events experienced by young adolescents and their parents. Dev Psychol,
23(4), 583–592.
De Graaf, R, Bijl, RV, Ravelli, A, Smit, F, & Vollenbergh, WAM. (2002). Predictors of
first incidence of DSM-III-R psychiatric disorders in the general population:
findings from the netherlands mental health survey and incidence study.
Acta Psychiatr Scand, 106(4), 303–313.
De Winter, AF, Oldehinkel, AJ, Veenstra, R, Brunnekreef, JA, Verhulst, FC, & Ormel,
J. (2005). Evaluation of non-response bias in mental health determinants and
outcomes in a large sample of pre-adolescents. Eur J Epidemiol, 20(2),
173–181.
Dixon, WA, & Reid, JK. (2000). Positive life events as a moderator of stress-related
depressive symptoms. J Counsel Dev, 78(3), 343–347.
Dohrenwend, BS. (1973). Life events as stressors - methodological inquiry.
J Health Soc Behav, 14(2), 167–175.
Dohrenwend, BP. (2006). Inventorying stressful life events as risk factors for
psychopathology: toward resolution of the problem of intracategory
variability. Psychol Bull, 132(3), 477–495.
Fontana, AF, Hughes, LA, Marcus, JL, & Dowds, BN. (1979). Subjective evaluation
of life events. J Consult Clin Psychol, 47(5), 906–911.
Friis, RH, Wittchen, H, Pfister, H, & Lieb, R. (2002). Life events and changes in the
course of depression in young adults. Eur Psychiatry, 17(5), 241–253.
Gersten, JC, Langner, TS, Eisenberg, JG, & Orzeck, L. (1974). Child behavior and life
events: undesirable change or change per se? In BS Dohrenwend & BP
Dohrenwend (Eds.), Stressful life events: Their nature and effects (p. 11). Oxford
England: John Wiley & Sons.
Page 10 of 11
Gledhill, J, & Garralda, ME. (2011). The short-term outcome of depressive disorder
in adolescents attending primary care: a cohort study. Soc Psychiatry Psychiatr
Epidemiol, 46(10), 993–1002.
Grossi, G, Perski, A, Evengård, B, Blomkvist, V, & Orth-Gomér, K. (2003).
Physiological correlates of burnout among women. J Psychosom Res,
55(4), 309–316.
Hirsch, BJ, Moos, RH, & Reischl, TM. (1985). Psychosocial adjustment of adolescent
children of a depressed, arthritic, or normal parent. J Abnorm Psychol,
94(2), 154–164.
Holmes, TH, & Rahe, RH. (1967). Social readjustment rating scale. J Psychosom Res,
11(2), 213–218.
Huisman, M, Oldehinkel, AJ, De Winter, A, Minderaa, RB, De Bildt, A, Huizink, AC, &
Ormel, J. (2008). Cohort profile: The dutch ‘TRacking adolescents’ individual
lives’ survey’; TRAILS. Int J Epidemiol, 37(6), 1227–1235.
Jackson, Y, & Warren, JS. (2000). Appraisal, social support, and life events: predicting
outcome behavior in school-age children. Child Dev, 71(5), 1441–1457.
Keller, MC, Neale, MC, & Kendler, KS. (2007). Association of different adverse life
events with distinct patterns of depressive symptoms. Am J Psychiatry,
164(10), 1521–1622.
Kendler, KS, Eaves, LJ, Walters, EE, & Neale, MC. (1996). The identification and
validation of distinct depressive syndromes in a population-based sample of
female twins. Arch Gen Psychiatry, 53(5), 391–399.
Kessler, RC. (1997). The effects of stressful life events on depression. Annu Rev
Psychol, 48, 191–214.
Kessler, RC, Avenevoli, S, & Merikangas, KR. (2001). Mood disorders in children
and adolescents: an epidemiologic perspective. Biol Psychiatry,
49(12), 1002–1014.
Kraemer, HC, Kazdin, AE, Offord, DR, & Kessler, RC. (1997). Coming to terms with
the terms of risk. Arch Gen Psychiatry, 54(4), 337–343.
Leenstra, AS, Ormel, J, & Giel, R. (1995). Positive life change and recovery from
depression and anxiety: a three-stage longitudinal study of primary care
attenders. Br J Psychiatry, 166(3), 333–343.
Lu, L. (1999). Personal or environmental causes of happiness: a longitudinal
analysis. J Soc Psychol, 139(1), 79–90.
Lux, V, & Kendler, KS. (2010). Deconstructing major depression: a validation study
of the DSM-IV symptomatic criteria. Psychol Med, 40(10), 1679–1690.
Mathers, CD, & Loncar, D. (2006). Projections of global mortality and burden of
disease from 2002 to 2030. PLoS Med, 3(11), e442.
Monroe, SM. (2008). Modern approaches to conceptualizing and measuring
human life stress. Annu Rev Clin Psychol, 4, 33–52.
Monroe, SM, & Harkness, KL. (2005). Life stress, the “kindling” hypothesis, and the
recurrence of depression: considerations from a life stress perspective.
Psychol Rev, 112(2), 417–445.
Mueller, DP, Edwards, DW, & Yarvis, RM. (1977). Stressful life events and
psychiatric symptomatology: change or undesirability? J Health Soc Behav,
18(3), 307–317.
Needles, DJ, & Abramson, LY. (1990). Positive life events, attributional style, and
hopefulness: testing a model of recovery from depression. J Abnorm Psychol,
99(2), 156–165.
Oldehinkel, AJ, Ormel, J, & Neeleman, J. (2000). Predictors of time to remission
from depression in primary care patients: do some people benefit more
from positive life change than others? J Abnorm Psychol, 109(2), 299–307.
Ormel, J, & De Jonge, P. (2011). Unipolar depression and the progression of
coronary artery disease: toward an integrative model. Psychother Psychosom,
80(5), 264–274.
Ormel, J, & Wohlfarth, T. (1991). How neuroticism, long-term difficulties, and life
situation change influence psychological distress - a longitudinal model.
J Pers Soc Psychol, 60(5), 744–755.
Overbeek, G, Vermulst, A, De Graaf, R, Ten Have, M, Engels, R, & Scholte, R. (2010).
Positive life events and mood disorders: longitudinal evidence for an erratic
lifecourse hypothesis. J Psychiatr Res, 44(15), 1095–1100.
Paykel, ES, Prusoff, BA, & Uhlenhut, EH. (1971). Scaling of life events. Arch Gen
Psychiatry, 25(4), 340–347.
Reich, JW, & Zautra, A. (1981). Life events and personal causation: some relationships
with satisfaction and distress. J Pers Soc Psychol, 41(5), 1002–1012.
Ross, CE, & Mirowsky, J. (1979). A comparison of life-event-weighting schemes:
change, undesirability, and effect-proportional indices. J Health Soc Behav,
20(2), 166–177.
Sarason, IG, Johnson, JH, & Siegel, JM. (1978). Assessing the impact of life
changes: Development of the life experiences survey. J Consult Clin Psychol,
46(5), 932–946.
Bennik et al. BMC Psychology 2013, 1:14
/>
Page 11 of 11
Schaufeli, WB, & Enzmann, D. (1998). The Burnout Companion to Study and
Research: A Critical Analysis. London: Taylor & Francis.
Selye, H. (1936). A syndrome produced by diverse nocuous agents. Nature, 138, 32.
Shahar, G, & Priel, B. (2002). Positive life events and adolescent emotional distress: in
search of protective-interactive processes. J Soc Clin Psychol, 21(6), 645–668.
Stroud, CB, Davila, J, & Moyer, A. (2008). The relationship between stress and
depression in first onsets versus recurrences: a meta-analytic review. J Abnorm
Psychol, 117(1), 206–213.
Swearingen, EM, & Cohen, LH. (1985). Measurement of adolescents’ life events:
the junior high life experiences survey. Am J Community Psychol, 13(1), 69–85.
Vinokur, A, & Selzer, ML. (1975). Desirable versus undesirable life events: their
relationship to stress and mental distress. J Pers Soc Psychol, 32(2), 329–337.
Wildman, RC, & Johnson, DR. (1977). Life change and langner’s 22-item mental
health index: a study and partial replication. J Health Soc Behav, 18(2), 179–188.
doi:10.1186/2050-7283-1-14
Cite this article as: Bennik et al.: Life changes and depressive symptoms:
the effects of valence and amount of change. BMC Psychology 2013 1:14.
Submit your next manuscript to BioMed Central
and take full advantage of:
• Convenient online submission
• Thorough peer review
• No space constraints or color figure charges
• Immediate publication on acceptance
• Inclusion in PubMed, CAS, Scopus and Google Scholar
• Research which is freely available for redistribution
Submit your manuscript at
www.biomedcentral.com/submit