Parents of healthy children assign lower quality of life measure to scenarios labeled as cancer than to identical scenarios not labeled as cancer
Bạn đang xem bản rút gọn của tài liệu. Xem và tải ngay bản đầy đủ của tài liệu tại đây (797.21 KB, 9 trang )
McElderry et al. BMC Psychology
(2019) 7:8
/>
RESEARCH ARTICLE
Open Access
Parents of healthy children assign lower
quality of life measure to scenarios labeled
as cancer than to identical scenarios not
labeled as cancer
Brenna M. McElderry1*, Emily L. Mueller2,3, Abigail Garcia4, Aaron E. Carroll2 and William E. Bennett Jr2,5
Abstract
Background: While it is commonly understood that a cancer diagnosis evokes feelings of fear, the effect of
labeling a child’s illness as “cancer” remains unstudied. We hypothesized that lower health utility scores would be
assigned to disease states labeled as cancer compared to identical disease states without the mention of cancer.
Methods: In this randomized study, caregivers of healthy children were asked to assign health utility values to
different scenarios written as improving, stable, or worsening. Participants from general pediatric clinics at Eskenazi
Health were randomly assigned to either the scenarios labeled as “cancer” or “a serious illness”. Participants then
rated the scenarios using the Standard Gamble, with laddering of health utilities between 0 (a painless death) and 1
(perfect health). We also gathered subject demographics and assessed the subject’s numeracy.
Results: We approached 319 subjects and 167 completed the study. Overall median health utilities of “cancer”
scenarios were lower than “serious illness” scenarios (0.61 vs. 0.72, p = 0.018). Multivariate regression (with an
outcome of having a utility above the 75th percentile) showed no significant effects by race, ethnicity, numeracy, or
income level. “Cancer” scenarios remained significantly lower after adjustment for confounders using logistic
regression, but only for the more serious scenarios (OR 0.92, p = 0.048).
Conclusions: On average, caregivers with healthy children were shown to take more risk with their treatment
options and view their child as having a worse quality of life when they knew the disease was cancer. Awareness of
this bias is important when discussing treatments with families, particularly when a risk of cancer is present.
Keywords: Cancer, Childhood, Health utility, Quality of life, Decision making, Bias
Background
Cancer is a rare diagnosis among children ages 0–19
years and the most common types are associated with
high survival rates overall [1, 2]. However, there is evidence that childhood cancer is commonly misunderstood by the general public [3, 4]. While the literature is
lacking in direct survey of public opinion, studies analyzing media portrayal of childhood cancer show a particularly negative connotation of the cancer label. Media has
been shown to heavily influence public opinion on a
wide range of topics [5]. One such study pursued how
* Correspondence:
1
Indiana University School of Medicine, Indianapolis, USA
Full list of author information is available at the end of the article
childhood cancer is portrayed in recent films and found
a cinematic mortality rate of 66%, compared to the actual mortality rate of 16% for all childhood cancers [3].
Another study analyzed all magazine articles published
on cancer between 1970 and 2001 [4]. One of the study’s
major findings was a common narrative structure drastically contrasting the before and after of a childhood
cancer diagnosis, which they hypothesized to exacerbate
societal fear and stigma surrounding childhood cancer,
despite most children returning to everyday life [4].
These misguided perceptions of childhood cancer
could impact medical decision making by caregivers of
children, including when the risk of cancer is present.
For example, those treating rheumatologic conditions
© The Author(s). 2019 Open Access This article is distributed under the terms of the Creative Commons Attribution 4.0
International License ( which permits unrestricted use, distribution, and
reproduction in any medium, provided you give appropriate credit to the original author(s) and the source, provide a link to
the Creative Commons license, and indicate if changes were made. The Creative Commons Public Domain Dedication waiver
( applies to the data made available in this article, unless otherwise stated.
McElderry et al. BMC Psychology
(2019) 7:8
with tumor necrosis factor-alpha inhibitors increase
their risk of non-Hodgkin’s lymphoma [6]. Azathioprine
therapy for those with inflammatory bowel disease has
been associated with an increased risk of overall cancer,
and the use of CT scans on children carries an established increased risk of leukemia and brain cancer [7, 8].
Caregivers are often faced with treatment decisions requiring an accurate understanding of childhood cancer.
This warrants a need to properly assess the public’s opinions on the quality of life of that particular disease state.
Health utility measurement is an ideal method to assess the impact of the term “cancer” on perceived quality
of life. Health utilities measure the quality of a specific
health state based on health decision making [9]. It is
well studied that the more risk someone is willing to
take with a treatment to cure a disease, the worse they
perceive that disease state [9]. Health utilities are generated by presenting a participant with a particular health
state and description. The participant is then asked to
imagine being presented with a new drug that cures the
presented health state, but carries a level of risk of a defined worsening of their quality of life. The percentage
of risk is adjusted to a point of indifference, meaning we
find the highest percentage of risk the person is willing
to take for a curative measure. This percentage is converted into a health utility score for a disease that ranges
from 0 to 1, with 0 equivalent to a quick and painless
death, and 1 equivalent to perfect health [10–12]. These
scores can then be used to compare quality of life between different health states and health outcomes. This
approach was used to evaluate the perceived impact of
varying stages of breast cancer, which was modeled by
attaining a subject’s opinion on multiple health states
and toxicities to treatment [13]. No prior studies have
taken a similar approach to investigate perceived quality
of life in childhood illness by caregivers of healthy children, particularly investigating the impact of the term
“cancer” in scenario descriptions.
We chose to investigate the social construct surrounding childhood cancer. The goal of this study was to determine if use of the term “cancer” affects a caregiver’s
assignment of health utilities for their child. Our study
assessed the reaction of caregivers of healthy children to
the disease states of childhood cancer versus an equally
serious illness but without the label of “cancer.” We hypothesized that caregivers would assign a lower health
utility to disease states described as cancer than disease
states described as a serious illness despite the same description of disease state. This would mean the use of
the word “cancer” made scenarios appear to have a comparatively worse quality of life. The results of our study
may improve provider understanding of the general public’s preconceived notions of childhood cancer and identify gaps in patient education.
Page 2 of 9
Methods
Study setting and subject characteristics
Subjects were enrolled at general pediatrics clinics in
Eskenazi Health, located in an urban area of Indianapolis, Indiana. The Eskenazi system provides healthcare for
over 1 million outpatient visits by the diverse, urban residents of Marion County [14]. We approached adults
waiting for pediatric visits if they had a child who was
less than 18 years of age. We excluded subjects who had
ever had a child with cancer. We approached patients
that spoke either English or Spanish, as we have bilingual research assistants available.
Health utility standard gamble
Health utilities are commonly studied using the Standard Gamble (SG) technique, which measures individual
preferences for different therapeutic options amidst uncertain results [9, 10]. We randomized subjects to receive either scenarios which described “a serious illness”,
or scenarios explained as “cancer”, differing only by that
label. The two groups of scenarios were otherwise
identical, and subjects were presented with three different clinical situations: one depicting a disease that is
responding to treatment (Scenario 1), one depicting a
disease that is stable on treatment (Scenario 2), and one
depicting a disease that is not responding to treatment
(Scenario 3). The text of these scenarios can be found in
Appendix A. The scenarios were prearranged in order of
severity along with our anchor scenarios merely stating
“a quick and painless death” as first and “perfect health”
as last. Thus, a list of 5 scenarios in total were presented
to the participant to read all together from worst case
scenario to best case scenario (death, scenario 3, scenario 2, scenario 1, perfect health) because the order felt
to be universally agreed upon. A quick and painless
death was used as the anchor point for simplicity and
precedence [11]. Many different “0” anchor points are
possible, but our past experience with this methodology
indicates that a simple presentation of the “death” end of
the spectrum produces more consistent results and allows easier comparison to previous studies [11, 12].
We then performed the Standard Gamble technique to
ascertain health utilities [15]. Beginning with death and
the scenario where disease was not responding to treatment (Scenario 3), we asked the subject to imagine that
their child could either continue with the scenario in
question, or take a medication which cures him or her,
but carries a risk of death. We started with the medication having a 50% chance of curing the disease and 50%
chance of causing a quick and painless death. We iteratively moved the likelihood of death up or down depending on their response until the subject was indifferent
about the outcome. In other words, we sought out the
highest amount of risk a caregiver was willing to take
McElderry et al. BMC Psychology
(2019) 7:8
with a curative medication. Once this point of indifference was ascertained, we changed the gamble so that the
most recently assessed scenario of a disease not
responding to treatment (Scenario 3) was moved in
place of death, and the next scenario up the chain, one
depicting a disease stable on treatment (Scenario 2), was
assessed. We determined how much risk of the disease
becoming unresponsive to treatment a caregiver was
willing to take for a cure within the new disease state
(Scenario 2). This laddering was then done a third time,
assessing a disease responding to treatment (Scenario 1)
by giving the caregiver the option to stay in the current
state or take a curative medication that had a risk of the
child’s illness becoming merely stable on treatment (Scenario 2). A gamble percentage was ultimately established
between each scenario. These percentages were then
used to compute the health utility for each scenario with
the formulas found in Appendix B.
Numeracy assessment
After the gamble was complete, we asked each caregiver
a series of questions of increasing difficulty to assess numeracy. Numeracy is the subject’s understanding of percentage values and probabilities and how to interpret
them and is also known as mathematical literacy. The
assessment can be found in Appendix C.
Demographics
We gathered demographic data for both the participant
and the child (age, race, ethnicity, and gender), household income, highest level of caregiver education, number of children in the family, and whether the family was
a single parent household.
Statistical analysis
Prior to the start of the study, we performed power calculations for the comparison between the set of scenarios explained as cancer and the set of scenarios
explained as a serious illness. We wished to detect a difference of 0.05 between the median “serious illness” utility and the median “cancer” utility for children, with an
estimated initial utility of 0.85 for a serious illness. Since
no studies have analyzed these health states from the general public’s point of view, this starting point was based off
of childhood cancer studies assessing current patient’s
quality of life [16, 17]. With a power of 80% and an α of
0.05, we estimated that we needed 126 subjects total.
The health utility scores generated for each scenario
were calculated based off of the formulas found in
Appendix B. We used univariate statistics to compare
demographic data of each arm (“cancer” or “serious illness”) using the Student’s t-test for continuous data and
the chi-square test for categorical data. We then compared the median health utilities of each scenario and all
Page 3 of 9
scenarios in aggregate using the Mann-Whitney test for
medians. We chose a non-parametric test to compare
the two arms, since health utilities are unlikely to be
normally distributed. Finally, we performed multivariate
logistic regression using health utility greater than the
75th percentile as the dependent variable, and numeracy,
income, employment, race, and ethnicity (of subject) as independent variables. Since the distribution was nonparametric, we chose logistic regression over linear regression.
All analyses were considered significant at p < 0.05.
Models were built and statistics performed using R, version 3.22 (). The Institutional Review Board at Indiana University School of Medicine
approved the study with expedited status.
Results
Subject Participation
A total of 319 people were approached to participate in
the survey. Of those, 199 subjects were consented, and
167 subjects completed the study (see Fig. 1). Of those
that completed the study, 81 subjects completed the
“serious illness” scenarios and 86 subjects completed the
“cancer” scenarios.
Participant Demographics
Participant demographic characteristics are shown in
Table 1. By univariate analysis, there were no significant
differences in the number of participants randomly
assigned to the “cancer” scenarios and the “serious illness” scenarios within each assessed demographic. Approximately half of the caregivers and their children
were black and 18% were Hispanic. A little under half
were unemployed at the time of enrollment and over
half had an annual gross family income below $25,000.
Half of the participants accurately answered the first numeracy assessment question, roughly a third answered
the second question correctly, and only 4% answered the
third numeracy question correctly.
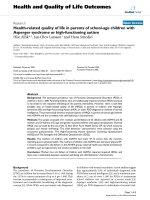
Health Utilities
We calculated the median and interquartile range (IQR)
for the health utility in each individual scenario as well
as the aggregate median and IQR for each arm, which
can be seen in Fig. 2. The aggregate health utility for all
three “cancer” scenarios was 0.61 (IQR: 0.29,0.86), which
was significantly lower (Mann-Whitney u score: 27512,
z-score: − 2.37, p-value: 0.018) than the aggregate “serious illness” scenarios’ median of 0.72 (IQR: 0.42,0.92).
Median health utility values assigned for scenario 3 of
“cancer” (0.39, IQR: 0.10,0.49) were also significantly
lower (Mann-Whitney u score: 2810.5, z-score: − 2.15,
p-value = 0.032) than equivalent “serious illness” scenarios (0.49, IQR: 0.23,0.61).
McElderry et al. BMC Psychology
(2019) 7:8
Page 4 of 9
Fig. 1 CONSORT Diagram. Flowchart of the number of subjects enrolled at each point in the study. “Other” includes those who did not
understand the questions, determined by the administering researcher or subject themselves, or had specific reasons for not participating, such
as a need to watch their kids closely. Most who agreed to participate but were unable to complete the survey ran out of time before being
called back for their doctor’s appointment
The health states assigned to scenario 1 (illness
responding to treatment) and scenario 2 (stable) for
“cancer” and “serious illness” were not significantly different. For the scenarios describing an illness responding
to treatment (Scenario 1), those that mentioned cancer
were assigned a median health utility of 0.88 (IQR:
0.63,0.97) and those that were described as a serious illness were assigned a median health utility of 0.90 (IQR:
0.79,0.98) with a p-value of 0.32 (Mann-Whitney u value:
3169, z-score: − 1.00). For the scenarios describing a
stable illness (Scenario 2), those that mentioned cancer
were assigned a median health utility of 0.69 (IQR:
0.41,0.83) and those that were mentioned as a serious
illness were assigned a median health utility of 0.74
(IQR: 0.50,0.84) with a p-value of 0.19 (Mann-Whitney u
value: 3073, z-score: − 1.3).
Regression Model
The results of the logistic regression model are shown in
Table 2. We controlled for family income, employment
status, numeracy, race, and ethnicity, none of which
were significant. In our model, the only statistically significant determinant of health utility score was our variable of interest: whether the term “cancer” was used or
not in the scenarios, although the confidence interval
was very close to 1.00, with a p-value of 0.048.
McElderry et al. BMC Psychology
(2019) 7:8
Page 5 of 9
Table 1 Comparison of Collected Demographic Data between Participants of Cancer and Non-Cancer Scenarios
Caregiver Age
Patient Age
Caregiver Gender
Caregiver Race
Patient Race
Caregiver Ethnicity
Patient Ethnicity
All Scenarios
N = 167
“Cancer” Scenario
N = 86
Non-cancer Serious
Illness Scenario
N = 81
median (interquartile range)
32 (19,45)
31 (16,46)
33 (10)
0.70
mean (standard deviation)
32.9 (10)
32.9 (11)
32.8 (9)
0.94
median (interquartile range)
7 (0,17)
8 (0,18)
7 (0,16)
0.85
mean (standard deviation)
7.7 (6)
7.8 (6)
7.5 (5)
0.72
Female
89/167 (53%)
43/86 (50%)
46/81 (57%)
0.38
0.50
Black
85/167 (51%)
46/86 (54%)
39/81 (48%)
White
53/167 (32%)
23/86 (27%)
30/81 (37%)
Asian
4/167 (2%)
2/86 (2%)
2/81 (3%)
Other
25/167 (15%)
15/86 (17%)
10/81 (12%)
Black
80/167 (48%)
44/86 (51%)
36/81 (44%)
White
45/167 (27%)
18/86 (21%)
27/81 (33%)
Asian
3/167 (2%)
1/86 (1%)
2/81 (3%)
Other
39/167 (23%)
23/86 (27%)
16/81 (20%)
Hispanic
31/167 (19%)
14/86 (16%)
17/81 (21%)
Non-Hispanic
135/167 (81%)
72/86 (84%)
63/81 (78%)
Unknown
1/167 (1%)
0/86 (0%)
1/81 (1%)
Hispanic
39/167 (23%)
18/86 (21%)
21/81 (26%)
Non-Hispanic
126/167 (75%)
68/86 (79%)
58/81 (72%)
Unknown
2/167 (1%)
0/86 (0%)
2/81 (3%)
p-value
0.26
0.71
0.56
# Children in Family
median (interquartile range)
2 (0,4)
2 (0,4)
2 (1,3)
0.93
Highest Level of Education Achieved
Some high school
18/167 (11%)
5/86 (6%)
13/81 (16%)
0.24
High school graduate
67/167 (40%)
35/86 (41%)
32/81 (40%)
Some college
46/167 (28%)
24/86 (28%)
22/81 (27%)
College graduate
20/167 (12%)
13/86 (15%)
7/81 (9%)
Graduate school
14/167 (8%)
7/86 (8%)
7/81 (9%)
91/167 (55%)
50/86 (58%)
41/81 (51%)
0.33
< 10 k
54/167 (32%)
29/86 (34%)
25/81 (31%)
0.41
10-25 k
44/167 (26%)
26/86 (30%)
18/81 (22%)
25-50 k
35/167 (21%)
14/86 (16%)
21/81 (26%)
50-75 k
8/167 (5%)
3/86 (4%)
5/81 (6%)
75-100 k
8/167 (5%)
5/86 (6%)
3/81 (4%)
> 100 k
5/167 (3%)
5/86 (6%)
0/81 (0%)
Refused
13/167 (8%)
4/86 (5%)
9/81 (11%)
79/167 (47%)
36/86 (42%)
43/81 (53%)
0.15
Question 1 correct
82/167 (49%)
42/86 (49%)
40/81 (49%)
0.94
Question 2 correct
50/167 (30%)
28/86 (33%)
22/81 (27%)
0.45
Question 3 correct
6/167 (4%)
3/86 (4%)
3/81 (4%)
0.94
Employed
Annual Family Income (US dollars)
Single Parent Household
Numeracy
Discussion
In this health utility study, we used the Standard Gamble
method to show that using the term “cancer” when describing a serious illness in children leads to lower health
utilities as expressed by caregivers of healthy children.
“Cancer” scenarios were assigned a median health utility
score of 0.61, compared with a significantly higher score
of 0.72 for “serious illness” scenarios with the same description. This means that on average, the general public
views their child as having a worse quality of life when
they hear the disease is cancer rather than a generic serious illness, even if the disease experience is otherwise
McElderry et al. BMC Psychology
(2019) 7:8
Page 6 of 9
Fig. 2 Median health utility scores assigned to cancer and non-cancer scenarios with interquartile range and p-values
further research on understanding the unique effect
that the risk of developing cancer has on the therapeutic choices that caregivers make on behalf of their
children, and tailor discussions to be sensitive to this
fact [6–8]. By awarding “cancer” health states a lower
identical. This finding has important implications for discussing interventions with parents when their child has a
risk of cancer. A number of immunosuppressants,
radiological tests, and emerging therapies have a small
risk of cancer; this study can provide a framework for
Table 2 Multivariate Regression Analysis of Demographic Information on Health Utility Assignment
Non-Cancer Serious Illness Scenario
Odds Ratio
“Cancer” Language Used
Numeracy
Annual Family Income (US dollars)
All Scenarios
Odds Ratio
95% Confidence
Interval
p-value
0.92
0.84,1.00
0.048
0.94
0.87, 1.02
0.13
1.04
0.96, 1.14
0.31
1.06
0.98, 1.15
0.16
Question 2 correct
1.03
093, 1.13
0.60
1.03
0.94, 1.13
0.50
Question 3 correct
1.06
0.83, 1.36
0.65
1.07
0.84, 1.35
0.59
< 10 k
Reference
–
–
–
–
–
10-25 k
1.00
0.89, 1.12
0.97
1.04
0.93, 1.16
0.49
25-50 k
0.96
0.84, 1.09
0.52
1.07
0.95, 1.21
0.26
50-75 k
1.04
0.84, 1.28
0.71
1.05
0.87, 1.28
0.61
75-100 k
1.01
0.80, 1.28
0.90
1.14
0.92, 1.42
0.24
> 100 k
0.92
0.70, 1.21
0.54
1.05
0.81, 1.36
0.74
Refused
Ethnicity
p-value
Question 1 correct
Employed
Race
95% Confidence
Interval
1.24
1.04, 1.47
0.017
1.23
1.05, 1.45
0.01
0.93
0.84, 1.03
0.15
0.99
0.90, 1.08
0.77
Black
Reference
–
–
–
–
–
Asian
0.80
0.58, 1.11
0.18
0.90
0.66, 1.22
0.49
White
0.98
0.87, 1.10
0.70
0.99
0.89, 1.11
0.93
Other
0.90
0.79, 1.03
0.13
0.94
0.83, 1.07
0.38
Hispanic
Reference
–
–
–
–
–
Non-Hispanic
1.02
0.89, 1.17
0.76
1.07
0.94, 1.22
0.33
Unknown
1.10
0.74, 1.65
0.64
1.14
0.78, 1.67
0.50
McElderry et al. BMC Psychology
(2019) 7:8
quality of life measure than identical “serious illness”
health states, parents reveal a possible gap in knowledge that could be filled in the discussion of treatments with a risk of cancer.
The strongest effect on perceived health utility seemed
to occur for the third scenario, which was the disease
state not responding to treatment. The “cancer” scenario
had a median health utility score of 0.39, while the “serious illness” scenario not responding to treatment had a
significantly higher median health utility score of 0.49.
Thus, the mention of cancer to the participant was influential in the most critical disease state, further supporting our hypothesis. We speculate that preconceived
notions about cancer, influenced by either media portrayal or experiences with people other than their children, play a role in caregiver decision making [3, 4].
Inherent biases may cause caregivers to rely less on the
facts of their child’s state and more on a sociologically
and/or personally constructed perception of cancer. This
misperception may influence some caregivers to avoid or
doubt important diagnostics or treatments with a risk of
cancer for their child. Awareness of this bias is important for both providers and caregivers, who may be unaware of this potential barrier to care. We hope to begin
the conversation on a possible area in patient-physician
dialogue needing further explanation.
A search of the literature did not reveal any studies
specifically asking parents of healthy children about
health utilities of childhood cancer. Prior research on
childhood cancer utilities has been accomplished by administering questionnaires to parents of children already
affected by cancer and assigning a health utility score to
their child’s experience during treatment. The literature
shows higher health utilities in childhood acute lymphoblastic leukemia (ALL) (0.74–0.88 depending on stage of
treatment), the most studied of the childhood cancers,
than the childhood cancer health utility values we generated [16, 17]. We believe this is partly because childhood
ALL typically has a good prognosis [16, 17]. Our scenarios covered good, fair, and poor prognoses. Another contributing factor could be from these caregivers having a
more realistic expectation of the quality of life with
childhood cancer. This may further illustrate the general
public’s potentially misguided perception of childhood
cancer as a worse quality of life than it is for common
cancers prior studies investigated. When parents do have
a child with cancer, they are more extensively informed
about the prognosis and therefore seem to make more
reasoned and balanced decisions. This suggests that
“cancer” may have an emotive influence on parents of
healthy children. We believe this has the potential to impact parental decision making in relation to their children undertaking tests or treatments that may carry
with it a risk of cancer. Ultimately, our research is meant
Page 7 of 9
to start a conversation in a new avenue about the public
perception of childhood health utility states.
While our investigation targeted a different audience
(i.e. caregivers rather than patients), our health utility
scores for childhood cancer align more closely to the
work done from the societal perspective of adult metastatic breast cancer, where subjects assigned a health
utility score of 0.79 for disease responding to treatment,
0.72 for stable disease on treatment, and 0.45 for worsening disease progression [13]. This reinforces the general public’s perception of cancer with similar health
utility values to those we generated. Thus, our study fills
an important gap in the literature by highlighting the
perceptions of childhood cancer by caregivers of healthy
children.
This study has important limitations. First, comparing
something general like a “serious illness” to something
more specific like cancer could raise concerns that any
specific disease may be viewed more negatively than a
generic serious illness. While this is possible, we explained both diagnoses with the same exact specific description. We covered functional state, symptoms, pain
level, mental health, and parental concern to clarify and
give specifics on the serious illness so that it was defined.
This study is ultimately meant to be a starting point for
future studies to then compare childhood cancer to
other similarly serious diseases like inflammatory bowel
disease, cystic fibrosis, diabetes, and so many more. Second, the study’s population primarily included high
numbers of participants of low socioeconomic status,
low levels of education, minority race populations, and
low numeracy. The sample for this study is therefore not
necessarily representative of the general public but can
still provide insight into the preferences of many populations, specifically people of color and lower socioeconomic status, who are traditionally underrepresented in
clinical research. Future studies should seek to determine perspectives about cancer from caregivers of
healthy children in a larger variety of scenarios and differing demographic categories.
Conclusion
The use of the term “cancer” lowers perceived health
utilities in caregivers of healthy children when compared
to an identical serious illness. We aim to establish a concern with the public’s understanding of this serious disease and question how it impacts decision making when
a risk of cancer is present. Awareness of this bias is important when discussing treatment options with a risk of
cancer with families. Our study provides a framework
for future studies to clarify this notion and contributes
to the understanding of the public’s perception of childhood cancer disease states.
McElderry et al. BMC Psychology
(2019) 7:8
Appendix 1
Serious Illness Scenarios
Scenario 1
Your child has a serious illness that is responding to treatment. Your child needs to be brought into the outpatient
clinic for continuous cycles of treatment. The treatment
makes your child anxious and he/she does not like being
in the hospital, but your child does not seem to be too
concerned about their illness. He/she is occasionally nauseous, but your child’s appetite is good. Their energy level
seems to be the same as other kids his/her age. Your child
experiences pain infrequently that can be treated with oral
medication. You worry for your child, but you are hopeful
they will be healthy in the future.
Scenario 2
Your child has a serious illness that is stable on treatment. Your child needs to be brought into the outpatient
clinic for continuous cycles of treatment. The treatment
makes your child anxious and he/she does not like being
in the hospital. Your child does not have a good appetite
and motivating him/her to eat is difficult. Your child is
constantly nauseous. Your child gets tired often, but can
still interact with you and others for short periods of
time. This makes your child aware that they are not like
other kids their age. Your child sometimes experiences
pain which can be treated with oral medication. There is
a worry that the illness will get worse in the future.
Scenario 3
Your child has a serious illness that is not responding well
to treatment. Your child is on his/her second line of treatment, as the first treatment was unsuccessful at stopping
the progression of the illness. Your child is getting worse
even on the second line of treatment. The treatment
makes your child anxious and/or depressed and he/she
does not like being in the hospital. The depressed mood
seems to be constant. Your child experiences severe fatigue and is losing a lot of weight. Your child is on a stronger oral pain medication and is regularly nauseous and
vomiting. Your child is not able to play with other kids
and is aware he/she is not like the other kids. You and
your child are worried they will die of their illness.
Cancer Scenarios
Scenario 1
Your child has cancer that is responding to treatment.
Your child needs to be brought into the outpatient clinic
for continuous cycles of treatment. The treatment makes
your child anxious and he/she does not like being in the
hospital, but your child does not seem to be too concerned about their cancer. He/she is occasionally nauseous, but your child’s appetite is good. Their energy level
Page 8 of 9
seems to be the same as other kids his/her age. Your
child experiences pain infrequently that can be treated
with oral medication. You worry for your child, but you
are hopeful they will be healthy in the future.
Scenario 2
Your child has cancer that is stable on treatment. Your
child needs to be brought into the outpatient clinic for
continuous cycles of treatment. The treatment makes
your child anxious and he/she does not like being in the
hospital. Your child does not have a good appetite and
motivating him/her to eat is difficult. Your child is constantly nauseous. Your child gets tired often but can still
interact with you and others for short periods of time.
This makes your child aware that they are not like other
kids their age. Your child sometimes experiences pain
which can be treated with oral medication. There is a
worry that the cancer will progress in the future.
Scenario 3
Your child has cancer that is not responding well to
treatment. Your child is on his/her second line of treatment, as the first treatment was unsuccessful at stopping
the progression of the disease. Your child is getting
worse on the second line of treatment. The treatment
makes your child anxious and/or depressed and he/she
does not like being in the hospital. The depressed mood
seems to be constant. Your child experiences severe fatigue and is losing a lot of weight. Your child is on a
stronger oral pain medication and is regularly nauseous
and vomiting. Your child is not able to play with other
kids and is aware he/she is not like the other kids. You
and your child are worried they will die of their cancer.
Appendix B
Health Utility Score Formulas
To calculate the utility of each scenario for each subject,
we converted each final % chance given by the subject
into a utility value using the following formula, assuming
the ranking of Perfect health ≥ Scenario 1 (responding
to treatment) ≥ Scenario 2 (stable on treatment) ≥
Scenario 3 (not responding to treatment) ≥ Death:
Gamble (G)= the % chance of death given by the subject in return for curing the condition.
Scenario 3 Utility = USc3 = GSc3.
Scenario 2 Utility =USc2 = GSc2 ∗ (1 − USc3)
Scenario 1 Utility= USc1 = GSc1 ∗ (1 − USc2)
Appendix C
Numeracy Assessment
Each answer was coded as correct or incorrect:
1. Imagine that we flip a fair coin 1000 times. What is
your best guess about how many times the coin
McElderry et al. BMC Psychology
(2019) 7:8
would come up heads in 1000 flips? (Correct
answer: 500)
2. Imagine that you are playing the BIG BUCKS
LOTTERY, and the chance of winning a $10 prize
is 1%. What is your best guess about how many
people would win a $10 prize if 1000 people each
buy a single ticket to the BIG BUCKS LOTTERY?
(Correct answer: 10)
3. Imagine you have entered the PUBLISHING
SWEEPSTAKES, where the chance of winning a car
is 1 in 1000. What percent of tickets to the
PUBLISHING SWEEPSTAKES win a car? (Correct
answer: 0.10%)
Abbreviations
ALL: Acute lymphoblastic leukemia; CI: Confidence Interval; IQR: Interquartile
Range; OR: Odds Ratio; QALYs: Quality Adjusted Life Years; QOL: Quality of Life;
SG: Standard Gamble technique; vNM: von Neumann-Morgenstern utility function
Acknowledgements
Thank you to Stacy Keller for assistance with Institutional Review Board approval.
Funding
This project was funded by the Indiana Medical Student Program for
Research and Scholarship (IMPRS) through the T35 HL110854 Training Award
(BMM), the Indiana Clinical and Translational Research Institute, and the
Section of Pediatric and Adolescent Comparative Effectiveness Research in
the Department of Pediatrics at Indiana University School of Medicine (WEB).
Availability of data and materials
The datasets used and/or analyzed during the current study are available
from the corresponding author on reasonable request.
Authors’ contributions
BMM and WEB conceptualized and designed the study, acquired data,
analyzed and interpreted the data, and drafted and approved the
manuscript. ELM and AEC conceptualized the study, analyzed and
interpreted the data, and edited and approved the manuscript. AG acquired,
analyzed and interpreted the data, and edited and approved the manuscript.
All authors agree to be accountable for all aspects of the work.
Ethics approval and consent to participate
The Institutional Review Board at Indiana University School of Medicine
approved the study with expedited status. Verbal, informed consent was
provided by every participant. Information about the study was provided by a
written information statement and via verbal explanation. Consent forms
included details of the purpose of the study, what the study entailed, benefits,
risks, ability to withdraw without penalization, and voluntary nature of the study.
Consent for publication
not applicable.
Competing interests
The authors declare that they have no competing interests.
Publisher’s Note
Springer Nature remains neutral with regard to jurisdictional claims in
published maps and institutional affiliations.
Author details
1
Indiana University School of Medicine, Indianapolis, USA. 2Center for
Pediatric and Adolescent Comparative Effectiveness Research, Department of
Pediatrics, Indiana University School of Medicine, Indianapolis, USA. 3Section
of Pediatric Hematology and Oncology, Department of Pediatrics, Indiana
University School of Medicine, Indianapolis, USA. 4Indiana University,
Bloomington, USA. 5Section of Pediatric Gastroenterology, Hepatology, and
Page 9 of 9
Nutrition, Department of Pediatrics, Indiana University School of Medicine,
Indianapolis, USA.
Received: 12 November 2018 Accepted: 8 February 2019
References
1. Ward E, DeSantis C, Robbins A, et al. Childhood and adolescent cancer
statistics. CA Cancer J Clin. 2014;64(2):83–103.
2. Howlader NA, Noone AM, Krapcho M, et al. SEER Cancer Statistics Review,
1975–2008, National Cancer Institute. Bethesda, MD. Based on November
2010 SEER data submission, posted to the SEER web site, 2011.
3. Pavisic L, Chilton J, Walter G, et al. Childhood Cancer in the cinema: how
the celluloid Mirror reflects psychosocial care. J Pediatr Hematol Oncol.
2014;36(6).
4. Clarke J. Portrayal of childhood Cancer in English language magazines in
North America: 1970-2001. J Health Commun. 2005;10(7):593–607.
5. Happer C, Philo G. The role of the Media in the Construction of public
belief and social change. J Soc Polit Psychol. 2013;1(1):321–36.
6. Calip GS, Patel PR, Adimadhyam S, et al. Tumor necrosis factor-alpha
inhibitors and risk of non-Hodgkin lymphoma in a cohort of adults with
rheumatologic conditions. Int J Cancer. 2018; [Epub ahead of print].
7. Pasternak B, Svanstrom H, Schmiegelow K, et al. Use of azathioprine and the
risk of Cancer in inflammatory bowel disease. Am J Epidemiol. 2013;177(11).
8. Pearce MS, Salotti JA, Little MP, et al. Radiation exposure from CT scans in
childhood and subsequent risks of leukaemia and brain tumors: a
retrospective cohort study. Lancet. 2012;380:499–505.
9. Torrance G. Utility approach to measuring health-related quality of life. J
Chronic Dis. 1987;40(6):593–600.
10. Gafni A. The standard gamble method: what is being measured and how it
is interpreted. Hum Serv Res. 1994;29:2.
11. Torrance GW, Furlong W, Feeny D. Health utility estimation. Expert Rev
Pharmacoeconomics Outcomes Res. 2002;2(2):99–108.
12. Morimoto T, Fukui T. Utilities measured by rating scale, time trade-off, and
standard gamble: review and reference for health care professionals. J
Epidemiol. 2002;12:160–78.
13. Lloyd A, Nafees B, Narewska J, et al. Health state utilities for metastatic
breast cancer. Br J Cancer. 2006;95:683–90.
14. History. Eskenazi Health website. />history. Updated 2016. Accessed 17 Sept 2017.
15. Uebele A, Myers J. Assessing quality of life in clinical research. J Ky Med
Assoc. 2008;106(5):223–8.
16. Furlong W, Rae C, Feeny D, et al. Health-related quality of life among
children with acute lymphoblastic leukemia. Pediatr Blood Cancer. 2012;
59(4):717–24.
17. Sung L, Yanofsky R, Klaassen R, et al. Quality of life during active treatment for
pediatric acute lymphoblastic leukemia. Int J Cancer. 2010;128(5):1213–20.