Enhanced early visual processing in response to snake and trypophobic stimuli
Bạn đang xem bản rút gọn của tài liệu. Xem và tải ngay bản đầy đủ của tài liệu tại đây (1.03 MB, 8 trang )
Van Strien and Van der Peijl BMC Psychology (2018) 6:21
/>
RESEARCH ARTICLE
Open Access
Enhanced early visual processing in
response to snake and trypophobic stimuli
Jan W. Van Strien*
and Manja K. Van der Peijl
Abstract
Background: Trypophobia refers to aversion to clusters of holes. We investigated whether trypophobic stimuli
evoke augmented early posterior negativity (EPN).
Methods: Twenty-four participants filled out a trypophobia questionnaire and watched the random rapid serial
presentation of 450 trypophobic pictures, 450 pictures of poisonous animals, 450 pictures of snakes, and 450
pictures of small birds (1800 pictures in total, at a rate of 3 pictures/s). The EPN was scored as the mean activity at
occipital electrodes (PO3, O1, Oz, PO4, O2) in the 225–300 ms time window after picture onset.
Results: The EPN was significantly larger for snake pictures than for the other categories, and significantly larger for
trypophobic pictures and poisonous animal pictures than for bird pictures. Remarkably, the scores on the trypophobia
questionnaire were correlated with the EPN amplitudes for trypophobic pictures at the occipital cluster (r = −.46, p = .025).
Conclusions: The outcome for the EPN indicates that snakes, and to a somewhat lesser extent trypophobic stimuli and
poisonous animals, trigger early automatic visual attention. This supports the notion that the aversion that is induced by
trypophobic stimuli reflects ancestral threat and has survival value. The possible influence of the spectral composition of
snake and trypophobic stimuli on the EPN is discussed.
Keywords: EEG/ERP, early posterior negativity (EPN), Trypophobia, Snake detection, Phylogenetic fear, Evolution
Background
People may experience discomfort or aversion when seeing images of clusters of circular objects in proximity to
each other, such as honeycombs or seed heads of the
lotus flower. This irrational fear of holes or “trypophobia” has been documented only recently in the psychological literature [1, 2], yet has already been the topic of
numerous current follow-up studies (e.g, [3–7]). Trypophobia is clearly manifest in 15% of the general population, but nonphobic individuals still rate trypophobic
pictures as being less comfortable to view when compared to control pictures [2]. Here, we will use the term
“trypophobic” to indicate the potentially aversive visual
characteristics of pictures containing clusters of holes.
By using this term, we do not suggest that the visual
characteristics of these pictures are sufficient for inducing a phobic reaction in most individuals. Individual
proneness to trypophobia can be assessed with a
* Correspondence:
Department of Psychology, Education and Child Studies, Erasmus University
Rotterdam, PO Box 1738, 3000, DR, Rotterdam, The Netherlands
symptom scale developed by Le et al. [1], [see Method
section for a description]. Trypophobia proneness does
not correlate with trait anxiety [1, 6], but appears to be
associated with core disgust sensitivity, personal distress,
and proneness to visual discomfort [5].
Cole and Wilkins [2] noted the visual nature of trypophobia and performed a spectral analysis on trypophobic
and control images. Compared to the control images,
the trypophobic images had an excess of contrast energy
at midrange spatial frequencies. Further, they analyzed
images of the ten most poisonous animals, and images
of snakes and spiders. As with the trypophobic images,
these images showed relatively high contrast at midrange
spatial frequencies. The origin of the trypophobic aversion is therefore thought to be based on its survival
value: the visual characteristics of trypophobic stimuli
are also found in many highly poisonous animals, and
may be triggering automatic threat responses in the
brain. Interestingly, a recent study [6] found higher electrodermal responses when participants were viewing trypophobic images compared to control images, which
© The Author(s). 2018 Open Access This article is distributed under the terms of the Creative Commons Attribution 4.0
International License ( which permits unrestricted use, distribution, and
reproduction in any medium, provided you give appropriate credit to the original author(s) and the source, provide a link to
the Creative Commons license, and indicate if changes were made. The Creative Commons Public Domain Dedication waiver
( applies to the data made available in this article, unless otherwise stated.
Van Strien and Van der Peijl BMC Psychology (2018) 6:21
indicates a heightened fear response to trypophobic
stimuli. Like fears and phobias towards phylogenetically
threatening stimuli such as snakes and spiders, the aversion toward clusters of holes may reflect an evolved preparedness to acquire fear of ancestral threats [8].
Previous studies [9–14] have established that the early
posterior negativity (EPN) is highly responsive to phylogenetic fear stimuli. The EPN is an event-related potential (ERP) that reflects early automatic processing of
emotionally significant visual information. The EPN is
most noticeable at lateral occipital electrodes between
225 and 300 ms after stimulus onset [15]. The EPN indexes ‘natural selective attention’ [16] and the EPN amplitude is amplified by stimuli of evolutionary significance
[17]. Given the assumed survival value of trypophobic
stimuli, we expected trypophobic stimuli to evoke larger
EPN amplitudes than nontrypophobic stimuli. The EPN
is often recorded while using a rapid serial visual presentation (RSVP) paradigm. With the RSVP paradigm, a
continuous stream of emotional and neutral pictures is
presented at a rate of several (typically three) pictures
per second to participants who are passively viewing.
The RSVP paradigm makes good evolutionary sense because it requires the rapid processing of emotional stimuli under a high processing load [18].
Employing RSVP, we here compare the EPN responses
to trypophobic pictures and to poisonous animal pictures with the EPN responses to snake pictures, which
in our previous research elicited the highest EPN amplitudes, and to bird pictures, which elicited the lowest
EPN amplitudes [12, 14]. Snake pictures and bird pictures thus serve in the present research as reference
conditions for the typical EPN responses to phylogenetic
threatening and non-threatening stimuli, respectively.
The strongly enhanced EPN amplitudes in response to
snake pictures [9, 11–14] have been taken as support for
Isbell’s snake detection theory (SDT) [19, 20], which
states that the predatory pressure of snakes on primate
evolution caused changes in the primate visual system
favoring individuals with better ability to visually detect
these often hidden and motionless animals. Further support for Isbell’s theory is found by neurophysiological research in macaques that has demonstrated the existence
of pulvinar neurons that respond selectively faster and
stronger to snake stimuli than to monkey face and hand
stimuli [21, 22]. These pulvinar neurons may be part of
a feedforward pathway that facilitates processing in the
visual cortex [23, 24].
Given the hypothesized survival value of trypophobic
pictures and pictures of highly poisonous animals, we
would expect in any case larger EPN amplitudes in response to these categories than to bird pictures. We have
no clear hypothesis regarding the difference between the
EPN amplitudes in response to trypophobic and
Page 2 of 8
poisonous animal pictures on the one hand and snake pictures on the other hand. The research of Cole and Wilkins
[2] demonstrated that snake pictures, like trypophobic
stimuli, had an excess of contrast energy at midrange
spatial frequencies. This could implicate comparably enhanced EPN amplitudes to these three categories. The
SDT however, proposes that the robust EPN snake effect
is specific to the visual perception of snakes and not to the
visual perception of other poisonous animals [19, 20]. For
that reason, larger EPN amplitudes in response to snake
pictures than in response to trypophobic and poisonous
animal pictures may be expected.
We further explored whether the individual degree of
trypophobia proneness, as measured by a symptom
scale, was associated with the EPN amplitude in response to trypophobic pictures.
Method
Participants
Twenty-four Dutch university students (12 men, 12
women) with normal or corrected-to-normal vision participated for course credits. Ages ranged from 18 to
26 years, with a mean age of 20.38 years. The study was
conducted in accordance with the Declaration of
Helsinki and approved by the Ethics Committee of the
Department of Psychology, Education and Child Studies
of the Erasmus University Rotterdam. All participants
provided written informed consent.
Questionnaires
Prior to the experimental run, the participants rated their
fear of holes by means of the Trypophobia Questionnaire
(TQ; Le et al., 2015). The TQ contains 17 items regarding
the most common symptoms as a result of viewing trypophobic images, such as “feel uncomfortable or uneasy”
and “feel sick or nauseous”. We showed the participants a
sheet with the 10 trypophobic pictures (in a 2 by 5 array)
that were used in the experiment and asked them to rate
the severity of the 17 TQ symptoms when looking at this
sheet. These symptoms were rated on a 5-point Likert
scale ranging from 1 (not at all) to 5 (extremely), with possible total TQ scores ranging from 17 to 85.
In addition, participants rated their fear of snakes on a
15-item questionnaire (see, Van Strien, Eijlers, et al.,
2014) with a 4-point Likert scale ranging from 0 (not
true) to 3 (very true), with possible total scores ranging
from 0 (no fear) to 45 (very high fear). For this questionnaire, no pictures were shown.
Following the experimental run, participants performed a computerized Self-Assessment Manikin (SAM)
questionnaire [25] regarding valence and arousal ratings
of all pictures on a 9-point scale. For each consecutive
picture, the participants first rated valence and then
Van Strien and Van der Peijl BMC Psychology (2018) 6:21
arousal. The order of pictures was random for each
participant.
Stimuli and procedure
Participants were seated in a dimly-lit room and were
told to attentively watch the random and continuous
RSVP of 450 snake pictures, 450 pictures of trypophobic
objects, 450 pictures of poisonous animals, and 450
pictures of small birds. These four different stimulus categories were not explicitly mentioned to the participants.
The random presentation ensured that each stimulus
category in the RSVP stream was preceded by all other
categories in an equal fashion, balancing any carry-over
effects. The presentation rate was 3 pictures per second,
with no blank between pictures. For each stimulus category, there were 10 different pictures that were shown
45 times Snake and bird pictures were obtained from
previous studies [12, 13]. Pictures of poisonous animals
were obtained from various internet sites. The 10 poisonous animals were the blue-ringed octopus, the box
jellyfish, the Brazilian wandering spider, the death stalker
scorpion, the marbled cone snail, the golden poison frog,
the puffer fish, the stone fish, the Portuguese man-ofwar and the Sydney funnel-web spider. The first eight
animals in this list were also in the list of the 10 most
poisonous animals employed by Cole and Wilkins
(2013). Because in our research snakes were a separate
stimulus category, we replaced two snakes from Cole
and Wilkins’ list with two other poisonous animals. Each
animal picture showed a complete specimen against a
natural background (see Fig. 1). Trypophobic images
were taken from various websites that were found with
Google Search using “trypophobia” as a search term.
The trypophobic picture set included barnacles, lotus
seeds, pepper seeds and membrane, sliced cantaloupe,
coral, honeycomb, and several spongy structures such as
in sandstone. All picture sets used in the current
research are available from the corresponding author.
The pictures were shown at a distance of 120 cm on a
PC monitor with a diagonal of 51 cm and a resolution of
1024 × 768 pixels. Pictures were displayed against a
medium grey background and had a size of 600 × 450
pixels, which resulted in a visual angle of 11.40° × 8.55°.
EEG recording and analysis
EEG recording was done with a BioSemi Active-Two
amplifier from 32 scalp sites with active Ag/ AgCl electrodes mounted in an electrode cap (10–20 system).
Electrooculogram (EOG) activity was recorded with active electrodes placed above and beneath the left eye,
and with electrodes placed at the outer canthus of each
eye. The EEG and EOG signals were digitized with a
sampling rate of 512-Hz and 24-bit A/D conversion.
Offline, the EEG signals were referenced to an average
Page 3 of 8
reference. All signals were filtered with a band pass of 0.
10–30 Hz (phase-shift-free filter, 24 dB/Oct). Horizontal
and vertical eye movements were corrected using the
Gratton and Coles algorithm [26]. ERP epochs were extracted with a 380-ms duration and beginning 50 ms before stimulus onset. The ERP signals were computed
relative to the mean of this 50-ms prestimulus baseline
period. For each participant and each condition, average
ERPs were defined. Epochs with a baseline-to- peak
amplitude difference larger than 100 μV on any channel
were omitted from averaging. In each condition, the
mean percentage of valid epochs at analysis-relevant
electrodes was more than 99% (with 450 presentations
per condition). Similar to previous research, the EPN
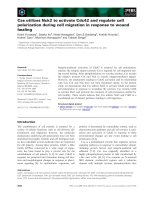
was scored at occipital electrodes (O1, O2, Oz, PO3, and
PO4; see Fig. 2) and was measured as the mean amplitude of the 225–300 ms time window after stimulus onset (e.g., Van Strien et al., 2016; Van Strien, Eijlers, et al.,
2014; Van Strien, Franken, et al., 2014).
Spatial frequency analysis
As a post-hoc check, the spectral compositions of the
pictures that were used in the present tasks, were measured by employing a discrete wavelet analysis on each
picture, using the Matlab routines freqspat.m and
freqspat_gui.m as described and provided by Delplanque
et al. [27]. With discrete wavelet analysis, the picture is
decomposed in eight independent spatial frequency
bands of which the energy is determined. If a picture
contains much small features (i.e., details), the analysis
will result in higher energy for high spatial frequencies.
If a pictures contains much large features, the analysis
will result in higher energy for low spatial frequencies.
We measured spatial frequencies in cycles per degree of
visual angle (cpd), which represents the frequencies perceived by an observer and depends on the distance between stimulus and observer. It should be noted that the
spatial frequency analysis was done after picture selection and did not play a role in this selection.
Statistical analyses
For the valence and arousal ratings, repeated-measures
analyses of variance (ANOVAs) were employed with
stimulus category (snakes, trypophobic objects, poisonous animals, birds) as factor. For the EPN components,
a repeated-measures ANOVA was conducted, with
stimulus category (snakes, trypophobic objects, poisonous animals, birds) and electrode (O1, Oz, O2, PO3,
PO4) as factors. When appropriate, Greenhouse-Geisser
correction was applied. To explore the relationship between reported trypophobia proneness and EPN amplitudes in response to trypophobic pictures, and between
snake fear and EPN amplitudes in response to snake pictures, we calculated the Pearson correlations between
Van Strien and Van der Peijl BMC Psychology (2018) 6:21
Page 4 of 8
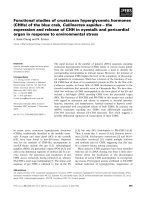
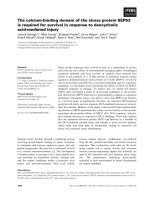
Fig. 1 Illustrative examples of snake, trypophobic, poisonous animal, and small bird stimuli. The depicted photographs are public domain
(pixabay.com); they are similar to the stimuli used in the present research
questionnaire scores and EPN amplitudes for trypophobic and snake stimuli, respectively. To reduce the number of correlations, we employed one occipital cluster
(comprising O1, O2, Oz, PO3, and PO4) for the EPN
amplitude measures. Possible differences in spatial
frequency power between the four stimulus categories
were tested using separate Kruskal-Wallis nonparametric
tests for each spatial frequency band.
Results
EPN
Fig. 2 Diagram of the EEG electrodes included in the statistical analysis
The ANOVA revealed a significant main effect of stimulus
category, F(3,69) = 25.28, ɛ = 0.765, p < 0.001, η2p = .524.
Bonferroni-corrected pairwise comparisons revealed that
the EPN was significantly more negative for snake pictures
than for the other categories (all p-values < .001, see
Fig. 3a for the mean ERPs across the five occipital electrodes). Trypophobic pictures (p = .001) and poisonous
animal pictures (p = .034) evoked a more negative EPN
than bird pictures. No significant difference in EPN
amplitude was found between trypophobic pictures and
poisonous animal pictures (p > .999).
The ANOVA further revealed a significant interaction
of stimulus category and electrode, F(12, 276) = 9.15,
ε = .445, p < .001, η2p = .285. As can be seen in Fig. 3b,
the enhanced EPN was more widespread (including PO3
and PO4) for snake pictures than for trypophobic and
poisonous animal pictures. To further evaluate the
significant interaction of stimulus category and
electrode, the stimulus category effects were tested at
single electrodes. These analyses revealed significant
stimulus category effects at all included electrodes (all
p-values < .001). Pairwise comparisons with Bonferroni
adjustment for multiple comparisons indicated that,
compared to bird pictures, snake pictures evoked
larger EPN amplitudes at all included electrodes (all
p-values < .001). Compared to bird pictures, trypophobic
Van Strien and Van der Peijl BMC Psychology (2018) 6:21
Page 5 of 8
a
b
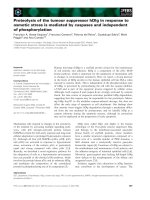
Fig. 3 a The early posterior negativity (EPN) in response to snake (red line), trypophobic (blue line), poisonous animal (green line) and bird
pictures (black line) across the five occipital electrodes (O1/2, Oz, PO3/4). The depicted waveform for each condition is the grand average of 24
participants with approximately 450 epochs per participant. Negativity is up. b Topographic maps of the differences in EPN mean amplitudes
(225–300 ms) between snake vs. bird pictures (left), trypophobic vs. bird pictures (middle), and poisonous animal vs. bird pictures (right)
pictures evoked larger EPN amplitudes at PO3, O1, Oz,
and O2 electrodes (all p-values ≤ .038). Compared to bird
pictures, poisonous animal pictures evoked larger EPN
amplitudes at O1 and Oz electrodes (both p-values ≤ .011).
TQ and snake fear scores
The mean TQ score was 21.04 (SD = 5.18; range 17–36),
indicating a relatively low trypophobic repulsion level in
the present sample. Remarkably, the TQ scores were
correlated with the EPN occipital cluster amplitudes in
response to trypophobic pictures (r = −.46, p = .025),
with participants that experienced higher aversion to
these stimuli showing larger EPN amplitudes.
The mean snake fear score was 11.75 (SD = 8.25; range
2–34); there was no significant correlation between the
fear ratings for snakes and the EPN occipital cluster amplitude measure in response to snake pictures (r = .02).
Valence and arousal ratings
The mean SAM valence and arousal ratings for snake
pictures, trypophobic pictures, poisonous animal pictures, and small bird pictures are given in Table 1. The
main stimulus category effects were significant for both
valence, F(3,69) = 18.19, ε = .649, p < .001, η2p = .442,
and arousal, F(3,69) = 14.80, ε = .591, p < .001, η2p = .391.
Bonferroni-corrected comparisons revealed that that
bird pictures were rated as more pleasant than pictures
of trypophobic objects, snakes, and poisonous animals
(all p-values <.001).
Pictures of poisonous animals were rated as more arousing than both bird pictures and trypophobic pictures (both
p-values < .009). In addition, snake pictures were rated as
more arousing than bird pictures (p < .001). There were
no difference in valence and arousal ratings between
remaining stimulus category pairs (all p-values > .398).
Table 1 Participants’ mean arousal and valence ratings (and
standard deviations)
Stimulus category
Valence (SD)
Arousal (SD)
Snakes
4.68 (1.92)
3.47 (1.97)
Trypophobic objects
4.30 (1.25)
2.23 (1.55)
Poisonous animals
4.53 (1.35)
3.63 (1.50)
Small birds
6.53 (1.21)
1.58 (.94)
Note. Valence and arousal ratings are based on a rating scale from 1 to 9
Van Strien and Van der Peijl BMC Psychology (2018) 6:21
Spatial frequency analysis.
Kruskal-Wallis tests revealed significant category effects
for the two highest spatial frequency bands (> 26.3 cpd,
p = .007; 13.2–26.3 cpd, p = .029). From Fig. 4 it can be
seen that snake pictures clearly exhibit higher energy for
these frequency bands when compared to the other categories. Although the energies for the midrange spatial
frequency bands (1.6–3.3 cpd and 3.3–6.6 cpd) were
slightly higher for trypophobic pictures compared to the
other categories, there were no further significant category effects (all p-values > .067).
Discussion
Using the RSVP paradigm, we compared the EPN responses to trypophobic and to poisonous animal pictures
with the EPN responses to snake pictures, which in previous research elicited the highest EPN amplitudes, and
to bird pictures, which elicited the lowest EPN amplitudes. Given the potential phylogenetic threat of trypophobic objects and poisonous animals, we expected
larger EPN amplitudes in response to trypophobic pictures and pictures of poisonous animals than to pictures
of birds. The EPN results were in line with our expectations, with the EPN being equally enhanced for trypophobic objects and poisonous animals when compared
to birds. Yet, as in previous research [11–13], snake pictures elicited the largest EPN when compared to the
three other stimulus categories.
The equally enhanced EPN amplitudes in response to
trypophobic and poisonous animal pictures indicate that
both stimulus categories attract early visual attention to
the same extent. As the EPN is thought to reflect natural
selective attention to stimuli of evolutionary significance
Page 6 of 8
[16, 17], this outcome may support the notion that the
origin of trypophobic aversion is based on its survival
value, with visual characteristics akin to that of poisonous animals triggering automatic threat detection responses in the brain [2].
However, when compared to trypophobic and poisonous animal pictures, snake pictures elicited even larger
EPN amplitudes. This robust EPN snake effect is identical
to the results obtained in our previous research involving
snake pictures, which all demonstrate the largest EPN amplitudes in response to snake stimuli [11–14]. The large
and consistent EPN enhancement in response to snake
pictures reflects high early capture of human visual attention by snakes and clearly supports Isbell’s SDT [19, 20].
According to the SDT, snakes have acted during evolution
as a selective pressure in the modification and expansion
of the primate visual system, resulting in greater visual
sensitivity to snakes than to other stimuli. The higher EPN
to snake pictures than to trypophobic and poisonous animal pictures could reflect a higher level of phylogenetic
threat in case of snakes. As snakes are venomous predators that actively chase and inoculate venom by biting
their prey, they were more life-threatening to our ancestors than other poisonous animals, which are only dangerous when touched or ingested.
It should be noted that, in addition to the trypophobic
and poisonous animal pictures from the present research, moderate EPN enhancements have been demonstrated in response to a variety of other emotional
stimuli, not necessarily representing phylogenetic threat
[18]. Therefore, it remains uncertain whether the EPN in
response to trypophobic and poisonous animal stimuli is
only determined by level of phylogenetic threat.
Fig. 4 Mean energy for each frequency band as a function of picture category. Error bars depict standard error of means. Frequency bands are
expressed in cycles per degree of visual angle. High spatial frequencies are on top
Van Strien and Van der Peijl BMC Psychology (2018) 6:21
In the present and previous studies, we employed naturalistic stimuli (i.e., realistic pictures of snakes, trypophobic objects, poisonous animals, and birds). By doing
so, we did not control for low-level visual features, such
as color, contrast, luminance, and spatial frequency of
the pictures, which might influence the EPN. In our research, there is always tension between ecological valid,
naturalistic stimuli and “vision-science” stimuli equated
for low-level visual characteristics. We here preferred to
use ecologically valid stimuli because the low-level features as such may be inherent properties of the fear
stimuli and may be important for threat detection. It is
obvious that, once the attention-grabbing and ERP
boosting effects of naturalistic stimuli are established, it
is worthwhile to detect the fundamental visual mechanisms of fear detection and to further study the formal
visual characteristics of these threat stimuli. Previous research has indicated that the effects of some low-level
features, such as color and luminance, on the EPN in response to snake pictures most probably are marginal.
Research employing brightness-equated grayscale pictures [28] or luminance- and contrast-equated color pictures [9] yields EPN snake effects that are highly
comparable to the effects that we have found with naturalistic stimuli.
Here we explored the spatial frequency characteristics
of the four stimulus categories, because previous research [2] has established an excess of contrast energy at
midrange frequencies for trypophobic and poisonous
animal stimuli. The range of spatial frequencies for
which an excess energy may induce discomfort has been
determined to be 1–8 cpd [29]. Although we found
slightly higher energies in midrange spatial frequency
bands (1.6–3.3 cpd and 3.3–6.6 cpd) for trypophobic
pictures compared to the other categories, we found no
statistically significant category effects for the energy in
midrange frequencies. It should be noted that the failure
to find such differences could be due to the small number of pictures in each category, which reduced the
power to detect any differences in midrange frequencies.
Our spatial frequency analysis did reveal an excess energy at higher spatial frequencies (> 13.2 cpd) for snake
pictures. This finding is in accordance with the results of
the spatial frequency analysis by Delplanque et al. [27],
which revealed that pictures of snakes from the International Affective Picture System [30] contain significantly more high frequency energy when compared to
pictures of other unpleasant animals. This excess of high
spatial frequencies may be caused by the typical snake
skin scales and scale patterns. Van Strien and Isbell [14]
found higher EPN amplitudes in response to close-ups
of snake skins than to close-ups of lizard skins and bird
feathers. In addition, blurring snake pictures, and thus
reducing the higher spatial frequencies, attenuated the
Page 7 of 8
EPN amplitudes when compared to non-blurred snake
pictures [31]. Future work should determine the specific
relationship between EPN amplitude and the energy of
high and midrange spatial frequencies.
In our sample, the trypophobia proneness of the participants as assessed by the TQ was rather low. Le et al.
[1] have suggested a TQ score above 31 as a criterion to
determine the existence of a real phobia. In our sample
only two one out of 24 participants (8%) met this criterion, which is lower than the estimated 15% of the general population [2]. Although in the present sample the
reported discomfort in response to trypophobic objects
was modest, and arousal scores were low, the EPN was
clearly enhanced in response to the trypophobic pictures. Moreover, the EPN amplitudes elicited by these
pictures correlated significantly with the TQ scores, with
participants with higher TQ scores showing larger EPN
amplitudes. This association suggests that individuals are
adequately aware of their physical responses to trypophobic stimuli and that the degree of these responses is
reflected in the EPN.
The EPN amplitudes elicited by snake pictures did not
correlate with snake fear scores. This is in agreement
with our previous studies, in which significant correlations for snake fear and EPN amplitude in response to
snake pictures were not found either [11–13]. This lack
of an association may be due to the fact that most of our
participants probably never have engaged snakes in the
wild and hence cannot adequately report their actual
fear of snakes. This is possibly also reflected in the participants’ relatively low arousal ratings for the snake pictures. The lack of an association between reported snake
fear and EPN amplitude is not inconsistent with the
SDT, which presumes that the early visual processing of
snakes is innate and automatic. In several previous studies, we have found an association between reported
spider fear and the EPN in response to spider stimuli
[12, 32]. Like for the TQ scores in the present research,
individuals may be adequately aware of their emotional
responses to spiders, which is reflected in the EPN.
Whether the supposed individual’s better conscious
awareness of emotional responses to trypophobic objects, poisonous animals, or spiders than to snakes is indicative a more non-evolutionary or cultural nature of
visual processing awaits further research.
Conclusion
We employed random RSVP of snake pictures, trypophobic pictures, poisonous animal pictures, and bird pictures, and found that the EPN was larger for snake
pictures than for pictures of the other categories. In
addition, trypophobic pictures and pictures of poisonous
animals resulted in larger EPN amplitudes than bird pictures. The scores on the trypophobia questionnaire were
Van Strien and Van der Peijl BMC Psychology (2018) 6:21
correlated with the EPN amplitudes for trypophobic pictures, suggesting the participants’ adequate awareness of
their physical responses to trypophobic stimuli. The outcome for the EPN indicates that snakes in particular,
and trypophobic stimuli and poisonous animals to a
lesser extent, trigger early automatic visual attention.
This lends support to the notion that the aversion that is
induced by trypophobic stimuli reflects ancestral threat
and has survival value [2], although the detection of
snake stimuli most probably has much larger survival
value [19, 20]. The triggering of early automatic visual
attention as reflected in the EPN may be based on the
spectral composition of the phylogenetic threatening
stimuli, with snake stimuli in particular exhibiting an
excess energy at high spatial frequencies.
Page 8 of 8
9.
10.
11.
12.
13.
14.
15.
16.
Abbreviations
EPN: Early posterior negativity; ERP: Event-related potential; RSVP: Rapid serial
visual presentation; SAM: Self-assessment manikin; SDT: Snake detection
theory; TQ: Trypophobia questionnaire
Availability of data and materials
The stimuli and datasets used during the current study are available from
the corresponding author on reasonable request.
Authors’ contributions
Both authors conceived the study and approved the final manuscript. JVS
designed the experimental paradigm, performed the data processing and
statistical analyses, and drafted the manuscript. MVP coordinated the study,
performed the experiment, and contributed to writing the manuscript. All
authors read and approved the final manuscript.
Ethics approval and consent to participate
The study was conducted in accordance with the Declaration of Helsinki.
Participants gave written informed consent to participate in the study. The
research was approved by the Local Ethics Committee of the Department of
Psychology, Education and Child Studies of the Erasmus University Rotterdam.
17.
18.
19.
20.
21.
22.
23.
24.
25.
26.
Competing interests
The authors declare that they have no competing interests.
27.
Publisher’s Note
28.
Springer Nature remains neutral with regard to jurisdictional claims in published
maps and institutional affiliations.
29.
Received: 15 November 2017 Accepted: 23 April 2018
30.
References
1. Le ATD, Cole GG, Wilkins AJ. Assessment of trypophobia and an analysis of
its visual precipitation. Q J Exp Psychol. 2015;218:1–19.
2. Cole GG, Wilkins AJ. Fear of holes. Psychol Sci. 2013;24:1980–5.
3. Kupfer TR, Le ATD. Disgusting clusters: trypophobia as an overgeneralised
disease avoidance response. Cogn Emot. 2017;9931:1–13.
4. Can W, Zhuoran Z, Zheng J. Is Trypophobia a phobia? Psychol Rep. 2017;
120:206–18.
5. Imaizumi S, Furuno M, Hibino H, Koyama S. Trypophobia is predicted by
disgust sensitivity, empathic traits, and visual discomfort. Spring. 2016;5:1–5.
6. Pipitone RN, Gallegos B, Walters D. Physiological responses to trypophobic
images and further scale validity of the trypophobia questionnaire. Pers
Individ Dif. 2017;108:66–8.
7. Vlok-Barnard M, Stein DJ. Trypophobia: an investigation of clinical features.
Rev Bras Psiquiatr. 2017;39:337–41.
8. MEP S. Phobias and preparedness. Behav Ther. 1971;2:307–20.
31.
32.
Grassini S, Holm SK, Railo H, Koivisto M. Who is afraid of the invisible snake?
Subjective visual awareness modulates posterior brain activity for
evolutionarily threatening stimuli. Biol Psychol. 2016;121:53–61.
He H, Kubo K, Kawai N. Spider is not special comparing with other animals in
human early visual attention : evidence from event-related potentials. JCSS
Japanese Congnitive Sci Soc. 2014;187–90. />JCSS2014/proceedings/pdf/JCSS2014_O5-4.pdf. Accessed 7 May 2016.
Van Strien JW, Christiaans G, Franken IHA, Huijding J. Curvilinear shapes and the
snake detection hypothesis: an ERP study. Psychophysiology. 2016;53:252–7.
Van Strien JW, Eijlers R, Franken IHA, Huijding J. Snake pictures draw more
early attention than spider pictures in non-phobic women: evidence from
event-related brain potentials. Biol Psychol. 2014;96:150–7.
Van Strien JW, Franken IHA, Huijding J. Testing the snake-detection
hypothesis: larger early posterior negativity in humans to pictures of snakes
than to pictures of other reptiles, spiders and slugs. Front Hum Neurosci.
2014;8:691.
Van Strien JW, Isbell LA. Snake scales, partial exposure, and the snake detection
theory: a human event-related potentials study. Sci Rep. 2017;7:46331.
Schupp HT, Flaisch T, Stockburger J, Junghöfer M. Emotion and attention:
event-related brain potential studies. Prog Brain Res. 2006;156:31–51.
Olofsson JK, Nordin S, Sequeira H, Polich J. Affective picture processing: an
integrative review of ERP findings. Biol Psychol. 2008;77:247–65.
Schupp HT, Junghöfer M, Weike AI, Hamm AO. Emotional facilitation of
sensory processing in the visual cortex. Psychol Sci. 2003;14:7–13.
Junghöfer M, Bradley MM, Elbert TR, Lang PJ. Fleeting images: a new look at
early emotion discrimination. Psychophysiology. 2001;38:175–8.
Isbell LA. The fruit, the tree, and the serpent: why we see so well. Canbridgw,
MA: Harvard University Press; 2009.
Isbell LA. Snakes as agents of evolutionary change in primate brains. J Hum
Evol. 2006;51:1–35.
Le QV, Isbell LA, Matsumoto J, Le VQ, Hori E, Tran AH, et al. Monkey pulvinar
neurons fire differentially to snake postures. PLoS One. 2014;9:1–14.
Le QV, Isbell LA, Matsumoto J, Nguyen M, Hori E, Maior RS, et al. Pulvinar
neurons reveal neurobiological evidence of past selection for rapid
detection of snakes. Proc Natl Acad Sci U S A. 2013;110:19000–5.
Soares SC, Maior RS, Isbell LA, Tomaz C, Nishijo H. Fast detector/first
responder: interactions between the superior colliculus-Pulvinar pathway
and stimuli relevant to primates. Front Neurosci. 2017;11:1–19.
Le QV, Isbell LA, Matsumoto J, Le VQ, Nishimaru H, Hori E, et al. Snakes elicit
earlier, and monkey faces, later, gamma oscillations in macaque pulvinar
neurons. Sci Rep. 2016;6:20595.
Bradley MM, Lang PJ. Measuring emotion: the self-assessment manikin and
the semantic differential. J Behav Ther Exp Psychiatry. 1994;25:49–59.
Gratton G, Coles MGH, Donchin E. A new method for off-line removal of
ocular artifact. Electroencephalogr Clin Neurophysiol. 1983;55:468–84.
Delplanque S, N’diaye K, Scherer K, Grandjean D. Spatial frequencies or
emotional effects?. A systematic measure of spatial frequencies for IAPS
pictures by a discrete wavelet analysis. J Neurosci Methods. 2007;165:144–50.
He H, Kubo K, Kawai N. Spiders do not evoke greater early posterior negativity
in the event-related potential as snakes. Neuroreport. 2014;25:1049–53.
Fernandez D, Wilkins AJ. Uncomfortable images in art and nature.
Perception. 2008;37:1098–113.
Bradley MM, Lang PJ. The international affective picture system (IAPS) in the
study of emotion and attention. In: Coan JA, JJB A, editors. Handb. Emot.
Elicitation assess. New York: Oxford University Press; 2007. p. 29–46.
Van Strien JW, Beligiannis N. High spatial frequencies drive the early
posterior negativity in response to snake pictures. 57th annual meeting of
the Society for Psychophysiological Research, Vienna, Austria. Psychophysiology.
2017;54:S47.
Van Strien JW, Franken IHA, Huijding J. Phobic spider fear is associated with
enhanced attentional capture by spider pictures: a rapid serial presentation
event-related potential study. Neuroreport. 2009;20:445–9.