Psychometric properties of a Korean version of the Perceived Stress Scale (PSS) in a military sample
Bạn đang xem bản rút gọn của tài liệu. Xem và tải ngay bản đầy đủ của tài liệu tại đây (935.57 KB, 11 trang )
Park and Colvin BMC Psychology
(2019) 7:58
/>
RESEARCH ARTICLE
Open Access
Psychometric properties of a Korean
version of the Perceived Stress Scale (PSS)
in a military sample
Sung Yong Park*
and Kimberly F. Colvin
Abstract
Background: Perceived stress reflects a person’s feeling of how much stress the individual is under at a given time.
The Perceived Stress Scale (PSS) is a popular instrument measuring the extent to which individuals perceive
situations in their life as excessive relative to the ability to cope. Based on a literature review, however, several
issues related to the scale remain: (a) the dimensionality is not established, (b) little information about the individual
items exists, and (c) much research is based on university student samples. To address these, this study evaluated
the psychometric properties of the Korean version of the Perceived Stress Scale (KPSS) using a military sample.
Methods: This study was conducted in South Korea with 373 military personnel, aged 19–30 years. Both classical
test theory (CTT) and the Rasch rating scale model were used to examine the psychometric properties of the KPSS,
including factor structure, concurrent validity, reliability, and item analyses.
Results: Internal consistency reliability for the overall and negative/positive perception subscales was.85, .85 and
.86, respectively. Based on Rasch reliability, person and item reliability were .82 and .98, respectively. Person and
item separation were 2.13 and 7.19, respectively. Concurrent validity was established, with significantly positive
association with the measures of depression and negative association with the measure of life satisfaction. Findings
from the CFA suggested that a bifactor model with two group factors was the best fit to the observed data. The
RSM showed that all but one item had acceptable infit and outfit statistics, and item difficulty ranged from −.73 to
1.22. Besides, the RSM showed positive and moderate inter-item correlations ranging from .42 to .75.
Conclusions: The results provided evidence that a 10-item Korean version of the Perceived Stress Scale was a
reliable and valid scale to measure perceived stress in military samples.
Keywords: Factor structure, Confirmatory factor analysis, Rasch rating scale model, Stress, Young adult
Backgrounds
The Perceived Stress Scale (PSS) is a self-report instrument for measuring the extent to which persons perceive
situations in their life as excessively stressful relative to
their ability to cope [1]. The PSS was designed for measuring individuals with at least a junior high school education
level. It incorporates the theoretical perspective that
varying levels of perceived stress can affect the actual
experience of stressful events into a widely applicable
instrument [1]. Perceived stress has also been linked with
* Correspondence:
Department of Educational and Counseling Psychology, University at Albany,
State University of New York, ED231, 1400 Washington Avenue, Albany, NY
12222, USA
coping and perceived ability to cope with stressful events,
such that levels of perceived stress are measured relative
to a subject’s judgment of own coping ability [1]. Due to
its widespread use and discussion in the literature, PSS
continues to be utilized and tested for the psychometric
properties and validity. The scale allows respondents in
secondary school and above to indicate levels of perceived
stress as a result of its simple questionnaire format and
short, direct questions [2]. The validity and psychometric
properties of the Korean version of PSS were examined in
the case of military personnel in South Korea.
The PSS was developed to measure global perceived
stress experienced outside the bounds of a specific life
event and focused on the cognitive appraisal process that
© The Author(s). 2019 Open Access This article is distributed under the terms of the Creative Commons Attribution 4.0
International License ( which permits unrestricted use, distribution, and
reproduction in any medium, provided you give appropriate credit to the original author(s) and the source, provide a link to
the Creative Commons license, and indicate if changes were made. The Creative Commons Public Domain Dedication waiver
( applies to the data made available in this article, unless otherwise stated.
Park and Colvin BMC Psychology
(2019) 7:58
includes the appraisal of the stressor and individual’s
perceived coping ability [1]. The original PSS included a
set of 14 items, consisting of (a) seven items with negative perception of uncontrollability, unpredictability, and
inability to cope, and (b) seven items with positive perception of capability to handle stress successfully [1].
This was reduced to 10 items after four were found to
exhibit low factor loadings [3]. The PSS has achieved
wide acceptance and has been administered to a wide
range of study participants. More than 30 language
versions of the PSS have been translated and adapted,
including Spanish, Portuguese, Mexican Spanish, Chile
Spanish, Danish, Norwegian, Swedish, Hebrew, Greek,
Italian, German, Moroccan, Bulgarian, Hungarian, Serbian, Korean, Japanese, Mandarin, Taiwanese Mandarin,
Thai, Bengali, Malayalam, Tamil, Sinhala, Polish,
Lithuanian, Turkish, Russian, Urdu, Arabic, and Finnish
[4], and validated on diverse samples, including, for example, university students [1, 5, 6], the general population
[3, 7], survivors of suicide [8], adults that participated in a
community smoking-cessation program [1], adults with
asthma [9], cardiac patients [10, 11], women with breast
cancer [12], pregnant and postpartum women [13],
teachers [14, 15], workers [14, 16], policewomen [17], and
depressed outpatients [18].
Page 2 of 11
Much attention has been given to the dimensionality
of the PSS. For example, although factor analyses in a
study [3] proposed the two-factor model as best fitting
the factor structure of the original 14-item PSS and PSS
with 10 items, they argued that the distinction between
the two factors was irrelevant for purposes of measuring
stress. Several following studies have revealed that a
two-factor structure ([19, 20]; see [21]) was more acceptable than a one-factor structure for PSS 14 and 10. One
study, supported by confirmatory factor analysis (CFA),
demonstrated that a second-order factor model was
acceptable as an alternative way to use the total score of
the two-factor PSS, where “stress” and “counter-stress”
are lower-order factors and “perceived stress” is the
higher-order factor [12]. The two-factor and secondorder factor models do not contain an underlying single
construct for stress that explains responses to each of
the observed indicators. Recently, a few studies have
proposed a bifactor model that addresses these limitations of traditional models used to evaluate the structure
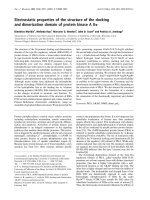
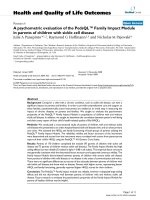
of multidimensional constructs [22–25]. As shown in
Fig. 1, the bifactor model is different from a secondorder model in that subgroup factors are not only included by a general factor underlying all item variables
but are also uncorrelated and unique [26].
Fig. 1 The bifactor model with a general stress factor and two group factors
Park and Colvin BMC Psychology
(2019) 7:58
Even though the PSS has been widely used, there is
relatively little in the extant literature about the PSS’s
psychometric properties [20], nor about the use of the
PSS for a Korean population. To our knowledge, only a
few studies translated the original PSS into Korean and
evaluated its psychometric properties [27–29]. For example, Park and Seo [29] translated the original 14-item
PSS into Korean and evaluated the psychometric properties of the Korean version of PSS (KPSS) with Korean
college student samples through both exploratory factor
analysis (EFA) and CFA. Their findings revealed that the
two-factor structure best fit the data belonging to both
positive and negative perception of stress subscales. In
addition, as evidence of concurrent validity, negative variables, including depression, anxiety, and negative affect,
were positively related to the negative perception factor
in the subscales, while the positive perception factor was
associated with positive affect.
The PSS measures general stress and is relatively independent of content that is specific to any particular
population [1]. Indeed, the PSS has been empirically validated with various populations as described above, but
most studies used college students or workers (e.g.,
professionals and teachers; [21]). Therefore, it is still necessary to validate the PSS with more diverse populations and in various cultures [21]. For example, although
several empirical studies revealed that many soldiers are
exposed to stress that impacts on mental health conditions [30, 31], no instruments assessing soldiers’ stress
levels have been validated in this population. As far as
we know, the current study is the first validation study
on the PSS for military personnel, in any language.
Specifically, South Korean soldiers were and are facing
mental and physical health problems, considering the
situation in South Korea, where South and North Korea
are confronting each other as a divided country, and
where the situation changes frequently depending on the
interests of the neighboring powers. In addition, given
the rigid military culture, soldiers experience difficulties,
such as conflicts between ranks, work-related conflicts,
and an oppressed group life [30]. Therefore, the Korean
military population should be considered distinct from
the population of Korean college students who experience
stress related to future career plans, intense academic
workload and achievement, interpersonal relationships,
finance, and personal appearance [32].
The goal of the present study was to examine the psychometric properties of a Korean version of the PSS with
10 items (KPSS10) when administered in a military setting, with a specific interest in the dimensionality of the
scale. Using classical test theory (CTT) and factor
analysis, we evaluated the factor structure of the scale.
To further examine dimensionality, we fit the rating
scale model (RSM), a polytomous extension of the Rasch
Page 3 of 11
model, to the KPSS10. The Rasch analysis allowed an
examination of the performance of individual items on
the KPSS10, for which there is little documentation.
Then, internal consistency for the items was investigated
by both CTT and Rasch reliability statistics. Finally, the
concurrent validity of the KPSS10 was examined by
comparing scores with those from measures of emotional distress (i.e., depression) and subjective well-being
(i.e., life satisfaction).
Methods
Participants
At a South Korean military institution, 375 air force soldiers in South Korea, ranging in age from 19 to 30, completed a survey. All participants were male, and the
mean length of military service was 17.24 months (SD =
4.17). Regarding the highest level of educational, of the
respondents, 5.9% were high school graduates, 84.5%
college students, 7.2% college graduates, and 1.9% had
attended or completed graduate school. Consent forms
and a research description were sent to the air force.
After they consented to participate, they completed a
paper version of the survey; the survey took approximately 10 min to complete. All but two of the 375
participants who provided complete responses on the
KPSS were included in our analyses. Two participants
with more than fifteen missing values in responses to all
instruments in this survey were excluded from these
analyses, yielding a sample size of 373.
In this data set, there were 4 missing values across 10
items and 373 survey respondents, yielding a very low
percentage (0.1%) for missing values. Although the
Little’s missing completely at random test was significant, it was considered a missing at random pattern
based on a visual inspection that showed there are no
clusters of missing values. The 4 missing data were
imputed using the Expectation-Maximization (EM)
algorithm in SPSS Version 24 [33].
The first author conducted the mental health project
for Korean military soldiers with a research team; he
then obtained the data from a military counselor of the
Republic of Korean Air Force (ROKAF) 10th Wing. The
current analysis and publication of the data were
approved by the ROKAF 10th Wing’s security review.
Measures
Perceived stress scale
The Perceived Stress Scale (PSS; [1]) is a self-report
measure consisting of 14 items purported to measure
“how unpredictable, uncontrollable, and overloaded
respondents find their lives” during the past month [3].
The original version consists of seven negatively stated
items and seven positively stated items [1]. Two shortened
forms of the PSS 14 were also subsequently developed and
Park and Colvin BMC Psychology
(2019) 7:58
validated [3] —the PSS 10 (six negative items and four
positive items) and the PSS 4 (two negative items and two
positive items). Lee’s review [21] found that the psychometric properties of the PSS 10 were more effective in
measuring the perceived stress than those of the PSS 14
and 4 items.
The Korean version translated and evaluated by Park
and Seo [29] is made up of five negatively stated items
(i.e., 1, 2, 3, 11, and 14 in the original PSS 14) and five
positively stated items (i.e., 4, 5, 6, 7, and 10 in the
original version) depending on factor loadings over 0.5
among the full 14 items. Participants indicate their response to the KPSS using a 5-point Likert-type scale
ranging from 0 (never) to 4 (very often). To produce the
total score, the five positively stated items in questionnaires were reversed, thus, higher scores indicate higher
perceived stress. For the current items used in the study
see the Additional file 1. Park and Seo [29] found that a
two-factor solution, with positive and negative perception as the subfactors, was supported (α = .74 for positive
perception and .77 for negative perception). Concurrent
validity was established by moderate correlations with
depression, anxiety, negative affect, and positive affect.
Center for epidemiologic studies depression scale
There is a growing body of evidence identifying the
stress-depression connection (see [21]). To establish
concurrent validity, a comparison was made with the
CES-D, a self-report scale designed to measure the
current level of depressive symptoms for general population [34]. The scale consists of 20 items using a 4-point
scale ranging from 0 (Rarely or none of the time, less
than 1 day) to 3 (Most or all of the time, 5–7 days). For
example, item 1 is “I was bothered by things that usually
don’t bother me.” The CES-D has four subfactors:
depressive affect, positive affect, somatic symptoms, and
interpersonal difficulties [34]. We used the Korean
version of the CES-D translated and validated by Chon,
Choi, and Yang [35], which demonstrated the same factor structure with the original CES-D and high internal
consistency (α = .91). The internal consistency reliability
estimate in the present study was .90.
Satisfaction with life scale
As previous literature suggested that perceived stress
was predictive of low levels of life satisfaction [36], the
Satisfaction with Life Scale (SWLS; [37]) was also
administered to assess concurrent validity. The SWLS
was designed to assess cognitive judgments of life satisfaction using a short instrument with only five items.
The responses to each item (e.g., “So far I have gotten
the important things I want in life”) range from 1
(strongly disagree) to 7 (strongly agree), where higher
scores indicate higher levels of life satisfaction. We used
Page 4 of 11
the Korean version of the SWLS, which has been translated and evaluated for psychometric properties in a
Korean population [38]. In Kim’s study [38], the
Cronbach’s alpha was .84, and the current sample yielded
the alpha coefficients of .86.
Data analysis
Both CTT and Rasch RSM were used to evaluate the
psychometric properties of the KPSS10, including factor
structure, concurrent validity, reliability, and item
analyses. Reliability of the KPSS10 was reported in two
ways using Cronbach’s alpha and item-total correlation.
In general, a Cronbach’s alpha value of 0.70 is recommended as a minimum acceptable criterion for internal
consistency [39]. Furthermore, Rasch-based person and
item reliability and separation were reported. The person
reliability index refers to the expected replicability of
person placement if this sample was given other items
measuring the same construct, while the item reliability
index indicates the replicability of item placements
resulting from other samples who behaved in the same
way [40]. Both reliability indices range from 0 to 1, with
values greater than .90 for items and .80 for persons
being regarded as acceptable [40]. The separation index
indicates an estimate of the spread or separation of
items or persons along the measured variable, with adequate separation in persons or items values of at least
2.0 regarded as acceptable [40]. Concurrent validity was
investigated by evaluating the correlational relationship
with measures of negative emotion (e.g., depression),
using the CES-D and subjective well-being (e.g., satisfaction with life), using the SWLS. We expected the
KPSS10 to correlate positively with the CES-D and to
correlate negatively with the SWLS.
We used CFA to examine the dimensionality of the
KPSS10. Based on the factor structures reported in the
PSS literature, four different factor configurations of the
KPSS10 were extracted: (a) a single-factor unidimensional model that all 10 items are assumed to measure a
single stress factor [8], (b) a two-factor model with two
covariate factors [19–21, 27, 29], (c) a bifactor model
with a general stress factor and a nuisance factor consisting of the five reversed items [23], and (d) a bifactor
model with a general stress factor accounting for the
commonality shared by the items and two subfactors
reflecting the unique variance not accounted for by the
general stress factor, as seen in Fig. 1 [22, 24, 25]. The
bifactor model allowed us to test whether the KPSS10
was a general measure of perceived stress with another
specific underlying dimension.
To examine the adequacy of model-fit, we reported
the comparative fit index (CFI) representing incremental
fit, standardized root-mean-square residual (SRMR) for
absolute fit, and root-mean-square error of approximation
Park and Colvin BMC Psychology
(2019) 7:58
(RMSEA) identifying parsimonious fit. In our data,
Mardia’s multivariate kurtosis coefficient of 17.40 indicated the absence of multivariate normality [41]. Given
this result and the ordinal nature (a five-point Likert-type
scale) of the KPSS, robust maximum likelihood estimation
was used in the CFA analyses in EQS 6.1 [42], instead of
using maximum likelihood estimator.
Next, as an indicator of unidimensionality used in a
bifactor model, we computed the explained common
variance (ECV) that is a ratio of common variance
attributable to the general factor (ECV; [43]). High ECV
values indicate data that have a strong general factor
compared to other specific group factors; when values
are greater than .70, the common variance can be considered as unidimensional [43].
To further explore dimensionality and assess the
relative location of items and respondents, we used
WINSTEPS version 4.01 [44] to fit the rating scale
model (RSM; [40, 45]) to our data, while accounting for
the dimensionality as found in the factor analyses. Contrary to CTT, Rasch analyses enable researchers to
analyze the properties of items, such as item difficulty
and item discrimination. The RSM is an extension of the
Rasch model for polytomous data [45, 46]. The RSM estimates the location of the respondents and the KPSS10
items on the same scale, in this case, the scale of perceived stress. The RSM manipulates only one set of
threshold parameters of across all items on the scale, indicating a common rating scale structure for all items
[40]. For each item, the overall location of the item is estimated, along with the location of the thresholds, that is
the location on the scale where the likelihood of a response in a particular category changes. In other words,
the scale is divided into sections based on the most likely
response. Therefore, the RSM is suitable when one
expects that psychological distances between categories
are the same across all items [47].
However, to conduct the Rasch analysis, we had two
choices: the RSM and the partial credit model (PCM).
While the PCM allows for the item response categories
to differ across items, in the case of Likert-type items a
strong case needs to be made to use the PCM over the
RSM [48]. Theoretically, we would argue that because
respondents were presented with the same response
options across all items, the set of responses should be
treated the same across all items. However, because it is
possible that there was an interaction between the respondents and the items leading to a discrepant use of
response categories across items, we initially fit both the
RSM and PCM. The ordering and spacing of the thresholds remained roughly the same across all items in both
the PCM and the RSM, indicating that the data would
support the selection of the RSM. We next compared
the person and item reliability index obtained from the
Page 5 of 11
two models. The person reliability is .85 for the PCM
and .82 for the RSM, and the item reliability is .98 for
both PCM and RSM. Given the similarity of threshold
spacing, fit indices, and the theoretical argument that
the set of response categories is the same across items,
we decided to fit the more parsimonious RSM, rather
than the PCM.
Finally, after fitting the RSM we used WINSTEPS to
conduct a principal components analysis of the standardized residuals [49]. If the underlying factor fit by the
RSM accounts for most of the variance in the original
data, then it is expected that the resulting components
of residuals will represent noise. The results of the
analysis can be used to separate items into groups to determine if some of the unaccounted variance (variance
not accounted for in the RSM) can be explained by an
additional factor or factors.
Results
Reliability
As shown in Table 1, Cronbach’s alpha coefficients indicated good internal consistency for the overall KPSS10
(α = .85), for the negative perception subscale (α = .85),
and for the positive perception subscale (α = .86) [40].
Cronbach’s alpha if item deleted for all ten items ranged
from .83 to .87. Item 5 was the only item that would
yield a slightly higher alpha if removed. Item-total correlations for individual items and each factor were also investigated, and ranged from .45 to .75, showing over the
generally adopted cutoff criteria (>.40; [50]). Therefore,
all items appeared worthy of retention. These two types
of statistics on internal consistency reliability indicate
that the KPSS10 contains items that are particularly
intercorrelated. Regarding the results from Rasch-based
reliability, both person and item reliability indices were
acceptable: .82 and .98, respectively. In addition, results
pertaining to person and item separation were 2.13 and
7.16, respectively. In general, these reliability results indicate good separation in the KPSS10 for both persons
and items [40].
Table 1 Descriptive Statistics and Correlations of Measures
Measure
1
1. KPSS Total
1
2. KPSS Negative perception .84
2
3
4
1
1
5 M
SD
α
2.27 .57
.85
2.16 .71
.85
3. KPSS Positive perception
.81
.36
4. CES-D
.62
.56
5. Life Satisfaction
−.49 −.42 −.38 −.47 1 4.27 1.19 .86
.45 1
2.38 .66
.86
.52
.90
.41
Note. N = 373. All correlation coefficients are significant at p < .01; KPSS =
Korean version of the Perceived Stress Scale with 10 items; KPSS negative
perception indicates the negatively worded items, and KPSS positive
perception means the positively worded items; The KPSS positive items
were reverse-coded
Park and Colvin BMC Psychology
(2019) 7:58
Page 6 of 11
Concurrent validity
As expected, we found statistically significant positive
associations between the KPSS total scores and two subscale scores and depression: CES-D (r = .61, .56, and 44,
respectively, p < .01), as well as a negative association
with life satisfaction: SWLS (r = −.48, −.42, and − .37,
respectively, p < .01). All correlation coefficients ranged
between .37 and .61, which are considered to be medium
or strong correlations [51]. In sum, these correlations
provide evidence of concurrent validity for the KPSS10
(see Table 1).
Confirmatory factor analysis (CFA)
Results from the CFA supported a bifactor model for the
KPSS10. Fit indices mentioned above for the factor
structure including one-factor, two-factor, and bifactor
models are provided in Table 2.
The initial one-factor CFA model had poor model fit
using Hu and Bentler’s joint criteria [52]. Although the
two-factor model yielded an acceptable fit to the data,
the bifactor model (A) with the general stress factor and
one nuisance factor demonstrated better fit as compared
to the two-factor model, ΔS-B χ2 (4) = 35.416, p < .001.
All factor loadings were significant for the general and
the nuisance factor except for item 5. Considering this,
we tried to conduct the second bifactor model (B) in
which all 10 items load onto the general stress factor as
well as on the two group factors. The bifactor model (B)
yielded better fit, S-B χ2 (25) = 52.051, p < .001, CFI =
.979, SRMR = .039, RMSEA = .054 [.033, .074], and
shown a significant improvement in fit indices, as compared to the first bifactor model (A), ΔS-B χ2 (5) =
30.418, p < .001. In contrast to the bifactor model (A), all
factor loadings were significant for the general and the
two group factors (all ps < .001), as shown in Fig. 1. Our
findings supported the bifactor model with the general
stress factor and the two group factors labeled as
“negative perception and positive perception” as the best
fitting model.
The ECV in our supported model was .45, indicating
that the general stress factor accounted for almost half
the common variance. Because the bifactor model (B)
yielded the best fit and the two group factors related to
Table 2 Confirmatory Factor Analyses of the KPSS
Model
S-B χ2
df
CFI
SRMR
RMSEA [90% CI]
One-factor model
480.914
35
.649
.157
.185 [.170, .200]
Two-factor model
117.885
34
.934
.063
.081 [.065, .097]
Bifactor model (A)
82.469
30
.959
.033
.069 [.051, .086]
Bifactor model (B)
52.051
25
.979
.039
.054 [.033, .074]
Note. CFI Comparative fit index, SRMR standardized root-mean-square residual,
RMSEA room-mean-square error of approximation, CI confidence interval; the
bifactor model (A) includes a general stress factor and a nuisance factor, while
the bifactor model (B) consists of a general stress factor and two group factors
the positive or negative wording of the item, we conducted Rasch analyses focusing on the KPSS10 as a
whole in a confirmatory manner, rather than on the two
subscales. The two group factors could be considered as
superficial and not meaningful [3] because they represented the direction of the wording of the items rather
than the content of the item; in addition, most research
and clinical contexts generally use a single summed PSS
score. Reckase [53] argued that item estimates are defensible when the first component of principal components analysis accounts for at least 20% of the variance;
in our data the first component accounted for 44% of
the variance. To further confirm that a Rasch analysis on
all ten items at once was appropriate, we compared the
relative item positions and person estimates from an
RSM analysis of all ten items with those from analyses
of the positive and negative items separately. The person
estimates from an RSM analysis with only the positive
items correlated .92 with the person estimates based on
all ten items, while the estimates based on the negative
items correlated .73 with the estimates based on all ten
items. The relative positioning of the items when calibrated separately as positive and negative items were the
same as when all ten items were calibrated simultaneously. These results, coupled with the fact that the first
eigenvalue accounts for 44% of the variance, well over
the minimum recommended of 20%, indicated that a
single RSM analysis of all ten items was appropriate to
generate item and person estimates.
Rasch rating scale model
The RSM was fit to the data to evaluate item performance of the KPSS10 with the military sample of respondents based on item difficulty, separation index, item
misfit detection, item discrimination, and Pearson point
measure correlation (PTMEA). The results are provided
in Table 3. Ten items are arranged in item difficulty
values, from most difficult item to respond to at the top
(item 3), to the least difficult item to respond to at the
bottom (item 5). For instance, the item 3 “Cannot
overcome pilling up difficulties” was more difficult to
endorse, referring to higher stress severity, whereas item
5 “Dealing successfully with day-to-day problems and
annoyances” was the most likely to obtain a response of
“never,” meaning lower stress severity. In addition, the
item separation index of 7.19 is also a good separation
in the KPSS items and indicates that these items define
adequately a distinct hierarchy of item difficulty [54].
Next, item misfit was evaluated using the following
Rasch fit indicators. Mean-square fit statistics (MNSQ)
were examined; specifically, infit (weighted mean square)
and outfit (unweighted mean square) determine how
well each item contributes to defining one common construct. In the case of a Likert scale, the expected MNSQ
Park and Colvin BMC Psychology
(2019) 7:58
Page 7 of 11
Table 3 Rasch Rating Scale Model (RSM) Analyses
KPSS Item
Difficulty
Estimated
Discrimination
Infit
MNSQ
Outfit
MNSQ
PTMEA
1.22
1.23
0.82
0.80
0.66
Item 3 (14)
Cannot overcome mounting difficulties
Item 1 (2)
Unable to control the important things
1.03
.93
1.10
1.14
0.60
Item 6 (5)
Effectively cope with important changes in your life
0.02
1.21
0.82
0.81
0.66
Item 7 (6)
Confident about your ability to handle your problems
0.02
1.18
0.84
0.83
0.68
Item 9 (10)
Feel that you are on top of things
−0.17
1.33
0.70
0.69
0.70
Item 4 (1)
Upset because of something that happened unexpectedly
−0.23
.79
1.21
1.22
0.64
Item 2 (3)
Feel nervous or stressed
−0.24
.84
1.16
1.14
0.68
Item 8 (7)
Feel that things are going your way
−0.45
1.38
0.63
0.64
0.75
Item 10 (11)
Feel angry because of things that happened that are outside of your control
−0.48
.82
1.15
1.17
0.59
Item 5 (4)
Deal successfully with day-to-day problems and annoyances
−0.73
.40
1.58
1.66
0.42
Note. KPSS10 is Korean version of the Perceived Stress Scale 10 items; numbers in parentheses refer to the original number of the PSS-14 [1]; difficulty means
perceived stress severity level; infit/outfit statistics in bold are larger than 1.4 and indicate misfit; PTMEA = the point-measure correlation
value is 1.0, infit and outfit values from 0.6 to 1.4 are
within acceptable bounds for Likert scale measurements,
indicating construct homogeneity with other items in a
scale [47, 55]. MNSQ values greater than 1.4 may indicate a lack of construct homogeneity with other items in
a scale, while values less than 0.6 may indicate item
redundancy [47, 55]. As shown in the Table 3, all items
of the KPSS10 had acceptable infit and outfit statistics
between 0.60 and 1.40, except for only one item (item 5)
revealing both infit and outfit statistics larger than 1.4.
Moreover, most items on the KPSS10 had positive,
moderate, inter-item correlations ranging from .42 to
.75, indicating that all items on the KPSS10 function as
intended (see the PTMEA in Table 3; [54]). Although
Rasch models are assumed that all item discriminations are regarded as equal, empirical item discriminations are never equal so that WINSTEPS produces
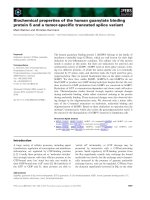
Fig. 2 The relative category probability curves for items of the KPSS10
item discrimination estimates post-hoc [54]. The estimates
of the item discrimination distributed all around from .40
(item 5) to 1.38 (item 8), including five under-discriminating items and five over-discriminating items shown in
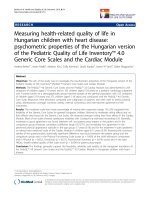
Table 3. Finally, the Probability Curves revealed that the
5-point Likert-type scale in the KPSS10 were ordered as
expected, indicating that the differentiation of each category along the attribute measurement was verified (see
Fig. 2).
Finally, the principal components analysis of the
standardized residuals revealed that of the unexplained
variance 35% was attributable to the first component, indicating that the component is accounting for more than
just noise. In fact, the first component separated the 10
items into two distinct groups: the five items with positive wording and the five items with negative wording.
The remaining components accounted for roughly equal
Park and Colvin BMC Psychology
(2019) 7:58
variance, indicating no additional conceptual dimensions
to the data.
Appropriateness of item difficulty for military samples
Because the Rasch model estimates person and item locations on the same scale, we can investigate whether
the item difficulty level of the KPSS10 is appropriate for
the current sample. If the KPSS-10 was appropriately
targeted for the level of the sample being tested, there
should be considerable overlap between the range of the
person trait measures and the total test information
curve and some of the item category probability curves.
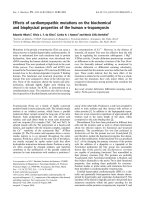
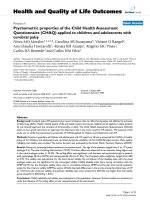
As shown in Fig. 3, the test information curve and the
items, depicted by each item’s individual category probability curves, were aligned with most of the current
sample’s locations along the stress scale (M = − 1.45,
SD = 1.46, minimum = − 6.60, maximum = 2.99). The one
exception is for the few people with the lowest estimate
of stress, − 6.60, where the items were not targeted to
the low end of the stress scale. This means the KPSS10
items could measure a more severe level of perceived
stress than was needed for this nonclinical sample of
South Korean soldiers, but still more than adequately
targeted almost the entire sample.
Discussion
In this study, we investigated the psychometric properties of the Korean version of the Perceived Stress Scales
in a sample of military personnel in South Korea, using
the KPSS 10 items translated and validated by Park and
Seo [29]. Overall, both CTT analyses and Rasch modeling provided evidence that the KPSS10 is a reliable and
Page 8 of 11
valid instrument measuring perceived stress within
military samples in South Korea.
The CFA analyses to compare four competing models’
goodness-of-fit demonstrated that a bifactor model with
a general stress factor and two group factors was the
best fit to our data. Regarding two group factors, our
model was more consistent with the bifactor model
supported by previous studies [22, 25], rather than
Perera et al.’s [23] model with only one nuisance factor
consisting of four negatively worded items. In addition
to the general stress factor reflecting the overlap across
all items, two group factors in our findings indicate that
the five negatively worded items of the KPSS10 were
loaded onto the negative perception factor and the positively worded remaining five items were loaded onto the
positive perception factor. It is worthy of note that when
all the items’ loadings on the general factor will be
stronger than those on the group factors, a bifactor
structure could be viewed as mostly unidimensional.
This underlying hypothesis was not supported by factor
loadings in our bifactor model; items loaded more
strongly on the group factors than on the general stress
factor. The principal components analysis on the residuals from the RSM analysis demonstrated the same
underlying factor structure as the CFA: one general
stress factor with the unexplained variance dividing the
items into the positive and negatively worded items.
Regarding the reliability, the overall and two subscales’
Cronbach’s alpha coefficients (.85, .85, and .86, respectively) indicate that the KPSS10 had a good internal
consistency reliability for the Korean military sample.
Our findings were higher than those observed in the
Fig. 3 Items’ category probability curves and the total test information curve
Park and Colvin BMC Psychology
(2019) 7:58
original study [3]. Concurrent validity of the full and the
subscales of the KPSS was established, with significantly
positive associations with the measures of depression
and negative association with the measure of life
satisfaction. In other words, high KPSS10 scores were
correlated with reports of increased depression and dissatisfaction. These findings were consistent with the
prior findings showing significant correlations with
measures of distress and subjective well-being constructs
[3, 22, 56]. Contrary to the earlier findings, however, the
two subscales correlated positively with each other. This
finding was consistent with the validation study based
on Korean college students [29].
To our knowledge, this is the first study to use the
Rasch RSM to investigate the PSS. Our findings were indicated by the adequate MNSQ fit of almost items,
evenly separated item difficulty, acceptable discrimination, and fairly strong positive PTMEA correlations.
According to the results showing good separation in the
KPSS10 for both persons and items, the KPSS10 may be
sensitive enough to discriminate between high and low
stressed respondents [54]. The majority of the respondents’ scale locations overlapped with the item category
probability curves in the middle and at the lower end of
the scale. Given that the PSS was designed to measure
the degree to which individuals perceive their lives as
stressful in both clinical and non-clinical population [1],
this finding can be regarded as reasonable, concluding
that the KPSS10 items are designed to measure more
severe levels of perceived stress than was observed in
our non-clinical sample of soldiers.
There are some limitations to be considered in interpreting the findings. First, the KPSS10 [29] that we used
in this study, is a translated and validated version that is
adapted for the Korean population. In this process, the
KPSS10 included two items not present in the original
English PSS10 [3] so that it will be somewhat difficult to
compare directly with other previous findings. Second,
considering all the items and all subfactors, positive correlations were found, justifying computing a total score
of the KPSS10. Another limitation of our study is that is
we could not compare KPSS10 scores to another measure of stress to assess convergent validity, instead, we
established concurrent validity with expected significant
correlations among the mental health measures in this
study. Finally, it may be difficult to generalize from our
findings, because of our particular sample. The military
sample in the study was not representative of the military population in other countries because of the nature
of military service in South Korea, in which participation
is mandatory. The KPSS10 was also only administered at
one-time point, and the sample only included males,
therefore, future studies will have to assess test-retest
reliability and include women in the study sample.
Page 9 of 11
Conclusions
In a South Korean military sample, the Korean version
of the PSS proved to be a reliable instrument with concurrent validity. We found evidence that while a bifactor
model best fit the data, the data are unidimensional
enough to conduct a Rasch analysis. To our knowledge,
this is the first study to use the Rasch rating scale model
to investigate the PSS. The results indicated a good separation in the KPSS for both persons and items, demonstrated that the KPSS is sensitive enough to discriminate
between high and low stressed respondents. Given that
the PSS was designed to measure the degree to which
individuals perceive their lives as stressful in both clinical and non-clinical populations, it is not surprising that
we found the Korean version of the PSS to be an adequate measure of perceived stress in our non-clinical
sample of soldiers.
Additional file
Additional file 1: Korean Version of the Perceived Stress Scale (KPSS).
(PDF 168 kb)
Abbreviations
CES- D: Center for Epidemiological Studies; CFI: Comparative fit index;
CTT: Classical test theory; ECV: Explained common variance; KPSS: Korean
version of Perceived Stress Scale; MNSQ: Mean-square fit statistics;
PSS: Perceived Stress Scale; PTMEA: Pearson point measure correlation;
RMSEA: Root-mean-square error of approximation; RSM: Rating scale model;
SRMR: Standardized root-mean-square residual; SWLS: Satisfaction with Life
Scale
Acknowledgements
The authors acknowledge and thank the military personnel for their
participation. We are also thankful to Seon-Young Bak, who is a military
counselor, and Dr. Kyungmi Kim for collecting the data.
Authors’ contributions
SP was responsible for the data analyses and interpretation and wrote the
manuscript. KC revised the manuscript and supervised all processes. Both
authors read and approved the final manuscript.
Funding
Not applicable.
Availability of data and materials
The dataset analyzed during the current study is not publicly available
because the data are controlled by the Republic of Korea Air Force 10th
Fighter Wing but are available from the corresponding author on reasonable
request.
Ethics approval and consent to participate
The survey data collection and publication were approved by the Security
Review Board of the Republic of Korea Air Force (ROKAF) 10th Fighter Wing,
South Korea (Protocol number: Intelligence and Security Command – 8960 &
5890), referenced by ROKAF regulation 3–21, Article 201–2 “Security review
approval procedure”, and “Department of personnel management-9651.” All
soldiers who enrolled in the study gave oral and written consent to participate in the study. The study and current analysis were approved by the IRB
at the University at Albany, SUNY. (18-X-233-01).
Consent for publication
Not applicable.
Park and Colvin BMC Psychology
(2019) 7:58
Competing interests
The authors declare that they have no competing interests.
Received: 14 December 2018 Accepted: 21 August 2019
References
1. Cohen S, Kamarck T, Mermelstein R. A global measure of perceived stress. J
Health Soc Behav. 1983;24:385–96.
2. Karam F, Bérard A, Sheehy O, Huneau MC, Briggs G, Chambers C, Einarson
A, Johnson D, Kao K, Koren G, Martin B. Reliability and validity of the 4-item
perceived stress scale among pregnant women: results from the OTIS
antidepressants study. Res Nurs Health. 2012;35(4):363–75.
3. Cohen S, Williamson GM. Perceived stress in a probability sample of the
United States. In: Spacapan S, Oskamp S, editors. The social psychology of
health: Claremont symposium on applied social psychology. Newbury Park,
CA: Sage; 1988. p. 31–67.
4. Cohen’s laboratory for the Study of Stress, Immunity, and Disease. Dr.
Cohen’s Scales. 2018. />Accessed 15 Jun 2018.
5. Örücü MÇ, Demir A. Psychometric evaluation of perceived stress scale for
Turkish university students. Stress Health. 2009;25(1):103–9.
6. Roberti JW, Harrington LN, Storch EA. Further psychometric support for
the 10-item version of the perceived stress scale. J Coll Couns. 2006;
9(2):135–47.
7. Andreou E, Alexopoulos EC, Lionis C, Varvogli L, Gnardellis C, Chrousos GP,
Darviri C. Perceived stress scale: reliability and validity study in Greece. Int J
Environ Res Public Health. 2011;8(8):3287–98.
8. Mitchell AM, Crane PA, Kim Y. Perceived stress in survivors of suicide:
psychometric properties of the perceived stress scale. Res Nurs Health. 2008;
31(6):576–85.
9. Sharp LK, Kimmel LG, Kee R, Saltoun C, Chang CH. Assessing the perceived
stress scale for African American adults with asthma and low literacy. J
Asthma. 2007;44(4):311–6.
10. Leung DY, Lam TH, Chan SS. Three versions of perceived stress scale:
validation in a sample of Chinese cardiac patients who smoke. BMC Public
Health. 2010;10(1):513–20.
11. Pbert L, Doerfler LA, DeCosimo D. An evaluation of the perceived stress
scale in two clinical populations. J Psychopathol Behav Assess. 1992;14(4):
363–75.
12. Golden-Kreutz DM, Browne MW, Frierson GM, Andersen BL. Assessing stress
in cancer patients: a second-order factor analysis model for the perceived
stress scale. Assessment. 2004;11(3):216–23.
13. Chaaya M, Osman H, Naassan G, Mahfoud Z. Validation of the Arabic
version of the Cohen perceived stress scale (PSS-10) among pregnant and
postpartum women. BMC Psychiatry. 2010;10(1):111–8.
14. Almadi T, Cathers I, Mansour AM, Chow CM. An Arabic version of the
perceived stress scale: translation and validation study. Int J Nurs Stud. 2012;
49(1):84–9.
15. Reis RS, Hino AA, Rodriguez Añez CR. Perceived stress scale: reliability and
validity study in Brazil. J Health Psychol. 2010;15(1):107–14.
16. Lesage FX, Berjot S, Deschamps F. Psychometric properties of the French
versions of the perceived stress scale. Int J Occup Med Environ Health. 2012;
25(2):178–84.
17. Wang Z, Chen J, Boyd JE, Zhang H, Jia X, Qiu J, Xiao Z. Psychometric
properties of the Chinese version of the perceived stress scale in
policewomen. PLoS One. 2011;6(12):e28610.
18. Wongpakaran N, Wongpakaran T. The Thai version of the PSS-10: an
investigation of its psychometric properties. Biopsychosoc Med. 2010;
4(1):6.
19. Hewitt PL, Flett GL, Mosher SW. The perceived stress scale: factor structure
and relation to depression symptoms in a psychiatric sample. J
Psychopathol Behav Assess. 1992;14(3):247–57.
20. Taylor JM. Psychometric analysis of the ten-item perceived stress scale.
Psychol Assess. 2015;27(1):90–101.
21. Lee EH. Review of the psychometric evidence of the perceived stress scale.
Asian Nurs Res. 2012;6(4):121–7.
22. Jovanović V, Gavrilov-Jerković V. More than a (negative) feeling: validity of
the perceived stress scale in Serbian clinical and non-clinical samples.
Psihologija. 2015;48(1):5–18.
Page 10 of 11
23. Perera MJ, Brintz CE, Birnbaum-Weitzman O, Penedo FJ, Gallo LC, Gonzalez
P, Gouskova N, Isasi CR, Navas-Nacher EL, Perreira KM, Roesch SC. Factor
structure of the perceived stress Scale-10 (PSS) across English and Spanish
language responders in the HCHS/SOL sociocultural ancillary study. Psychol
Assess. 2017;29(3):320–8.
24. Reis D, Lehr D, Heber E, Ebert DD. The German version of the Perceived
Stress Scale (PSS-10): evaluation of dimensionality, validity, and
measurement invariance with exploratory and confirmatory bifactor
modeling. Assessment. 2017; doi:1073191117715731.
25. Wu SM, Amtmann D. Psychometric evaluation of the perceived stress scale
in multiple sclerosis. ISRN Rehabil. 2013;2013:1–9.
26. Gustafsson JE, Balke G. General and specific abilities as predictors of school
achievement. Multivariate Behav Res. 1993;28(4):407–34.
27. Lee EH, Chung BY, Suh CH, Jung JY. Korean version of the perceived stress
scale (PSS-14, 10 and 4): psychometric evaluation in patients with chronic
disease. Scand J Caring Sci. 2015;29(1):183–92.
28. Hong GR, Kang HK, Oh E, Park Y, Kim H. Reliability and validity of the Korean
version of the perceived stress Scale-10 (K-PSS-10) in older adults. Res
Gerontol Nurs. 2015:45–51.
29. Park JO, Seo YS. Validation of the perceived stress scale (PSS) on samples of
Korean university students. Korean J Psychol. 2010;29(3):611–29.
30. Koo SS. A study on mental health of new generation soldiers. Mental Health
Soc Work. 2006;24:64–93.
31. Martin PD, Williamson DA, Alfonso AJ, Ryan DH. Psychological adjustment
during army basic training. Mil Med. 2006;171(2):157–60.
32. Lee DH, Kang S, Yum S. A qualitative assessment of personal and academic
stressors among Korean college students: an exploratory study. Coll Stud J.
2005;39(3):442–9.
33. IBM Corp. Released. IBM SPSS statistics for windows, version 24.0. Armonk:
IBM Corp; 2016.
34. Radloff LS. The CES-D scale: a self-report depression scale for research in the
general population. Appl Psychol Meas. 1977;1(3):385–401.
35. Chon KK, Choi SC, Yang BC. Integrated adaptation of CES-D in Korea. Korean
J Health Psychol. 2001;6(1):59–76.
36. Abolghasemi A, Varaniyab ST. Resilience and perceived stress: predictors of
life satisfaction in the students of success and failure. Procedia Soc Behav
Sci. 2010;5:748–52.
37. Diener E, Emmons RA, Larsen RJ, Griffin S. The satisfaction with life scale. J
Pers Assess. 1985;49(1):71–5.
38. Kim JH. The relationship between life satisfaction/life satisfaction expectancy
and stress/well-being: an application of motivational states theory. Korean J
Health Psychol. 2007;12:325–45.
39. Kline P. A psychometrics primer. London: Free Association Books; 2000.
40. Wright BD, Masters GN. Rating scale analysis: Rasch measurement. Chicago:
Mesa Press; 1982.
41. Mardia KV. Measures of multivariate skewness and kurtosis with applications.
Biometrika. 1970;57(3):519–30.
42. Bentler PM, Wu EJ. EQS 6.1 for Windows: Users' guide. Encino: Mulivariate
Software; 2003.
43. Rodriguez A, Reise SP, Haviland MG. Applying bifactor statistical indices
in the evaluation of psychological measures. J Pers Assess. 2016;98(3):
223–37.
44. Linacre JM. Winsteps® Rasch measurement computer program, Version 4.1.
Beaverton: Winsteps.com; 2017.
45. Andrich D. Rasch models for measurement. Newbury Park, CA: Sage
Publications; 1988.
46. Embretson SE, Reise SP. Item response theory for psychologists. Mahwah,
NJ: L. Erlbaum; 2000.
47. Bond TG, Fox CM. Applying the Rasch model: fundamental measurement in
the human sciences. 3rd ed. Mahwah, NJ: L. Erlbaum; 2015.
48. Wright BD. Model selection: rating scale model (RSM) or partial credit model
(PCM)? Rasch Meas Trans. 1998;12(3):641–2.
49. Linacre JM. Detecting multidimensionality: which residual data-type works
best? J Outcome Meas. 1998;2:266–83.
50. Ware JE Jr, Gandek B. Methods for testing data quality, scaling assumptions, and
reliability: the IQOLA project approach. J Clin Epidemiol. 1998;51(11):945–52.
51. Cohen J. Statistical power analysis for the behavioral sciences. 2nd ed. New
York, NY: Routledge; 1988.
52. Hu LT, Bentler PM. Cutoff criteria for fit indexes in covariance structure
analysis: conventional criteria versus new alternatives. Struct Equ Modeling.
1999;6(1):1–55.
Park and Colvin BMC Psychology
(2019) 7:58
53. Reckase MD. Unifactor latent trait models applied to multifactor tests:
results and implications. J Edu Stat. 1979;4(3):207–30.
54. Linacre JM. A user’s guide to WINSTEPS. Chicago, IL: Winsteps.com; 2005a.
55. Wright BD, Linacre JM, Gustafson JE, Martin-Lof P. Reasonable mean-square
fit values. Rasch Meas Trans. 1994;8(3):370.
56. Klein EM, Brähler E, Dreier M, Reinecke L, Müller KW, Schmutzer G, Wölfling
K, Beutel ME. The German version of the perceived stress scale–
psychometric characteristics in a representative German community sample.
BMC Psychiatry. 2016;16(1):159.
Publisher’s Note
Springer Nature remains neutral with regard to jurisdictional claims in
published maps and institutional affiliations.
Page 11 of 11