Psychological distress increases the risk of falling into poverty amongst older Australians: The overlooked costs-of-illness
Bạn đang xem bản rút gọn của tài liệu. Xem và tải ngay bản đầy đủ của tài liệu tại đây (569.1 KB, 9 trang )
Callander and Schofield BMC Psychology (2018) 6:16
/>
RESEARCH ARTICLE
Open Access
Psychological distress increases the risk
of falling into poverty amongst older
Australians: the overlooked costs-of-illness
Emily J. Callander1* and Deborah J. Schofield2
Abstract
Background: This paper aimed to identify whether high psychological distress is associated with an increased risk
of income and multidimensional poverty amongst older adults in Australia.
Methods: We undertook longitudinal analysis of the nationally representative Household Income and Labour
Dynamics in Australian (HILDA) survey using modified Poisson regression models to estimate the relative risk of
falling into income poverty and multidimensional poverty between 2010 and 2012 for males and females, adjusting
for age, employment status, place of residence, marital status and housing tenure; and Population Attributable Risk
methodology to estimate the proportion of poverty directly attributable to psychological distress, measured by the
Kessler 10 scale.
Results: For males, having high psychological distress increased the risk of falling into income poverty by 1.68 (95%
CI: 1.02 to 2.75) and the risk of falling into multidimensional poverty by 3.40 (95% CI: 1.91 to 6.04). For females,
there was no significant difference in the risk of falling into income poverty between those with high and low
psychological distress (p = 0.1008), however having high psychological distress increased the risk of falling into
multidimensional poverty by 2.15 (95% CI: 1.30 to 3.55). Between 2009 and 2012, 8.0% of income poverty cases for
people aged 65 and over (95% CI: 7.8% to 8.4%), and 19.5% of multidimensional poverty cases for people aged 65
and over (95% CI: 19.2% to 19.9%) can be attributed to high psychological distress.
Conclusions: The elevated risk of falling into income and multidimensional poverty has been an overlooked cost of
poor mental health.
Keywords: Income, K10, Longitudinal analysis, Poverty, SF36
Key points
What is already known:
What this study adds:
1. Low income and poverty are risk factors for
depression;
2. Depression has been identified as a risk factor for
income poverty in working aged Australians;
3. Multidimensional measures of poverty look multiple
aspects of people’s lives, not just income, and may
pick up changes in living standards for older people
who are no longer working.
* Correspondence:
1
Australian Institute of Tropical Health and Medicine, James Cook University,
Building 48, Douglas Campus, Townsville, QLD 4811, Australia
Full list of author information is available at the end of the article
1. Older males who have high levels of psychological
distress have an increased risk of falling into
multidimensional poverty and income poverty;
2. Older females who have high levels of psychological
distress have an increased risk of falling into
multidimensional poverty but not income poverty;
3. Between 2009 and 2012, 8% of income poverty
cases for people aged 65 and over, and 19.5% of
multidimensional poverty cases for people aged 65
and over can be attributed to high psychological
distress.
© The Author(s). 2018 Open Access This article is distributed under the terms of the Creative Commons Attribution 4.0
International License ( which permits unrestricted use, distribution, and
reproduction in any medium, provided you give appropriate credit to the original author(s) and the source, provide a link to
the Creative Commons license, and indicate if changes were made. The Creative Commons Public Domain Dedication waiver
( applies to the data made available in this article, unless otherwise stated.
Callander and Schofield BMC Psychology (2018) 6:16
Background
As the population of many countries age, an increasing
proportion of the global population will be in their more
advanced years [34]. As such, increasing attention is being paid to the wellbeing and living standards of older
people [19, 22, 35, 53, 54]. Australia is no exception,
with 25% of the population expected to be aged over 65
by 2044–45 [40].
Considerable attention has been paid to the macroeconomic impacts of an older population within Australia –
increased health care costs, and welfare payments, and
reduced productivity from a lower aged-dependency ratio (the proportion of working aged people to the proportion of people of retirement age) [50]. At the
individual level, multiple studies have investigated the
living standards of older people, which have included the
assessment of health, income and other aspects of living
standards [4, 5, 38]. One study by McRae et al., also
explored the impact of healthcare costs on the living
standards of older people within Australia, concluding
that 12% faced catastrophic healthcare costs [33]. Older
people with depression also faced the third highest annual costs for health care. This highlights growing interest in the health - living standards nexus, including
mental health issues, amongst older Australians, and
how this affects the well-being of a growing proportion
of the population.
There is a vast body of literature that demonstrates
the association between mental illness and lower socioeconomic status in people of all ages [30, 31, 39, 41].
This literature, however, assesses the impact of income
poverty on later mental health status, rather than the
inverse relationship - the impact of mental illness on
poverty. The direction of the impact is important for
assessing points for potential intervention to ensure that
older people are not beset by both poor mental health
and poverty.
The limited literature assessing this inverse relationship, found that 57% of people aged 45 to 64 with depression were not in the labour force, and that these
people had a weekly income 73% lower than people who
were employed [42–45]. Butterworth et al. looked specifically at older workers and found that those who had
retired early were more likely to have mental disorders
than those in the labour force, particularly amongst men
[7] and similar results were also reported by Gill et al.
[24]. In a more recent study Butterworth et al. used longitudinal data of all ages to show that mental health status predicted future unemployment [8] and Kiely and
Butterworth [29] used longitudinal data to show that
mental health predicted receiving welfare payments [29].
However, these studies focus on the impact that mental
ill health has upon unemployment or income and given
that older people beyond the age of 65 have low rates of
Page 2 of 9
labour force participation these studies of lost earnings
or the impacts on employment are likely to be insensitive to the full impact of mental illness on the living
standards of people beyond the traditional retirement
age. This paper aims to determine whether having a high
level of psychological distress increases an older individual’s risk of falling into income poverty or multidimensional poverty and how many additional people fall into
poverty as a result of high psychological distress,
Methods
Dataset sampling and weighting
This is a longitudinal study utilising the Household Income and Labour Dynamics in Australia (HILDA) Survey focusing on the Australian population aged 65 years
and over in 2009. The HILDA survey is a longitudinal
survey of private Australian households conducted annually since 2001. The data are nationally representative
of the Australian population living in private dwellings
and aged 15 years and over. The survey sampling unit
for Wave 1 was the household, with all members of the
household being part of the sample that would be
followed for the life of the survey. The reference population for Wave 1 was all members of private dwellings in
Australia, except overseas residents, including diplomatic personnel, in Australia; residents of institutions
such as hospitals, military and police barracks, correctional institutions and monasteries and non-private
dwellings such as hotels; and people living in very
remote sparsely populated areas. Household sampling
was conducted in a three-stage approach. Initially, 488
Census Collection Districts (each containing 200 to 250
households) were selected, within each district 22 to 34
dwellings were then selected, and finally up to three
households within each dwelling were selected to be part
of the sample [49].
There were 1516 records aged 65 and over on Wave 9
(2009), 111 records were excluded as they did not
complete the Kessler 10 questionnaire or did not complete
the entire self-completed questionnaire in Wave 9, and
535 records were excluded as they were already in income
poverty in 2009, leaving a total sample of 870.
The initial household cross-sectional weights in Wave
1 (upon which the weights in subsequent waves are
dependent) were derived from the probability of selecting the household and were calibrated so that the
weighted estimates match known benchmarks for the
number of adults by the number of children and state by
part of state. The person-level weights were based on
the household weights and then calibrated so that person weights match known benchmarks for sex by age,
state by part of state, state by labour force status, marital
status and household composition. Longitudinal weights
adjust for attrition and were benchmarked against the
Callander and Schofield BMC Psychology (2018) 6:16
characteristics of Wave 1. For a detailed description of
HILDA weighting see Watson [52]). This paper focused
on the continuing person sample from Waves 9 to 12.
Income, health, education and poverty measures
There is a wide body of research within the poverty
measurement field that measures multiple aspects of
people’s lives, not just income, in order to assess poverty
status and measure standards of living [1, 48]. The impact of poor mental health on multidimensional poverty
status as been documented for people of working age
[13]; however, the impact on older members of society,
whose poverty status may be less influenced by employment income has not been explored. This study uses a
multidimensional poverty measure, the Freedom Poverty
Measure [9, 10], developed specifically for the Australian
population. It has been used in the past to assess the
multidimensional poverty status of different subpopulations [10, 14–16]. To determine an individual’s
multidimensional poverty status the Freedom Poverty
Measure measures income, health status and education
attainment. Those who are in multidimensional poverty
are considered to be in income poverty and have at least
one other form of disadvantage. Those in multidimensional poverty are in one of the following three groups:
1. Those who had poor health and were in income
poverty,
2. Those with an insufficient level of education
attainment and were in income poverty,
3. Those who had poor health, an insufficient level of
education attainment and were in income poverty.
Income poverty was based upon total regular annual
household income, which was composed of regular
private income (wages and salary, business income, investment income, and private pensions and transfers),
Australian government public transfers (government
income support payments and other government payments, such as family or carer payments), other public
payments such as scholarships, and foreign pensions.
This total income was then equivalised for the number
and age of household members using the OECDmodified equivalence scale [18]. The cut-off point for being in income poverty was having an equivalised annual
income less than 50% of the median equivalised annual
income for the Australian population of all ages.
Health status was measured using the Physical Component Summary (PCS) and Mental Component Summary
(MCS) scores from the SF-36 health scale [27], which was
available from the HILDA dataset. The PCS was used to
measure physical health and MCS was used to measure
mental health. Those with poor health had a PCS or MCS
Page 3 of 9
less than 75% of the average for their age and were calculated each year.
Education attainment was measured based upon a
person’s highest level of education attainment. Having
achieved Year 9 or lower was considered to be an insufficient level of education attainment. It has been estimated that 45% of people aged 65 years and over have
Year 9 or less as their highest level of education
attainment, and a much higher proportion of this education group are amongst the lowest income earners than
people with higher levels of education [11].
Kessler 10 (K-10)
The Kessler Psychological Distress Scale (K10) of nonspecific psychological distress [28] is a 10 item questionnaire about anxiety and depression symptoms the
respondent experienced in the previous 4 weeks. It was
administered as a part of the self-completion component
of the HILDA survey. The Kessler 10 survey has been
shown to be highly effective in screening for serious mental disorders and was found to strongly discriminate between DSM-IV/SCID cases and non-cases [21, 28] within
the Australian population. The K10 produced kappa and
weighted kappa scores ranging from 0.42 to 0.74 [17].
The HILDA survey included the K10 in Waves 7, 9
and 11, and grouped responses into four categories: low
(score range 10–15), moderate (score range 16–21), high
(score range 22–29), or very high (score range 30–50)
[49]. There are a number of different approaches taken
to the categorisation of K10 scores [2]. The approach
utilised in the HILDA survey is based upon the approach utilised by the Australian Bureau of Statistics [2].
Due to low sample numbers, the authors re-grouped this
variable to combine those with high and very high
psychological distress (referred to as those with ‘high
psychological distress’) and those with low and moderate
psychological distress (referred to as those with ‘low psychological distress’). Participants were grouped based
upon their response in wave 9 only.
Statistical analysis
Descriptive analysis was undertaken to identify the baseline characteristics in 2009 of those who were not
currently in income poverty. Two binary variables were
created that identified any individual who experienced 1)
income poverty or 2) multidimensional poverty between
2009 and 2012. The incidence of income poverty and
multidimensional poverty between 2010 and 2012 based
on the level of psychological distress was calculated and
modified Poisson regression models [55] were constructed to estimate the relative risk for falling into
income poverty and multidimensional poverty between
2010 and 2012 based on psychological distress category.
Those who had low psychological distress were used as
Callander and Schofield BMC Psychology (2018) 6:16
the reference group and the models were adjusted for
age, employment status in 2009, remoteness of the place
of residence in 2009, marital status in 2009 and housing
tenure in 2009.
The analysis was conducted separately for males and females. This was because of the known and well-established
differences in healthcare outcomes, and employment participation while of working age for males and females
within Australia [3].
Modified Poisson regression analysis is a Poisson regression with a robust error variance, described by Zou [55].
Poisson regression is generally regarded as an appropriate
method of analysis for events with a low probability (such
as poverty) when respondents are followed over time [55].
However, traditional Poisson regression produces conservative error estimates [20], and the modified methodology
described by Zou [55] provides a way of overcoming this.
A sensitivity analysis was conducted to exclude the potential of the SF-36 MCS – a summary score of mental
health – influencing the results. The correlation coefficient between the K10 score and SF-36 mental health
score was − 0.81, p < .0001. Rather than the ‘poor health’
component of the multidimensional poverty measure being defined as having an MCS or PCS score less than
75% of the mean score for the respondents age, the sensitivity analysis defined ‘poor health’ as having only a
PCS score less than 75% of the mean score for the
respondents age (i.e. the MCS score was excluded). The
modified Poisson regression models to estimate the relative risk for falling into multidimensional poverty between 2010 and 2012 based on psychological distress
category was then repeated. Those who had low psychological distress were used as the reference group and the
models were adjusted for age, employment status in
2009, remoteness of the place of residence in 2009,
marital status in 2009 and housing tenure in 2009. The
analysis was again conducted separately for males and
females.
In order to estimate the proportion of income poverty
and multidimensional poverty cases attributable to high
psychological distress, the percent of cases that would be
prevented if high psychological distress was eliminated
was estimated using the population attributable risk
method (PAR) [47]. This is based on the relative risk of
income poverty and multidimensional poverty for high
psychological distress, adjusted for age, sex, employment
status in 2009, remoteness of the place of residence in
2009, marital status in 2009 and housing tenure in 2009,
and the prevalence for the combinations of each of these
risk factors. The partial PAR was calculated using an
SAS macro developed by Hertzman et al. [26].
All of the analysis was undertaken on weighted data
using SAS V9.2. Statistical significance was set at a
5% level.
Page 4 of 9
Results
There were 69 records of individuals aged 65 and over
in 2009 on the HILDA dataset who had high psychological distress in 2009 (102,400 people in the Australian
population), and 801 records of individuals who had low
psychological distress (representing 1,111,500 people in
the population).
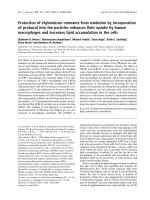
Table 1 shows the demographic and employment characteristics in the baseline year, 2009. Of those who had
high psychological distress, a higher proportion were female (58%) and not in the labour force (91%) and a
lower proportion were employed (9%), compared to
those with low psychological distress (51% female, 79%
not in the labour force and 20% employed). A higher
proportion of those with high psychological distress lived
in outer regional and remote Australia than those with
low psychological distress.
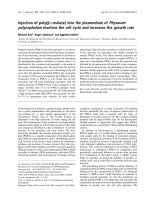
Table 2 shows that between 2009 and 2012, 30% of
people with low psychological distress in 2009 fell into
income poverty, as compared to 49% of people with high
psychological distress in 2009. Table 3 also shows that
18% of people with low psychological distress fell into
multidimensional poverty between 2009 and 2012, and
48% of people with high psychological distress fell into
multidimensional poverty between 2009 and 2012. Most
people with low psychological distress who fell into
multidimensional poverty had low income and an insufficient level of education attainment, whereas the majority of people with high psychological distress had low
income and poor health, or low income, poor health and
an insufficient level of education attainment (Table 2).
When disaggregated by sex, 51% of males with high
psychological distress and 28% of males with low psychological distress fell into income poverty, and 48% of
females with high psychological distress and 33% of females with low psychological distress fell into income
poverty. 51% of males with high psychological distress
and 14% of males with low psychological distress fell
into multidimensional poverty, and 46% of females with
high psychological distress and 21% of females with low
psychological distress fell into multidimensional poverty.
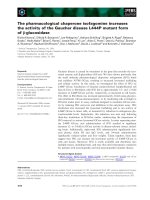
After adjusting for age, employment in 2009, remoteness of residence in 2009, marital status in 2009 and
housing tenure in 2009, males with high psychological
distress had 1.68 times the risk of falling into income
poverty between 2010 and 2012 (95% CI: 1.02–2.75)
compared to males with low psychological distress
(Table 3). There was no significant difference in the risk
of falling into income poverty between females with high
and low psychological distress (p = 0.1008) (Table 3).
Having high psychological distress also increased the
risk of both males and females falling into multidimensional poverty between 2009 and 2012, after adjusting
for age, employment in 2009, remoteness of residence in
Callander and Schofield BMC Psychology (2018) 6:16
Page 5 of 9
Table 1 Baseline characteristics, Australian population aged 65 years and over who were not already in income poverty in 2009
Characteristic
Low psychological distress
High psychological distress
n
n
N (%)
N (%)
Age – mean (SD)
72.5 (6.3)
Female sex – no (%)
412
568,100 (51%)
42
67,400 (58%)
Male sex – no (%)
27
543,400 (49%)
394
35,000 (42%)
Major City
479
692,800 (62%)
41
59,100 (58%)
Inner Regional Australia
224
294,700 (27%)
16
20,700 (20%)
Outer Regional Australia
87
107,400 (10%)
11
19,700 (19%)
Remote Australia
16
16,500 (1%)
1
2800 (3%)
Employed
170
222,200 (20%)
6
9500 (9%)
Unemployed
3
11,100 (1%)
0
0
Not in the labour force (retired)
633
878,100 (79%)
63
93,000 (91%)
801
1,111,500
69
102,400
73.0 (6.2)
Area
Labour force status
TOTAL
2009, marital status in 2009 and housing tenure in 2009.
Males with high psychological distress had 3.40 times
the risk (95% CI: 1.91–6.04), and females with high
psychological distress had 2.15 times the risk (95% CI: 1.
30–3.55) of falling into multidimensional poverty
compared to their counterparts with low psychological
distress (Table 4).
The sensitivity analysis, where the SF-36 MCS was removed from the multidimensional poverty measure,
shows that both males (RR: 2.32, 95% CI: 1.17–4.60) and
females (RR: 2.34, 95% CI: 1.39–3.93) with high psychological distress still had a significantly higher risk of falling
into multidimensional poverty compared to those with
low psychological distress –after adjusting for age, employment in 2009, remoteness of residence in 2009, marital status in 2009 and housing tenure in 2009 (Table 5).
If all cases of high psychological distress in people
aged 65 years and over in 2009 had been prevented than
an estimated 8.0% of income poverty cases would have
been avoided between 2010 and 2012 (95% CI: 7.8% to
8.4%), and an estimated 19.5% of multidimensional poverty cases would have been avoided between 2010 and
2012 (95% CI: 19.2% to 19.9%).
Discussion
The results of this paper have shown that having high
psychological distress increases the risk of older males
falling into income poverty compared to those with only
low psychological distress; however, there was no significant difference in the risk for older females between
those with high and low levels of psychological distress.
This is in line with the results of previous studies, which
have found that while older males are more likely to
retire early after developing mental disorders, the relationship was less pronounced for females [7, 24]. To
date, no studies have specifically sought to use longitudinal data to document whether mental illness is a risk
factor for income poverty.
In addition to showing the higher risk of income poverty, this study goes further by using a multidimensional
Table 2 Proportion of people who fell into poverty between 2009 and 2012, Australian population aged 65 years and over who
were not already in income poverty in 2009
Low psychological distress
(n = 801; N = 1,111,500)
Income Poverty
High psychological
distress (n = 69;
N = 102,400)
n
N(%)
n
N(%)
251
336,200 (30%)
35
50,300 (49%)
Multidimensional Poverty – total
143
195,700 (18%)
33
48,800 (48%)
Multidimensional poverty – low income and poor health
34
57,000 (5%)
10
19,400 (19%)
Multidimensional poverty – low income and insufficient education attainment
80
110,100 (10%)
8
11,500 (11%)
Multidimensional poverty – low income, poor health and insufficient education attainment
29
29,600 (3%)
15
17,400 (17%)
a = low or moderate psychological distress as the reference group; adjusted for age, sex, employment in 2007 and remoteness of residence in 2007
Callander and Schofield BMC Psychology (2018) 6:16
Page 6 of 9
Table 3 Modified Poisson regression model of incidence of income poverty between 2009 and 2012, Australian population aged
65 years and over
Males
Females
Estimate (95% CI)
p-value
Estimate (95% CI)
p-value
Intercept
−2.97 (−5.07, − 0.88),
0.0053
− 1.28 (− 3.30, 0.74)
0.2149
High psychological distress
0.52 (0.02, 1.01),
0.0397
0.39 (− 0.08, 0.87)
0.1008
Age – continuous
0.02 (− 0.01, 0.05)
0.1684
−0.002 (− 0.03, 0.03)
0.9018
Not in the labour force
0.29 (−0.18, 0.75)
0.2252
0.27 (−0.20, 0.73)
0.2582
Major city
−0.09 (− 0.35, 0.33)
0.9603
− 0.09 (− 0.39, 0. 21)
0.5512
Married
0.15 (− 0.30, 0.61)
0.5155
− 0.05 (− 0.40, 0.31)
0.8008
Own home
− 0.06 (− 0.59, 0.48)
0.8375
0.15 (− 0.40, 0.71)
0.5900
1.68 (1.02, 2.75)
0.0397
1.48 (0.93–2.37)
0.1008
Adjusted relative risk
High psychological distress VS Low psychological distress
measure of poverty, which captures a broader spectrum
of factors that influence living standards. The results
have shown that there is a significantly higher risk of
both older males and females falling into multidimensional poverty amongst those with high psychological
distress. The living standards of those in multidimensional poverty are seen to be poorer than those who are
in income poverty but have no further forms of disadvantage, as those in multidimensional poverty not only
have the burden of low income, but also have poor
health or a relatively poor level of education attainment
acting as barriers to improving their income, or indeed
acting as a drain on their income (in the case of poor
health [32]). As such, these findings identify older adults
with high psychological distress as being a key target
population for policies to improve living standards of
vulnerable populations. Similarly, interventions to prevent high levels of psychological distress developing in
older adults may be seen to have the additional indirect
benefits of preventing cases of poverty. This study has
indicated a need for policy to consider the multi-faceted
needs of older people within the population. Health care
and income support are generally delivered in silos, with
little recognition of how health influences economic status and how economic status influences health. A more
holistic approach to people’s wellbeing may be required,
with better communication between sectors.
Studies that have looked at the costs of mental illness in terms of lost income have generally focused
on lower labour force participation rates as a driver
of low income, both within Australian and internationally ([6, 7, 24, 25, 36]; D Schofield et al., 2011;
[46, 51]). However, given the older age group lower
labour force participation is likely to only be part of
the reason for lower income reported in this study,
due to the majority of older people with and without
high psychological distress being out of the labour
force. None-the-less those with low psychological
distress did have a higher proportion of people in
employment and so the analysis adjusted for labour
force status.
The high risk of falling into multidimensional poverty,
even after controlling for employment status, may be explained by older people with high psychological distress
Table 4 Modified Poisson regression model of incidence of multidimensional poverty between 2009 and 2012, Australian
population aged 65 years and over
Males
Intercept
Females
Estimate (95% CI)
p-value
Estimate (95% CI)
p-value
−2.65 (−5.10, −0.21)
0.0333
−1.23 (−3.86, 1.39)
0.3571
High psychological distress
1.22 (0.65, 1.80)
<.0001
0.76 (0.26, 1.27)
0.0030
Age – continuous
0.01 (−0.02, 0.05)
0.4914
−0.006 (− 0.04, 0.03)
0.7310
Not in the labour force
0.17 (−0.48, 0.82)
0.6050
0.26 (−0.34, 0.86)
0.3961
Major city
−0.14 (− 0.64, 0.36)
0.5809
− 0.24 (− 0.63, 0.14)
0.2125
Married
− 0.45 (− 0.99, 0.08)
0.0982
0.07 (− 0.40, 0.54)
0.7710
Own home
0.14 (− 0.65, 0.92)
0.7357
0.02 (− 0.56, 0.59)
0.9560
3.40 (1.91–6.04)
<.0001
2.15 (1.30–3.55)
0.0030
Adjusted relative risk
High psychological distress VS Low psychological distress
Callander and Schofield BMC Psychology (2018) 6:16
Page 7 of 9
Table 5 Sensitivity analysis modified poisson regression model of incidence of multidimensional poverty between 2009 and 2012,
Australian population aged 65 years and over
Males
Females
Estimate (95% CI)
p-value
Estimate (95% CI)
p-value
Intercept
−3.06 (−5.87, −0.24)
0.0332
0.44 (−2.26, 3.14)
0.7491
High psychological distress
0.84 (0.16, 1.53)
0.0160
0.85 (0.33, 1.37)
0.0013
Age – continuous
0.02 (−0.02, 0.06)
0.3345
−0.03 (− 0.07, 0.003)
0.0760
Not in the labour force
0.10 (−0.59, 0.80)
0.7726
0.38 (−0.25, 1.02)
0.2383
Major city
−0.34 (− 0.88, 0.21)
0.2240
− 0.29 (− 0.70, 0.11)
0.1578
Married
− 0.46 (−1.04, 1.22)
0.1211
0.12 (− 0.61, 0.36)
0.6185
Own home
0.12 (−0.73, 0.99)
0.7894
0.12 (−0.50, 0.74)
0.6959
2.32 (1.17–4.60)
0.0160
2.34 (1.39–3.93)
0.0013
Adjusted relative risk
High psychological distress VS Low psychological distress
and low income and poor overall health accessing their
savings or accumulated wealth stocks to pay for their
health condition (or conditions). The results did show
that a high proportion of people with high psychological
distress who were in multidimensional poverty had low
income and poor health, rather than just low income
and a low level of education attainment. Individuals aged
45 to 64 in Australia who had depression or another
mental illness were more likely to have significantly less
wealth or none at all [42, 44, 45]. A recent study of the
out-of-pocket medical costs faced by older Australians
listed depression as the third most costly condition, only
behind heart disease and cancer [32], and another study
has shown that over 40% of Australians with depression
skip health care due to the cost [12]. In addition to the
potential for medical costs to reduce the amount of
wealth held by older people with psychological distress,
it is known that those with depression and other mental
health problems are less likely to hold income producing
assets such as investment properties and shares [44, 45].
Thus, even if developing high psychological distress did
not result in a drawdown of total wealth, it may result in
a change in wealth portfolio structure to safer and less
management intensive assets, which also produce lower
returns, hence negatively affecting income.
Even after removing the SF-36 MCS, which measures
overall mental health, from the measure of multidimensional poverty, both males and females with high
psychological distress were still more likely to be multidimensionally poor, having low income plus either poor
overall health status or an insufficient level of education
attainment. This is likely to be explained by the findings
of other studies, which have shown that amongst older
adults, depression does increase the risk of a decline in
physical health [23, 37].
The key limitation of this study is that it is based on
self-reported data. Firstly, the study relies on responses
to the Kessler-10 survey instrument and does not
measure clinically diagnosed psychological distress. The
measure also only asks respondents about their experiences
in the previous 4 weeks. Despite this, the K10 is a validated
survey instrument shown to have good validity and reliability (as noted in the methodology section). Furthermore,
cognitive ability at baseline is a further potential confounder
that was not available on the dataset and thus not included
in the analysis. It should also been noted that although the
HILDA dataset is accompanied by population weights, and
weighted results are reported, the sample was truncated,
with those already in income poverty excluded. This may
have affected the accuracy of the population weights.
Conclusions
Overall the results of this study have shown that older
adults with high psychological distress have a higher risk
of falling into income poverty and multidimensional poverty. Nearly half of older adults with high psychological
distress in 2009 would fall into income poverty and multidimensional poverty by 2012. Even after adjusting for potential confounders, older males with high psychological
distress had 1.7 times the risk of falling into income poverty and 3.4 times the risk of falling into multidimensional
poverty, and older females had 2.2 times the risk of falling
into multidimensional poverty, than their counterparts
with low physiological distress. To date, these additional
costs of psychological distress have not been quantified.
Abbreviations
HILDA: Household Income and Labour Dynamics in Australia; K10: Kessler-10;
MCS: Mental Component Summary; PAR: Population attributable risk;
PCS: Physical Component Summary
Acknowledgements
This paper uses unit record data from the Household, Income and Labour
Dynamics in Australia (HILDA) Survey. The HILDA Project was initiated and is
funded by the Australian Government Department of Social Services (DSS)
and is managed by the Melbourne Institute of Applied Economic and Social
Research (Melbourne Institute). The findings and views reported in this
paper, however, are those of the author and should not be attributed to
either DSS or the Melbourne Institute.
Callander and Schofield BMC Psychology (2018) 6:16
Funding
Part of Dr. Callander’s salary comes from a National Health and Medical
Research Council (NHMRC) early Career Fellowship (APP1052742).
Availability of data and materials
The HILDA dataset is available to researchers upon request (https://
melbourneinstitute.unimelb.edu.au/hilda).
Authors’ contributions
EC conceived the original study idea, undertook the analysis and drafted the
manuscript. DS contributed to the study design and provided input to the
interpretation of results and editing of the final manuscript. Both authors
have read and approved the final version of the manuscript.
Ethics approval and consent to participate
This study consisted of secondary analysis of existing, publically available
data, as such, ethics approval was not required.
Competing interests
The authors declare that they have no competing interests.
Publisher’s Note
Springer Nature remains neutral with regard to jurisdictional claims in
published maps and institutional affiliations.
Author details
1
Australian Institute of Tropical Health and Medicine, James Cook University,
Building 48, Douglas Campus, Townsville, QLD 4811, Australia. 2Faculty of
Pharmacy, The University of Sydney, Sydney, Australia.
Received: 22 March 2017 Accepted: 6 April 2018
References
1. Alkire S, Santos M. A multidimensional approach: poverty measurement &
beyond. Soc Indic Res. 2013;112(2):239–57.
2. Australian Bureau of Statistics. Household expenditure survey, Australia:
summary of results, 2003-04 6530.0. Retrieved from Canberr. Canberra:
Australian Bureau of Statistics; 2005.
3. Australian Bureau of Statistics. Gender indicators, Australia, Feb 2016 in.
Canberra: ABS; 2016.
4. Australian Institute of Health and Welfare. Older Australia at a glance.
Canberra: AIHW; 2017.
5. Bradbury B, Gubhaju B. Housing costs and living standards among the
elderly. Canberra: Australian Department of Families, Housing, Community
Services and Indigenous Affairs; 2010.
6. Brazenor R. Disabilities and labour market earnings in Australia. Aust J
Labour Econ. 2002;5(3):319–34.
7. Butterworth P, Gill SC, Rodgers B, Anstey KJ, Villamil E, Melzer D. Retirement
and mental health: analysis of the Australian national survey of mental
health and well-being. Soc Sci Med. 2006;62(5):1179–91.
8. Butterworth P, Leach LS, Pirkis J, Kelaher M. Poor mental health influences
risk and duration of unemployment: a prospective study. Soc Psychiatry
Psychiatr Epidemiol. 2012;47(6):1013–21.
9. Callander E, Schofield D, Shrestha R. Towards a holistic understanding of
poverty: a new multidimensional measure of poverty for Australia. Health
Sociol Rev. 2012a;21(2):138–52.
10. Callander E, Schofield D, Shrestha R. Freedom poverty: a new tool to
identify the multiple disadvantages affecting those with CVD. Int J Cardiol.
2013;166(2):321–6.
11. Callander E, Schofield D, Shrestha R, Kelly S. Sufficient education attainment
for a decent standard of living in modern Australia. J Soc Inclusion. 2012;
3(1):8–20.
12. Callander EJ, Corscadden L, Levesque, J-F. Out-of-pocket healthcare
expenditure and chronic disease – do Australians forgo care because of the
cost? Australian journal of primary health, PY16005, −. 2016. />10.1071/PY16005.
13. Callander EJ, Schofield DJ. Psychological distress and the increased risk of
falling into poverty: a longitudinal study of Australian adults. Soc Psychiatry
Psychiatr Epidemiol. 2015;50(10):1547–56.
Page 8 of 9
14. Callander EJ, Schofield DJ, Shrestha RN. Multi-dimensional poverty in
Australia and the barriers ill health imposes on the employment of the
disadvantaged. J Socio Econ. 2011;40(6):736–42.
15. Callander EJ, Schofield DJ, Shrestha RN. Capacity for freedom–using a new
poverty measure to look at regional differences in living standards within
Australia. Geogr Res. 2012c;50(4):411–20.
16. Callander EJ, Schofield DJ, Shrestha RN. Multiple disadvantages among
older citizens: what a multidimensional measure of poverty can show. J
Aging Soc Policy. 2012d;24(4):368–83.
17. Dal Grande E. The Kessler psychological distress scale (K10). In: Population
Research and Outcomes Studies Brief Reports. Adelaide: South Australian
Department of Health; 2002.
18. De Vos K, Zaidi MA. Equivalence scale sensitivity of poverty statistics for the
member states of the European community. Rev Income Wealth. 1997;43(3):
319–33.
19. Engelhardt GV, Gruber J. Social security and the evolution of elderly poverty.
Paper presented at the Berkeley Symposium on Poverty, the Distribution of
Income, and Public Policy. Berkely: University of California; 2003.
20. Fang J. Using SAS® Procedures FREQ, GENMOD, LOGISTIC, and PHREG to
Estimate Adjusted Relative Risks – A Case Study. In: SAS Global Forum 2011.
Toronto, Ontario: Institute for Clinical Evaluative Sciences; 2011.
21. Furukawa TA, Kessler RC, Slade T, Andrews G. The performance of the K6
and K10 screening scales for psychological distress in the Australian
National Survey of mental health and well-being. Psychol Med. 2003;33(02):
357–62.
22. Gasparini L, Alejo J, Haimovich F, Olivieri S, Tornarolli L. Poverty among the
Elderly in Latin America and the Caribbean. Argentina: Universidad Nacional
de La Plata; 2007.
23. Geerlings SW, Beekman AT, Deeg DJ, Van Tilburg W. Physical health and the
onset and persistence of depression in older adults: an eight-wave
prospective community-based study. Psychol Med. 2000;30(02):369–80.
24. Gill SC, Butterworth P, Rodgers B, Anstey KJ, Villamil E, Melzer D. Mental
health and the timing of men’s retirement. Soc Psychiatry Psychiatr
Epidemiol. 2006;41(7):515–22.
25. Goetzel RZ, Hawkins K, Ozminkowski RJ, Wang S. The health and
productivity cost burden of the top 10 physical and mental health
conditions affecting six large U.S. employers in 1999. J Occup Environ Med.
2003;45(1):5–14.
26. Hertzman E, Wand H, Spiegelman D. The SAS PAR macro. Boston: Harvard
School of Public Health; 2006.
27. Ware JE, Sherbourne CD. "The MOS 36-Item Short-Form Health Survey (SF-36):
I. Conceptual Framework and Item Selection." Medical Care. 1992;30(6):473–83.
28. Kessler RC, Andrews G, Colpe LJ, Hiripi E, Mroczek DK, Normand SL, Zaslavsky
AM. Short screening scales to monitor population prevalences and trends in
non-specific psychological distress. Psychol Med. 2002;32(06):959–76.
29. Kiely KM, Butterworth P. Mental health selection and income support
dynamics: multiple spell discrete-time survival analyses of welfare receipt. J
Epidemiol Community Health. 2013;68:349–55.
30. Lorant V, Croux C, Weich S, Deliege D, Mackenbach J, Ansseau M.
Depression and socio-economic risk factors: 7-year longitudinal population
study. Br J Psychiatry. 2007;190(4):293–8.
31. Lorant V, Deliège D, Eaton W, Robert A, Philippot P, Ansseau M.
Socioeconomic inequalities in depression: a meta-analysis. Am J Epidemiol.
2003;157(2):98–112.
32. McRae I, Yen L, Jeon Y, Herath M, Essue B. The Health of Senior Australians
and the Out-of-Pocket Healthcare Costs They Face. Report, published by
National Seniors Australia in Brisbane. Retrieved from Canberra; 2012.
33. McRae I, Yen L, Jeon Y-H, Herath PM, Essue B. Multimorbidity is associated
with higher out-of-pocket spending: a study of older Australians with
multiple chronic conditions. Aust J Prim Health. 2013;19(2):144–9.
34. Organisation for Economic Co-operation and Development. Ageing
societies. In: OECD Factbook. Paris: OECD; 2008. p. 2008.
35. Organisation for Economic Co-operation and Development (OECD). Old-age
income poverty. Paris: OECD; Retrieved from 2011.
36. Patel A, Knapp M. Costs of mental illness in England. Mental Health
Research Review. 1998;5:4–10.
37. Penninx BW, Deeg DJ, van Eijk JTM, Beekman AT, Guralnik JM. Changes in
depression and physical decline in older adults: a longitudinal perspective. J
Affect Disord. 2000;61(1):1–12.
38. Phillips B. Living standard trends in Australia: Report for Anglicare Australia.
Ainslie: Anglicare Australian; 2005.
Callander and Schofield BMC Psychology (2018) 6:16
39. Power C, Stansfeld SA, Matthews S, Manor O, Hope S. Childhood and
adulthood risk factors for socio-economic differentials in psychological
distress: evidence from the 1958 British birth cohort. Soc Sci Med. 2002;
55(11):1989–2004.
40. Productivity Commission. Economic implications of an ageing Australia.
Retrieved from Canberra. Canberra: Productivity Commission; 2005.
41. Sareen J, Afifi TO, McMillan KA, Asmundson GJ. Relationship between
household income and mental disorders: findings from a population-based
longitudinal study. Arch Gen Psychiatry. 2011;68(4):419–27.
42. Schofield D, Kelly S, Shrestha R, Callander E, Passey M, Percival R. How
depression and other mental illness can affect future living standards of
those out of the labour force. Ageing Mental Health. 2011;15(5):654–62.
43. Schofield D, Shrestha R, Passey M, Earnest A, Fletcher S. Chronic disease and
labour force participation among older Australians. Med J Aust. 2008;189:
447–50.
44. Schofield D, Shrestha R, Percival R, Kelly S, Passey M, Callander E.
Quantifying the effect of early retirement on the wealth of individuals with
depression or other mental illness. Br J Psychiatry. 2011;198:123–8.
45. Schofield D, Shrestha R, Percival R, Passey M, Callander E, Kelly S. The
personal and national costs of mental health conditions: impacts on
income, taxes, government support payments due to lost labour force
participation. BMC Psychiatry,2011 11(72).
46. Smith K, Shah A, Wright K, Lewis G. The prevalence and costs of psychiatric
disorders and learning disabilities. Br J Psychiatry. 1995;166(1):9–18.
47. Spiegelman D, Hertzmark E, Wand H. Point and interval estimates of partial
population attributable risks in cohort studies: examples and software.
Cancer Causes Control. 2007;18(5):571–9.
48. Stiglitz J, Sen A, Fitoussi J. Report by the Commission on the Measurement
of Economic Performance and Social Progress. Retrieved from Paris. Paris:
French Government; 2009.
49. Summerfield M, Freidin S, Hahn M, Ittak P, Li N, Macalalad N, Wooden M. HILDA
user manual – release 12. Melbourne: The University of Melbourne; 2013.
50. The Treasury. Intergenerational report 2015. Canberra: Australia Government;
2015.
51. Thomas CM, Morris S. Cost of depression among adults in England in 2000.
Br J Psychiatry. 2003;183:514–9.
52. Watson N. Longitudinal and cross-sectional weighting methodology for the
HILDA survey, HILDA project technical paper series no. Retrieved from
Melbourne, Australia: 2/12. Melbourne: Melbourne Institute; 2012.
53. Zaidi A. Poverty of elderly people in EU25. Vienna: European Centre for
Social Welfare Policy and Research; 2006.
54. Zaidi A. Poverty Risks for Older People in EU Countries – An Update.
Retrieved from Vienna. Vienna: European Centre for social Welfare policy
and research; 2010.
55. Zou G. A modified poisson regression approach to prospective studies with
binary data. Am J Epidemiol. 2004;159:702–6.
Page 9 of 9