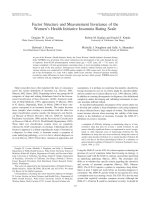
Stress among university students: Fstructure and measurement invariance of the Italian version of the Effort-Reward Imbalance student questionnaire
Bạn đang xem bản rút gọn của tài liệu. Xem và tải ngay bản đầy đủ của tài liệu tại đây (535.1 KB, 7 trang )
Portoghese et al. BMC Psychology
(2019) 7:68
/>
RESEARCH ARTICLE
Open Access
Stress among university students: factorial
structure and measurement invariance of
the Italian version of the Effort-Reward
Imbalance student questionnaire
Igor Portoghese1, Maura Galletta1* , Fabio Porru2, Alex Burdorf2, Salvatore Sardo1, Ernesto D’Aloja1,
Gabriele Finco1 and Marcello Campagna1
Abstract
Background: In the last decade academic stress and its mental health implications amongst university students has
become a global topic. The use of valid and theoretically-grounded measures of academic stress in university settings
is crucial. The aim of this study was to examine the factorial structure, reliability and measurement invariance of the
short student version of the effort-reward imbalance questionnaire (ERI-SQ).
Methods: A total of 6448 Italian university students participated in an online cross-sectional survey. The factorial
structure was investigated using exploratory factor analysis and confirmatory factor analysis. Finally, the measurement
invariance of the ERI-SQ was investigated.
Results: Results from explorative and confirmatory factor analyses showed acceptable fits for the Italian version of the
ERI-SQ. A modified version of 12 items showed the best fit to the data confirming the 3-factor model. Moreover, multigroup
analyses showed metric invariance across gender and university course (health vs other courses).
Conclusions: In sum, our results suggest that the ERI-SQ is a valid, reliable and robust instrument for the measurement of
stress among Italian university students.
Keywords: Student stress, ERI, Effort, Reward, Overcommitment, Factorial validity, Invariance
Background
In the last decade, there has been a growing attention in
investigating stress risk factors and well-being consequences among university student’s population [1, 2].
Stress and mental health of university students is a crucial
public health subject as healthy students will be the
healthier workers of the future. Attending university has
the potential to become a positive and satisfying experience for students’ life. However, there is empirical evidence that being a student may become a stressful
experience [1, 3–6]. Stallman and Hurst [2] distinguished
between eustress, important for student motivation and
success at university, and distress, harmful for student’s
* Correspondence:
1
Dipartimento di Scienze Mediche e Sanità Pubblica, Università degli Studi di
Cagliari, SS554 bivio per Sestu, 09042 Monserrato, CA, Italy
Full list of author information is available at the end of the article
well-being, as it exposes to a higher risk of psychological
(for example, anxiety and burnout), behavioral (for example eating disorders), physical health problems (for example, ulcers, high blood pressure, and headaches), and
suicidal ideation [7–10]. Furthermore, many scholars
found that high stress was linked to reduced academic
performance, low grade averages, and low rates of graduation and higher dropout [11–15].
Academic stressors have been identified as including
high workload, attending lessons, respecting deadlines,
balancing university and private life, and economic
issues. Those stressors are linked to a greater risk of distress and reduced academic achievement [1, 16–19].
Many authors adopted and extended original measures
of stress, for example, by adapting work related stress
measures to the university context [20, 21]. Most of
these measures were designed for medical students [22]
© The Author(s). 2019 Open Access This article is distributed under the terms of the Creative Commons Attribution 4.0
International License ( which permits unrestricted use, distribution, and
reproduction in any medium, provided you give appropriate credit to the original author(s) and the source, provide a link to
the Creative Commons license, and indicate if changes were made. The Creative Commons Public Domain Dedication waiver
( applies to the data made available in this article, unless otherwise stated.
Portoghese et al. BMC Psychology
(2019) 7:68
or employed measures of stress not specifically developed for the academic context [20–22].
According to Hilger-Kolb, Diehl, Herr, and Loerbroks
[23], the vast majority of these measures lack a stress
theoretical model. It may represent an important limitation as, meausers based on a common tested stress
model may be better help researchers to capture the
links between stress and health among university students and to develop theory-based interventions [21].
Effort-Reward Imbalance (ERI) [24] is among the most
common tested and valid models of stress. According to
this model, when high efforts are balanced by low rewards, the resulting imbalance may generate negative
emotions and sustained stress experiences. Originally developed to investigate stress risks among workers, this
model has been the theorethical root of many studies investigating stress in non-working contexts.
Recently, Wege, Muth, Angerer, and Siegrist [25] extended the original ERI model to the context of university and adapted the ERI short questionnaire to the
university setting, showing good psychometric properties. Thus, according to this theoretical approach, students’ stress was defined as the result of an imbalance
between effort, such as high study load, and reward,
such as being respected from supervisors.
A vast number of empirical studies measuring effort–
reward imbalance in workplace context confirmed good
psychometric qualities of the ERI short questionnaire
[26, 27]. Furthermore, psychometrically validated versions have been tested in 9 languages and in large European cohort studies, confirming the good psychometric
qualities of the short ERI [28, 29].
Concerning the student version of the ERI, there is
limited psychometric information available. Given the
importance of academic stress for understanding students’ mental health risk, the aim of this study was to
investigate the psychometric properties of the Italian
version of the ERI-student questionnaire [25]. To
address this goal, we examined the factor structure of
the Italian version of the ERI-SQ, assessed internal
consistency for the dimensions of effort, reward, and
over-commitment, and test the measurement invariance
of the ERI-SQ.
Page 2 of 7
level and master level). The survey’s homepage reported
the online informed consent form with specific information about study purpose, general description of the
questionnaire, including information about risks and
benefits of participation. Also, the time necessary to
complete the survey (less than 10 min) and privacy policy information were reported. Specifically, to ensure
anonimity, we did not register ip address neither requested any another sensitive data. The investigators
and research team did not employ any active advertising
to increase recruitment rates neither played any active
role in selecting and/or targeting specific subpopulations
of respondents. A total of 9883 students agreed to participate in the survey with 6448 (65.24%) completing the
survey (target population: 1.654.680 Italian university
students in 2017). The Italian version of the ERI-SQ (see
Table 4 in Appendix) was translated following the backtranslation procedure [30].
Demographics
The sample for this research consisted of 75.5% females
(n = 4869). Participants in this study ranged from 19 to
56 years of age, M = 22.97, SD = 3.01. 56.2% (3624) were
enrolled in bachelor prrogrammes and 43.8% (2824) in
master programmes. 39.6% (2551) were enrolled in
health related courses (such as medicine, nursing, psychology, and biomedical science).
Measures
Stress was assessed with the ERI-SQ [25] that was developed for use in student samples. The version adopted in
this study consists of 14 items that constitute three
scales: Effort (EFF; 3 items; example: “I have constant
time pressure due to a heavy study load”), Rewards
(REW; 6 items; example: “I receive the respect I deserve
from my supervisors/teachers”), and over-commitment
(OC; 6 items; example: “As soon as I get up in the morning I start thinking about study problems”). All items are
scored on a 4-point rating scale ranging from 1 (strongly
disagree) to 4 (strongly agree). Average scores of items
ratings for each subscale were calculated following appropriate recoding.
Statistical analyses
Methods
Participants and procedure
The study population (convenience sample) was recruited through a public announcement at electronic
learning platforms for students and university students’
associations’ network that contained an invitation for
participating in a “Health Promoting University” survey.
The online survey was implemented with Limesurvey
from October 16th, 2017 to November 27th, 2017 and
was restricted to enrolled university students (bachelor
Statistical analyses were performed with R [31] and
Rstudio [32]. The factorial structure was investigated
using exploratory factor analysis (EFA; psych package)
[33] and confirmatory factor analysis (CFA; lavaan package) [34]. The dataset was randomly split in half to allow
for independent EFA (training set) and CFA (test set). A
robust ML estimator was used for correcting violations
of multivariate normality.
The analyses were conducted in two stages. Firstly, an
EFA with principal axis factor (PAF) analysis was
Portoghese et al. BMC Psychology
(2019) 7:68
performed. Using Horn’s Parallel Analysis for factor retention. Internal consistency was assessed via Cronbach’s
alpha coefficient.
The second stage of analysis involved investigating the
factor structure of the Italian version of the ERI-SQ, a
series of CFA were performed. As Mardia’s test of multivariate kurtosis (28.78, p < .0001) showed multivariate
non-normality, we investigated model fit with robust
maximum likelihood (MLM) [35]. We compared alternative models: a 1-factor model, in which all 14 items were
assessed as one common factor, a 3-factor model where
items reflected the three subscales of the ERI-SQ, and a
three-factor model with adjustments made according to
error theory. We considered several fit indices: χ2(S-B
χ2) [36], the robust root mean square error of approximation (RMSEA); the standardized root mean square residual (SRMR) and the robust comparative fit index
(CFI). For CFI, score > .90 indicated acceptable model fit.
For both RMSEA and SRMR, score ≤ .05 was considered
a good fit, and ≥ .08 a fair fit [37, 38].
Finally, the measurement invariance of the ERI-SQ
was investigated. We performed a series of multi-group
CFAs. We tested 5 nested models with progressive constrained parameters: Model 0 tested for configural invariance; Model 1 tested for metric invariance
(constrained factor loadings); Model 2 tested for scalar
invariance (constrained factor loadings and item intercepts); Model 3 tested for uniqueness invariance (constrained factor loadings, item intercepts, and residual
item variances/covariances); Model 4 tested for structural invariance (constrained factor loadings, item intercepts, and factor variances/covariances). Models were
compared by using the chi-square (χ2) [39]. In comparing nested models, we considered changes in CFI,
RMSEA, and SRMR indices as follows: ΔCFI ≤ − 0.02
[40, 41], ΔRMSEA ≤0.015, and ΔSRMR ≤0.03 for tests of
factor loading invariance [40, 42] and ΔCFI ≤-0.01,
RMSEA ≤0.015, and SRMR ≤0.01 for test of scalar invariance [42].
Results
Exploratory factor analysis
We split the dataset (n = 6448) into random training
and test samples. EFA was performed on the training
sample (n = 3879). Results from parallel analysis with
5000 parallel data sets using 95th percentile random
eigenvalue showed that the eigenvalues for the first three
factors exceeded those generated by the random data
sets. Subsequently, a three-factor solution was inspected
in a principal axis factor analysis with varimax rotation
on the 14 items of the ERI-SQ (Table 1).
The EFA revealed that two items (EFF2 “I have many
interruptions and disturbances while preparing for my
exams” and REW4r “ I am not sure whether I can
Page 3 of 7
Table 1 Factor patter matrix for the Italian version of the ERI-SQ
Effort
Reward
EFA
CFA
EFF1
0,73
0,80*
EFF3
0,49
0,56*
Overcommitment
EFA
CFA
REW1
0,71
0,62*
REW3r
0,57
0,56*
REW5
0,52
0,61*
REW2
0,41
0,41*
REW6
0,34
0,36*
EFA
CFA
OC4
0,83
0,82*
OC1
0,60
0,73*
OC5
0,59
0,58*
OC2r
0,54
OC3
0,42
0.61*
0,51*
EFA Explorative Factor Analysis; n = 3224. Loading below ǀ.30ǀ have
been suppressed
CFA Confirmative Factor Analysis; n = 3224; * p < .01
successfully accomplish my university trainings”) loaded
on the same factor. An item analysis revealed that, probably, both items have a general and ambiguous formulation among student population. These items were
therefore deleted from all analyses, as subsequent analyses were conducted with the remaining 12 items. We
then re-conducted a principle axis factor analysis with
varimax rotation. The three factors collectively explained
40.0% of the variance in the three facets. After rotation,
the factors were interpreted as effort, reward and overcommitment.
Confirmatory factor analysis
Based on the results from the EFA, three models were
tested on the test sample (n = 3879; Table 2).
Fit indices for the unidimensional model S-Bχ2(54) =
1833.95, rCFI = .78, rTLI = .73, RMSEA = .109, SRMR =
.084 suggested that the model did not provide a good fit
to the data. We next considered the three-factor model
[21]. Fit indices suggested this model fits the data well,
S-Bχ2(51) = 384.17, rCFI = .96, rTLI = .95, rRMSEA =
.048, SRMR = .033. The χ2 difference test was significant, ΔS-Bχ2(3) = 1449.79, p < .001. All standardized factor loadings were significant.
Internal consistency was .66 for reward, and .78 for
overcommitment. Correlations between the three latent
factors were as follows: −.30 between effort and reward,
.52 between effort and over-commitment, −.33 between
reward and over-commitment. Mean scores were: effort = 3.04 (SD = 0.59), reward = 2.67 (SD = 0.48) and
over-commitment = 2.65 (SD = 0.63). The mean value of
the effort-reward ratio was 1.20 (SD = 0.41).
(2019) 7:68
Portoghese et al. BMC Psychology
Page 4 of 7
Table 2 Fit Indices of the MBI-GS Students from the CFA
Model
S-Bχ2
df
One-factor model
1833.95
54
Three-factor model
384.17
51
ΔS-Bχ2
Δdf
1449,79
p
3
rCFI
rTLI
rRMSEA
SRMR
.78
.73
.109
.084
.96
.95
.048
.033
n = 3224; S-Bχ2 Satorra-Bentler scaled chi-square, rCFI robust Comparative Fit Index, rTLI robust Tucker Lewis Index, RMSEA Robust Root Mean Square Error of
Approximation, SRMR Standardized Root Mean Residual
Measurement invariance
Next, for testing measurement invariance, we conducted
a series of multi-group CFAs across different groups:
health (medicine, nursing, etc.) vs other courses (engineering, economy, etc.) and gender (male vs female).
First, a series of multi-group CFA (MGCFA) was conducted on the health and other university courses. Table 3
shows that configural invariance was supported (Model 0)
as fit the data well across health courses (n = 2551) and
other courses (n = 3897): S-Bχ2(102) = 398.06, CFI = .962,
RMSEA = .045, SRMR = .032. All loadings were significant
(p < .01). We found support for metric invariance (Model
1): ΔCFI = −.001, ΔRMSEA = −.001, and ΔSRMR = −.002.
Next, we did not find support for scalar invariance (Model
2; ΔCFI = − .043; ΔRMSEA = .019, and ΔSRMR = .017). As
full scalar invariance was not supported, we tested for partial invariance. Inspecting modification indices, we found
that three items from the reward subscale (REW2 “I receive the respect I deserve from my fellow students”;
REW3 “I am treated unfairly at university”; and REW6
“Considering all my efforts and achievements, my job promotion prospects are adequate”) and all items from the
over-commitment subscale lacked invariance. However, as
showed on Table 3, partial scalar invariance (Model 2b)
was not supported (ΔCF = −.021, ΔRMSEA = −.012, and
ΔSRMR = .011).
Next, we performed a series of MGCFAs to test the invariance of the ERI-SQ between female and male students (Table 3). We found support for configural
invariance (Model 0) across female (n = 4869) and male
(n = 1579) groups: S-Bχ2(102) = 445.20, CFI = .956,
RMSEA = .049, SRMR = .033. All loadings were significant (p < .01). Next, we found support for metric invariance (Model 1): ΔCFI = − .001, ΔRMSEA = −.002, and
ΔSRMR = .003. Next we found support for scalar invariance (Model 2): ΔCFI = −.009, ΔRMSEA = .003, and
ΔSRMR = .002. Next uniqueness invariance (Model 3)
was supported: ΔCFI = −.005, ΔRMSEA = −.001, and
ΔSRMR = .002. Finally, we found support for structural
invariance (Model 4): ΔCFI = −.010, ΔRMSEA = .004,
and ΔSRMR = .012.
Discussion
The main objective of this study was to examine the factorial
validity and invariance of the Italian version of the ERI-SQ
among Italian university students. Overall, our results confirmed the factorial structure underlying the ERI-SQ, as theorized by Siegrist [25] and reported by Wege and colleagues
[25] in the student version of the ERI. However, in light of
the conclusions drawn from the EFA, to enhance the fit of
the model, we had to delete two items with high cross loadings. The deleted items were problematic in the Wege and
Table 3 Test of invariance of the proposed three-factor structure of the ERI-SQ between health courses (n = 2551) and other courses
(n = 3897) students, and female (n = 4869) vs male students (n = 1579): results of multigroup confirmatory factor analyses
Model
Nested Model
ΔrCFI
ΔrRMSEA
ΔrSRMR
.035
M1-M0
−.001
−.001
.002
.052
M2-M1
−.043
.019
.017
.036
M1-M0
−.001
−.002
.003
.038
M2-M1
−.009
.003
.002
.049
.040
M3-M2
−.005
−.001
.002
.053
.052
M4-M3
−.010
.004
.012
S-Bχ2
df
rCFI
rRMSEA
rSRMR
Health
178.44
51
.959
.046
.032
Non-Health
218.51
51
.963
.041
.032
M0. Configural invariance
398.06
102
.962
.045
.032
M1. Metric invariance
417.12
111
.961
.044
M2. Scalar invariance
822.39
120
.912
.063
Female students
303.65
51
.956
.045
.032
Male students
141.59
51
.955
.047
.036
M0. Configural invariance
445.20
102
.956
.049
.033
M1. Metric invariance
465.98
111
.955
.047
M2. Scalar invariance
547.82
120
.946
.050
M3. Uniqueness invariance
576.19
132
.941
M4. Structural invariance
666.14
135
.931
Health vs other courses
Female vs male students
df degrees of freedom, CFI Comparative Fit Index, RMSEA Root Mean Square Error Of Approximation, SRMR Standardized Root Mean Square Residual
Portoghese et al. BMC Psychology
(2019) 7:68
colleagues [25] study too. Specifically, both items (EFF2 and
REW4) showed a low factor loading in the CFA.
In the Italian sample, using a modified and shortened
version (12 items) of the ERI-SQ, we confirmed the
three factors structure components of the model, showing a satisfactory fit of the data structure with the theoretical concept. In sum, the current findings show that
the ERI-SQ is as a reliable instrument for measuring
academic stress among students.
Finally, as expected, we found support for metric invariance
across gender and university course, health (medicine, nursing, etc.) vs other courses (engineering, economy, etc.).
Mainly, MCFAs confirmed that the three-factor structure of
the ERI-QS is (mostly) invariant across different groups. More
specifically, we found support for parameter equivalence
across gender (structural invariance), but the ERI-SQ was significantly different in health vs other courses. In fact, we were
not able to find scalar invariance, suggesting that items
REW2, REW3, REW6 and all the over-commitment items
vary by academic courses. However, the lack of scalar invariance is a negligible issue for the Italian version of the ERI-SQ.
Implications and limitations
Results from our study showed that the Italian version of the
ERI-SQ-10 provides a psychometrically sound measure of
stress as defined in the ERI theoretical framework. The ERISQ is a brief and easy to administer university student stress
measure. In this sense, using valid and reliable measures of
stress is crucial for Italian university counselling services to
advance in monitoring and understanding the levels of stress
affecting students and how to support them. In this manner
it would be possible to offer appropriate mental health support [43] when students are exposed to lack of reciprocity
between spending high efforts and receiving low rewards
during their student career.
Page 5 of 7
The present study has several limitations. First, data were
obtained from a convenience sample offering reduced
generalizability of our results. However, for the purpose of
the study this sample was deemed appropriate. Second, the
Effort dimension was composed of only two items. A factor
with only two items leads to a CFA that cannot be estimated
unless constraining the model. Future research would overcome this limitation by reevaluating a wider version of the
ERI and adapting other items from the Effort factor as defined in the ERI questionnaire [24]. Third, further research is
also recommended concerning construct and criterion validity [44]. Specifically, we are not able to provide evidence of
convergent validity (how closely the ERI-SQ is related to
other variables and other measures of the same construct),
and discriminant (ERI-SQ does not correlate with other variables that are theoretically not related). Future research
would consider to analyse it by employing a multitraitmultimethod [45]. Finally, as one of the anonymous reviewers correctly pointed out, our study does not offer any
evidence of criterion validity, mainly concurrent validity (the
degree to which a measure correlates concurrently to an external criterion in the same domain [44]. However, according
to Wege and colleagues [25], no studies have provided estimates of these validities for the ERI-SQ. Future research
would provide evidence of it by analyzing the correlation between the ERI-SQ and a theoretically similar measure of student stress. In this sense, concurrent validity is an important
area of future research. Fourth, we did not test for test–retest
reliability. Future research should address these issues. Despite these important limitations, the Italian version of the
ERI-SQ showed satisfactory psychometric properties.
Conclusions
In the present study, we found that the Italian version of
the ERI-QS partially confirms the original version from
Appendix
Table 4 Italian version of the ERI-SQ
EFF1
Sono costantemente sotto pressione a causa dell’eccessivo carico di studio.
EFF3
Il mio studio è diventato sempre più impegnativo.
REW1
Sono trattato dai miei docenti con il rispetto che merito.
REW3r
Sono trattato in modo ingiusto all’università.
REW5
Considerando tutti i miei forzi, ricevo l’apprezzamento che merito.
REW2
Sono trattato dai miei colleghi con il rispetto che merito.
REW6
Considerando i miei sforzi ed i risultati raggiunti, le mie prospettive di lavoro sono adeguate.
OC4
Raramente riesco a non pensare allo studio; è ancora nella mia mente quando vado a dormire
OC1
Appena mi alzo al mattino comincio a pensare ai problemi legati allo studio
OC5
Se rimando qualcosa che avrei dovuto fare nella giornata, non riesco più a dormire per la preoccupazione
OC2r
Quando torno a casa, mi rilasso facilmente e “stacco” dallo studio
OC3
Le persone a me vicine dicono che mi sacrifico troppo per lo studio
Answer format—4-point Likert scale: [1] ‘strongly disagree’, [2] ‘disagree’, [3] ‘agree’, [4] ‘strongly agree’
r Reversed items: [1] ‘strongly agree’, [2] ‘agree’, [3] ‘disagree’, [4] ‘strongly disagree’
Portoghese et al. BMC Psychology
(2019) 7:68
Wege and colleagues [25]. We were able to show satisfactory psychometric properties of the ERI-SQ. Considering
a high prevalence of academic distress among University
students and the limited interventions aimed to reduce
stress [46], universities should employ preventive interventions by measuring and controlling for potentially
harmful psychosocial risk. In this sense, the Italian version
of the ERI-QS presents a valid instrument for measuring
academic stress on Italian-speaking university students.
Abbreviations
CFA: Confirmatory Factor Analysis; CFI: Comparative Fit Index;
EFA: Exploratory Factor Analysis; EFF: Effort; ERI: Effort-Reward Imbalance; ERISQ: Effort-Reward Imbalance Students Questionnaire; MGCFA: Multi-Group
Confirmatory Factor Analysis; ML: Maximum Likelihood; MLM: Robust
Maximum Likelihood; OC: Over-commitment; PAF: Principal Axis Factor;
REW: Rewards; RMSEA: Root Mean Square Error of Approximation;
SD: Standard Deviation; SRMR: Standardized Root Mean Square Residual
Page 6 of 7
3.
4.
5.
6.
7.
8.
9.
10.
Acknowledgements
The authors gratefully acknowledge Prof. Johannes Siegrist and Prof. Nico
Dragano for their careful reading and constructive feedbacks on the final
draft of the manuscript.
Authors’ contributions
IP, MG, FB and MC contributed to the conception and design of the study.
IP, FB and AB contributed to the development procedure of the Italian
version of ERI-SQ, including forward translation and back translation review.
IP and FP contributed to the acquisition of data. IP analyzed the data and
wrote the first draft of the manuscript. MG, and AB supervised the analysis.
SS, ED, GF and MC helped to draft and revise the manuscript. All authors
read and approved the final manuscript.
11.
12.
13.
14.
Funding
This study was not funded.
15.
Availability of data and materials
Raw data pertaining to analyses performed in this study are available
available from the authors upon reasonable request.
16.
Ethics approval and consent to participate
We conducted this study in accordance with (a) ethic committee of the
University of Cagliari, (b) the Declaration of Helsinki in 1995 (as revised in
Edinburgh 2000), and (c) with Italian privacy law (Decree No. 196/2003).
Participation to the study was totally voluntary and written online informed
consent was obtained by clicking on “I accept”.
17.
18.
19.
Consent for publication
Not applicable.
20.
Competing interests
IP is Associate Editor for BMC Psychology. However, this role was not in
competing interest with the review of this manuscript. The other authors
declare that they have no competing interests.
21.
22.
Author details
1
Dipartimento di Scienze Mediche e Sanità Pubblica, Università degli Studi di
Cagliari, SS554 bivio per Sestu, 09042 Monserrato, CA, Italy. 2Department of
Public Health, Erasmus University Medical Center, Rotterdam, Netherlands.
Received: 6 June 2019 Accepted: 3 October 2019
23.
24.
25.
References
1. Stallman HM, Hurst CP. The university stress scale: measuring domains and
extent of stress in university students. Aust Psychol. 2016;51:128–34.
2. Stallman HM. Psychological distress in university students: a comparison
with general population data. Aust Psychol. 2010;45(4):249–57.
26.
Chambel MJ, Curral L. Stress in academic life: work characteristics as
predictors of student well-being and performance. Appl Psychol. 2005;54(1):
135–47.
Chiauzzi E, Brevard J, Thurn C, Decembrele S, Lord S. My student body–
stress: an online stress management intervention for college students. J
Health Commun. 2008;13(6):555–72.
Salanova M, Schaufeli W, Martínez I, Breso E. How obstacles and facilitators
predict academic performance: the mediating role of study burnout and
engagement. Anxiety Stress Copin. 2010;23:53–70.
Shin H, Puig A, Lee J, Lee JH, Lee SM. Cultural validation of the Maslach
burnout inventory for Korean students. Asia Pac Educ Rev. 2011;12(4):633–9.
Behere SP, Yadav R, Behere PB. A comparative study of stress among
students of medicine, engineering, and nursing. Indian J Psychol Med. 2011;
33(2):145–8.
Bergin A, Pakenham K. Law student stress: relationships between academic
demands, social isolation, career pressure, study/life imbalance and adjustment
outcomes in law students. Psychiat, Psych Law. 2015;22(3):388–406.
Rotenstein LS, Ramos MA, Torre M, Segal JB, Peluso MJ, Guille C, et al.
Prevalence of depression, depressive symptoms, and suicidal ideation
among medical students: a systematic review and meta-analysis. Jama.
2016;316(21):2214–36.
Portoghese I, Leiter MP, Maslach C, Galletta M, Porru F, D’Aloja E, Finco G,
Campagna M. Measuring Burnout Among University Students: Factorial
Validity, Invariance, and Latent Profiles of the Italian Version of the Maslach
Burnout Inventory Student Survey (MBI-SS). Front Psychol. 2018;9:2105.
Dusselier L, Dunn B, Wang Y, Shelley IMC, Whalen DF. Personal, health,
academic, and environmental predictors of stress for residence hall
students. J Am Coll Heal. 2005;54(1):15–24.
Storrie K, Ahern K, Tuckett A. A systematic review: students with mental
health problems—a growing problem. Int J Nurs Pract. 2010;16(1):1–6.
Byrd DR, McKinney KJ. Individual, interpersonal, and institutional level factors
associated with the mental health of college students. J Am Coll Heal. 2012;
60(3):185–93.
Keyes CL, Eisenberg D, Perry GS, Dube SR, Kroenke K, Dhingra SS. The
relationship of level of positive mental health with current mental disorders
in predicting suicidal behavior and academic impairment in college
students. J Am Coll Heal. 2012;60(2):126–33.
Salzer MS. A comparative study of campus experiences of college students
with mental illnesses versus a general college sample. J Am Coll Heal. 2012;
60(1):1–7.
Kerr S, Johnson VK, Gans SE, Krumrine J. Predicting adjustment during the
transition to college: alexithymia, perceived stress, and psychological
symptoms. J Coll Student Dev. 2004;45(6):593–611.
Misra R, McKean M. College students’ academic stress and its relation to
their anxiety, time management, and leisure satisfaction. Am J Health Stud.
2000;16:41–51.
Ryan ML, Shochet IM, Stallman HM. Universal online interventions might
engage psychologically distressed university students who are unlikely to
seek formal help. Adv Mental Health. 2010;9(1):73–83.
Shearer A, Hunt M, Chowdhury M, Nicol L. Effects of a brief mindfulness
meditation intervention on student stress and heart rate variability. Int J
Stress Manage. 2016;23(2):232–54.
Dahlin M, Joneborg N, Runeson B. Stress and depression among medical
students: a cross-sectional study. Med Educ. 2005;39(6):594–604.
Dyrbye LN, Thomas MR, Shanafelt TD. Systematic review of depression,
anxiety, and other indicators of psychological distress among US and
Canadian medical students. Acad Med. 2006;81(4):354–73.
Heinen I, Bullinger M, Kocalevent RD. Perceived stress in first year medical
students—associations with personal resources and emotional distress. Bmc
Med Educ. 2017;17:4.
Hilger-Kolb J, Diehl K, Herr R, Loerbroks A. Effort-reward imbalance among
students at German universities: associations with self-rated health and
mental health. Int Arch Occ Env Hea. 2018;91(8):1011–20.
Siegrist J. Adverse health effects of high-effort/low-reward conditions. J
Occup Health Psych. 1996;1(1):27–41.
Wege N, Li J, Muth T, Angerer P, Siegrist J. Student ERI: Psychometric
properties of a new brief measure of effort-reward imbalance among
university students. J Psychosom Res. 2017;94:64–7.
Siegrist J, Starke D, Chandola T, Godin I, Marmot M, Niedhammer I, Peter R.
The measurement of effort–reward imbalance at work: European
comparisons. Soc Sci Med. 2004;58(8):1483–99.
Portoghese et al. BMC Psychology
(2019) 7:68
27. Leineweber C, Wege N, Westerlund H, Theorell T, Wahrendorf M, Siegrist J.
How valid is a short measure of effort–reward imbalance at work? A
replication study from Sweden. Occup Environ Med. 2010;67(8):526–31.
28. Siegrist J, Dragano N, Nyberg ST, Lunau T, Alfredsson L, Erbel R, et al.
Validating abbreviated measures of effort-reward imbalance at work in
European cohort studies: the IPD-work consortium. Int Arch Occ Env Hea.
2014;87(3):249–56.
29. Siegrist J, Wahrendorf M, Goldberg M, Zins M, Hoven H. Is effort-reward
imbalance at work associated with different domains of health functioning?
Baseline results from the French CONSTANCES study. Int Arch Occ Env Hea.
2019;92(4):467–80.
30. Brislin RW. Back-translation for cross-cultural research. J Cross-Cult Psychol.
1970;1(3):185–216.
31. R Core Team. R: A Language and Environment for Statistical Computing.
Vienna: R Foundation for Statistical Computing; 2017. Available at: http://
www.R-project.org/
32. RStudio Team RStudio. Integrated Development. Boston: R. R Studio, Inc;
2015. />33. Revelle W. Psych: procedures for psychological, psychometric, and
personality research. Evanston: Northwestern University; 2017.
34. Rosseel Y. Lavaan: an R package for structural equation modeling and more.
Version 0.5–12 (BETA). J Stat Softw. 2012;48(2):1–36.
35. Brown TA. Confirmatory factor analysis for applied research. New York:
Guilford Publications; 2014.
36. Satorra A, Bentler PM. Corrections to test statistics and standard errors in
covariance structure analysis. In: von Eye A, Clogg CC, editors. Latent
variable analysis: applications for developmental research. Thousand Oaks:
Sage; 1994. p. 399–419.
37. Marsh HW, Hau KT, Wen Z. In search of golden rules: comment on
hypothesis-testing approaches to setting cutoff values for fit indexes and
dangers in overgeneralizing Hu and Bentler's (1999) findings. Struct Equ
Model. 2004a;11(3):320–41.
38. Marsh HW, Wen Z, Hau KT. Structural equation models of latent interactions:
evaluation of alternative estimation strategies and indicator construction.
Psychol Methods. 2004b;9(3):275–300.
39. Bentler PM. Comparative fit indexes in structural models. Psychol Bull. 1990;
107(2):238–46.
40. Meade AW, Johnson EC, Braddy PW. Power and sensitivity of alternative fit
indices in tests of measurement invariance. J Appl Psychol. 2008;93(3):568–92.
41. Rutkowski L, Svetina D. Assessing the hypothesis of measurement
invariance in the context of large-scale international surveys. Educ Psychol
Meas. 2014;74(1):31–57.
42. Chen FF. Sensitivity of goodness of fit indexes to lack of measurement
invariance. Struct Equ Modeling. 2007;14(3):464–504.
43. Roberti JW, Harrington LN, Storch E. Further psychometric support for the
10-item version of the perceived stress scale. J Coll Couns. 2006;9(2):135–47.
44. Cohen RJ, Swerdlik ME. Psychological testing and assessment. 6th ed. New
York: McGraw Hill; 2005.
45. Campbell DT, Fiske DW. Convergent and discriminant validation by the
multitrait-multimethod matrix. Psych Bull. 1959;56(2):81–105.
46. Regehr C, Glancy D, Pitts A. Interventions to reduce stress in university
students: a review and meta-analysis. J Affect Disorders. 2013;148(1):1–11.
Publisher’s Note
Springer Nature remains neutral with regard to jurisdictional claims in
published maps and institutional affiliations.
Page 7 of 7