The impact of early life factors on cognitive function in old age: The Hordaland Health Study (HUSK)
Bạn đang xem bản rút gọn của tài liệu. Xem và tải ngay bản đầy đủ của tài liệu tại đây (373.68 KB, 12 trang )
Skogen et al. BMC Psychology 2013, 1:16
/>
RESEARCH ARTICLE
Open Access
The impact of early life factors on cognitive
function in old age: The Hordaland Health
Study (HUSK)
Jens Christoffer Skogen1,2*, Simon Øverland1,2, A David Smith3, Arnstein Mykletun1,2 and Robert Stewart4
Abstract
Background: Previous studies have shown that adverse conditions during fetal and early life are associated with
lower performance on neurocognitive tests in childhood, adolescence and adult life. There is, however, a paucity in
studies investigating these associations into old age. The aim was to investigate the impact of early life factors on
cognitive function in old age by taking advantage of the potential for a linkage between a community survey and
historical birth records.
Methods: A historical cohort study employing a linkage between a community survey of people aged 72–74 years
with the participants’ birth records (n=346). Early life factors included anthropometric measures taken at birth, birth
complications, parental socioeconomic status, and maternal health status. The main outcome was a z-scored
composite cognitive score, based on test scores from Kendrick Object Learning Test, Trail Making Test A, a modified
version of the Digit Symbol Test, Block Design, a modified version of Mini-Mental State Examination and an
abridged version of the Controlled Oral Word Association Test (COWAT). The separate cognitive tests were also
individually analysed in relation to measures identified at birth.
Results: Higher parental socioeconomic status (SES; based on father’s occupation) was associated with a higher
value on the composite cognitive score (by 0.25 SD, p=0.0146) and higher Digit Symbol and Trail Making Test A
performance. Higher head circumference at birth was associated with higher COWAT and Trail Making Test A
performance. Both higher parental SES and head circumference at birth predicted cognitive function in old age
independently of each other. There were no other consistent associations.
Conclusions: In general we found little evidence for a substantial role of early life factors on late-life cognitive
function. However, there was some evidence for an association with parental SES status and head circumference on
certain cognitive domains.
Keywords: Early life factors, Old age, Cognitive function, Risk factors
Background
Age-associated cognitive decline and mild cognitive impairment in old age is a major public health challenge
(Deary et al. 2009), with the steady increase in life
expectancy seen worldwide (National Institute on Aging
2007). A recent review estimated the prevalence rates of
mild cognitive impairment to be in the range of 14% to
* Correspondence:
1
Faculty of Psychology, Department of Health Promotion and Development,
University of Bergen, Bergen, Norway
2
Division of Mental Health, Department of Public Mental Health, Norwegian
Institute of Public Health, Bergen, Norway
Full list of author information is available at the end of the article
18% for individuals aged 70 years or more (Petersen
et al. 2009), with the prevalence increasing as a function
of age (Golomb et al. 2004). It is difficult to distinguish
non-pathological and pathological cognitive problems in
old age (Deary et al. 2009), but both cognitive decline
and impairment are associated with lower quality of life,
increased disability and neuropsychiatric symptoms, as
well as being associated with higher risk of later dementia and mortality (Deary et al. 2009; Lyketsos et al. 2002;
Bierman et al. 2007).
Cognitive function in later life is associated with factors manifesting across the life course such as mid-life
© 2013 Skogen et al.; licensee BioMed Central Ltd. This is an Open Access article distributed under the terms of the Creative
Commons Attribution License ( which permits unrestricted use, distribution, and
reproduction in any medium, provided the original work is properly cited.
Skogen et al. BMC Psychology 2013, 1:16
/>
cardiovascular and metabolic factors (Breteler et al. 1994;
Gatto et al. 2009), but also early life factors including
educational attainment (Cagney & Lauderdale 2002) and
skeletal growth (Mak et al. 2006). Associations have been
found between lower birth weight and a range of later
adult outcomes including ischemic heart disease, hypertension, obesity and diabetes (Barker 1995; Hales & Barker
2001; Barker et al. 1993; Barker 2004), and given the close
relationship between these conditions and cognitive function, a potential link exists between foetal development
and later cognitive deficits (Whalley et al. 2006). The longterm effects between early life-factors and outcomes later
in the life-course are conceptually referred to as the “fetal
origins of adult disease” and have been thought of as an
essential shift in our understanding of determinants for
health (Skogen & Øverland 2012). From a public health
perspective, the possible link between early life factors and
late life function and disease, may inform our thinking
about when and how to prevent and intervene (Skogen &
Øverland 2012; Kajantie 2008).
Several studies have found that lower birth weight is
associated with later lower intellectual abilities (IQ) and
lower performance on tests of neurocognitive function
in childhood, adolescence and adult life (Sorensen et al.
1997; Shenkin et al. 2001; Richards et al. 2002; Lundgren
et al. 2003; Jefferis et al. 2002). This has not only been
shown in follow-up studies of children born premature
or small for gestational age (Lundgren et al. 2003), but
also for birth weight within normal ranges (Jefferis et al.
2002). Length at birth has also been found to be associated with later intellectual performance (Lundgren et al.
2003). However, despite the potential link of the early
life environment with later function as well as with
metabolic and cardiovascular risk factors, to our knowledge only three studies have investigated the association
between foetal development and cognition in more advanced age for both genders (Martyn et al. 1996; Gale
et al. 2003; Zhang et al. 2009). Two found no evidence
for this (Martyn et al. 1996; Gale et al. 2003), while the
third found that most prenatal factors were associated
with cognitive function in old age in unadjusted models
(Zhang et al. 2009), but these associations were substantially attenuated by adjustment for intervening lifespan
factors (Zhang et al. 2009). Cohorts with data on both
early- and late-life environment are rare, and all three
previous studies were limited in the number of relevant
exposures (Gale et al. 2003), and assessment of cognitive
function (Martyn et al. 1996; Gale et al. 2003), as well as
in their age range (the third study having participants
aged 50–82 years, but most of whom were in the 50–58
year range). Further research is therefore needed (Erickson
et al. 2010), and to the best of our knowledge no studies
have investigated these issues among community-dwelling
individuals over 70 years of age.
Page 2 of 12
Employing a unique linkage between a community survey and a historical birth record archive, we were able to
investigate a range of early life factors in relation to cognitive function on a battery of assessments in community
residents aged 72 to 74 years. Specifically, we investigated
the prospective association between anthropometric measures taken at birth, birth complications, parental socioeconomic status, and maternal health status in relation to
scores on a cognitive test battery in old age.
Methods
Study population
The sampling frame for this study comprised the participants of the old age cohort of the population-based
Hordaland Health Study (HUSK) which has been described in more detail elsewhere (Refsum et al. 2006). In
summary, all residents of Bergen city or neighbouring
areas born during the period of 1925–27 of a previously
established cohort were invited to participate in a general
physical examination and to complete a set of questionnaires on socio-demographic status, general health and
health-related behaviour. HUSK was conducted from 1997
to 1999 as a collaboration between the National Health
Screening Service, the University of Bergen and the local
health services. A random subsample of the attendees in
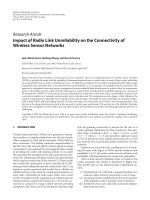
the old age cohort (n=3,341) was also invited to participate in a cognitive examination, with 2,203 (66% of
the attendees) agreeing to participate (Figure 1). Of these,
2,156 had complete data and were included in analyses
presented here.
In the Norwegian Population Registry, all inhabitants
of Norway are registered with a personal identification
number. Using this individual identifier, the names (and
maiden name for females), date of birth, place of birth
and parents’ names (when available) of HUSK participants were retrieved. This information was used to trace
the participants born in Bergen to the birth records from
the public maternity ward (“Fødestiftelsen i Bergen”)
presently stored at the Regional State Archives of Bergen.
In the second decade of the 20th century, about one
quarter of all births in the Bergen area took place in the
official maternity ward (personal communication, State
archivist). The proportion of deliveries taking place at
hospitals increased steeply when the new Women’s Clinic
(“Kvinneklinikken”) was inaugurated in 1926, replacing
the old maternity ward. The pertinent birth records for
the present study were those detailing births between 1st
of January 1925 and 31st of December 1927, and these
records have been employed previously in a similar study
design (Skogen et al. 2013). The records contain detailed
information about the pregnancy, the birth process and
the mother’s health recorded by midwives and obstetricians during the hospital stay. The Women’s Clinic in
question was the main teaching facility for midwifes at the
Skogen et al. BMC Psychology 2013, 1:16
/>
HUSK 1997-99
N=3,341
Cognitive
sub-sample
N=2,203
Complete
cognitive data
N=2,156
Page 3 of 12
socioeconomic status (based on father’s occupation; lower/
higher), and type of payment for the hospital stay (health
insurance/other).
Did not
participate
(N=1,138)
Incomplete
cognitive tests
(N=47)
Not traced
(N=1,810)
Traced sample
N=346
•
•
Traceability: 16.0%
No differences
between the traced
and untraced
identified.
Figure 1 Flowchart describing the establishing of the final
study population.
time, and the records were requisite for the training, and
are therefore considered to be of high quality (Rosenberg
1987). Of the 2,156 participants in the HUSK cognitive
examination, we were able to trace 346, which constituted
the final study sample aged 72–74 years (mean 72.3).
Early life factors – information obtained at birth, 1925–27
The available birth records in the Regional State Archives
of Bergen were viewed and coded blind to all HUSK measures. The following information was abstracted from the
record (directly copying original information unless stated
otherwise): birth weight (kg), birth length (cm), head circumference (cm) at birth, ponderal index (PI; calculated
from weight and length), mother’s pelvic size (the mean
of the interspinous distance, the intercristal distance
and the external conjugate in centimeters). The following binary variables were derived from individual free
text fields: any recorded disease in the mother (yes/no),
family history of coronary heart disease (yes/no) and tuberculosis (TB; yes/no), the state of mother’s teeth (poor/
good), mother’s condition after birth (poor/good), complications during birth (including, but not limitied to,
prolonged labour, abnormal presentation, assisted delivery
of the baby (use of forceps) and episiotomy, uterine rupture, discoloured amniotic fluid, abnormal fetal souffle and
placenta praevia; yes/no), mother’s general somatic state at
discharge (poor/good), marital status (married/unmarried),
Cognitive examination at age 72–74 years of age
HUSK included a cognitive test battery consisting of six
tests. The cognitive tests are in wide use internationally
and have been well validated, including the Norwegian
versions of MMSE and KOLT (Kendrick 1985; Wechsler
1981; Benton & Hamscher 1989; Braekhus et al. 1992;
Reitan 1958; Engedal et al. 1988). Two assessors were
trained over two days to use the test battery (personal communication, Professor Knut Engedal). These assessors were
nurses, and the battery was administered on-site by the
trained nurses at the end of the study’s examination.
Kendrick object learning test (KOLT)
The Kendrick Object Learning Test is designed to assess
episodic memory performance (Kendrick 1985). The maximum score of KOLT is 70, and the range in our study
sample was 6–60.
Trail making test a (TMA)
The Trail Making Test A is a test of visual conceptual
and visuomotor tracking (Reitan 1958). The test involves
both motor speed and attention functions. The score is
equivalent to the time in seconds to complete the items,
and was between 16–154 seconds in our study sample.
For TMA we reversed the scale to ensure that high and
low scores corresponded with the other tests.
Modified version of the digit symbol test (digit symbol)
The modified version of the Digit Symbol Test measures
perceptual and psychomotor speed, focused attention and
visuomotor coordination (Wechsler 1981). In the version
administered, the number of correct matches between
digits and symbols in 30 seconds was recorded. The range
in our study sample was 2–22.
Block design
The Block Design test investigates visuospatial and motor
skills (Wechsler 1981). In the current version 4 of the 10
patterns (pattern 1, 2, 5 and 6) from the full study was included. The maximum score was 16 in this short form.
The range in our study sample was 2–16.
Modified version of the mini-mental state examination (MMS)
The Modified version of the Mini-Mental State Examination is designed to test various aspects of cognitive
function, including orientation, instant recall and memory (Braekhus et al. 1992). It involves orientation to time
and place, naming, repeating, writing, copying, immediate
recall, delayed recall, backward spelling, and performing a
3-stage oral instruction. The modified version consists of
Skogen et al. BMC Psychology 2013, 1:16
/>
12 of the 20 items of the full version and has been shown
to be similar in the ability to identify cognitive impairment
in the elderly (Braekhus et al. 1992). The range of scores in
our study sample was 5–12.
Abridged version of the controlled oral word association
test (COWAT)
The abridged version of the Controlled Oral Word Association Test assesses semantic memory, verbal fluency and
psychomotor speed (Benton & Hamscher 1989). The subjects were required to generate as many words as possible
beginning with the letter “S” within 60 s. The range in our
study sample was 3–34.
Based on these tests a Z-scored (standardized to a mean
of 0 and standard deviation of 1) composite cognitive scale
was constructed by summing the separate standardized
scores for each of the tests. The composite cognitive score
constitutes the main outcome in this study.
Context for the birth cohort
During the late 19th century and early 20th century,
Bergen city expanded geographically, and went from a
semi-rural city to a city with more modern characteristics. Primary industry which had dominated gave way for
an expanding secondary and tertiary industry (Ertresvaag
1982). This change in industry was mostly due to growing production and manufacturing, but also due to an
increase in commerce, shipping and transport, and service sector (Ertresvaag 1982). As a consequence of this,
three social classes began to dominate in Bergen during
the same period, upper (bourgeoisie), middle and lower,
with large differences in income, housing standard and
diet. The upper class was characterised by financers, importers, industry proprietors and wholesale dealers. The
middle class consisted primarily of craftsmen, merchants
and officials, while the lower class comprised regular
worker or artisans (Ertresvaag 1982). During 1925 and
1927 the life expectancy in Norway was approximately
67 years for males, and 74 years for females (Mamelund &
Borgan 1996).
Additional information gathered during follow-up
from HUSK at age 72–74
Potential differences in the distribution of gender, selfreported level of educational attainment and general
health were investigated between the HUSK participants
with birth journal information (N=346) and participants
without (N=1,810). Level of educational attainment was
divided into “compulsory only” (up to ten years) and
“post-compulsory” (11 years or more), while general health
was divided into “poor” and “good”. As APOE gentotype
has been associated with cognitive function (Izaks et al.
2011), information about apoE4-status (presence of any
E4-allele versus absence of E4-allele) was also included
Page 4 of 12
(using nonfasting plasma samples taken during the general
physical examination of HUSK).
Statistical analyses
HUSK participants with traceable birth records were compared to the remainder of the HUSK participants. Bivariate
and age- and gender-adjusted associations were then investigated between exposures and outcomes employing linear
regression models. Our approach was to investigate and
report all associations between exposures and outcomes,
taking into account the number of significant associations that would be expected through chance alone, but
also evaluating the output for any consistency in associations for a given exposure or outcome (Rothman 1990).
For the main analysis, Stata version 11.0 (StataCorp 2010)
was employed. Using the software G*Power version
3.1.3 (www.psycho.uni-duesseldorf.de/abteilungen/aap/
gpower3/) a power analysis indicated that we would be
able to detect a small to medium effect size for continuous
outcomes (a correlation of 0.13), and mean differences
(Cohen’s d of 0.35) at a power of 80% (alpha 0.05) given
our sample size (Cohen 1992). We also investigated the
potential two-way interaction between apoE4-status and
gender for each of the exposures in relation to the composite score, in a post-hoc analysis. Post-hoc analyses
were also performed to investigate whether the effect of
parental SES on cognitive function were independent
of anthropometric measures, as well as whether the effect
of head circumference on cognitive function was independent of parental SES. In sensitivity analyses, we also
explored the effect of separate additional adjustment
for educational attainment and self-rated general
health on those associations found to be significant after
age- and gender-adjustment.
Ethics
The data in HUSK was collected in accordance with ethical standards required by the regional ethical board of
Committees for Medical and Health Research Ethics in
Norway (REC). The permission to collect and store the
data from HUSK was given by the Norwegian Data Inspectorate. All participation in HUSK was voluntary, and
all potential participants received written information
about the project before they met for examination. The
participants gave their written statements of informed
consent, including the specific consents to use information from HUSK in health research and to link this information with other relevant data sources. This specific
study was reviewed and approved by REC.
Results
No systematic differences were found between the HUSK
participants we were able to trace, compared to the
rest of the participants with regards to gender, educational
Skogen et al. BMC Psychology 2013, 1:16
/>
Page 5 of 12
attainment, self-reported health, or the cognitive tests
(Table 1). The sample characteristics of the analysed sample are summarized in Table 2.
Out of the 136 crude associations investigated, only 10
(7.4%) were significant at α=0.05 (Tables 3 and 4), and in
general there were few patterns or consistencies observed
among these significant associations. Head circumference
was positively associated with COWAT and TMA performance but not with the composite score (Table 3).
Parental SES was the only exposure that was associated
with the composite score, where a higher parental SES
was associated with an increased mean score by 0.25
standard deviation (p=0.0146). A higher parental SES was
also associated with a better Digit Symbol and TMA performance (Table 4). Adjusting for age and gender rendered the association between head circumference and
TMA performance non-significant, but the other significant associations were unaltered (Table 3). None of the
other significant associations in our sample were consistent
or indicative of any specific pattern. There was no evidence
for interaction between apoE4-status and any exposures
in relation to the composite cognitive score (p-values for
interaction term ranging from 0.190 to 0.866). We found a
significant interaction between gender and the reported
condition of the mother’s teeth (p=0.008) with an exploratory gender-stratified analysis indicating that reported poor
dentition in the mother was associated with a worse composite cognitive function score in old age, but for female
participants only (mean difference 0.34, p=0.014). In
a post-hoc analysis, a higher parental SES predicted a
higher cognitive function in old age independently of birth
anthropometric measures, and head circumference predicted some aspects of cognitive function in old age independently of parental SES. The results of these post-hoc
analyses were analogous to the age- and gender-adjusted
models (data not shown). For the significant age- and
gender-adjusted associations identified, we carried out
additional separate adjustments for educational attainment and self-rated general health. Adjusting for selfrated health only slightly affected the associations, while
adjusting for educational attainment affected some of the
associations to a larger degree. Specifically, the associations
between paternal SES and cognitive function were substantially weakened (about 60-80% reduction in effect sizes of
point-estimates).
Discussion
In this study investigating the association between the
environment present around birth and cognition in old
age, we found little evidence to support a substantial influence. We only found weak support for any anthropometric measures obtained at birth being predictive of
cognitive function in old age. Specifically, only head circumference was associated with a better performance on
COWAT and TMA in old age in the unadjusted model.
This is contradictory to a previous paper which found
no association between head circumference at birth and
adult cognitive function, but a positive association between adult head circumference and adult cognitive function (Gale et al. 2003). Negative findings were present for
Table 1 Differences on demographics and outcomes between HUSK-participants with birth journal information (N=346)
and participants without (N=1,810)
Proportion/mean with birth
journal information
Proportion/mean without birth
journal information
p-value/Mean difference
(CI95%)*
Gender (% female)
53.8%
55.3%
p=0.599
Education (% post-compulsory)
60.5%a
62.9%b
p=0.429
c
d
Self-reported health (% good)
Composite scoree
70.5%
67.6%
p=0.311
0.08
−0.01
0.09 (−0.02, 0.21)
11.55
11.51
0.04 (−0.05, 0.13)
Separate cognitive testsf
MMS
Digit Symbol
10.60
10.18
0.42 (−0.06, 0.91)
KOLT
35.49
35.17
0.32 (−0.61, 1.25)
COWAT
15.51
15.02
0.49 (−0.15, 1.12)
TMA
55.23
57.67
−2.44(−6.39, 1.50)
Block Design
15.01
15.01
0.00 (−0.26, 0.26)
95% confidence intervals in brackets.
*p-values derived from χ2 and mean difference derived from independent samples t-tests.
a
Available information from N=326.
b
Available information from N=1655.
c
Available information from N=335.
d
Available information from N=1789.
e
Composite score: Z-score of the sum of all cognitive tests (mean: 0, standard deviation: 1).
f
Test-specific raw scores for each cognitive tests (see Methods section for further details).
Skogen et al. BMC Psychology 2013, 1:16
/>
Page 6 of 12
Table 2 Sample characteristics at birth obtained from medical records, and at age 72–74 years obtained from HUSK
N
Mean (SD*)
Proportion (%)
From medical records
Birth weight (kg)
346
3.47 (0.53)
-
Birth length (cm)
346
50.27 (2.11)
-
Head circumference (cm)
344
34.42 (1.70)
-
Ponderal index (weight/height3)
346
2.64 (0.24)
-
Mother’s pelvic size (cm)a
324
26.10 (1.33)
-
Mother’s age
346
29.40 (5.85)
-
Parity (number of births)
346
2.61 (1.95)
-
Gender (% female)
346
-
53.8%
Mother’s condition after birth (% good)
346
-
90.2%
Tuberculosis in family (% no)
346
-
88.7%
CVD in family (% no)
346
-
87.0%
Mother’s appearance (% good)
346
-
76.3%
Complications birth (% no)b
346
-
89.6%
Socioeconomic status (% lower)
346
-
55.8%
Unmarried (% no)
346
-
96.2%
Teeth lower jaw (% good)
335
-
42.1%
Type of payment (% no insurance)
245
-
44.1%
Number of diseases (%≤1)
346
-
69.4%
346
0.08 (0.95)
-
From HUSK at age 72–74 years
Composite scorec
Separate cognitive testd
MMS
346
11.55 (0.85)
-
Digit Symbol
346
10.60 (4.37)
-
KOLT
346
35.49 (7.86)
-
COWAT
346
15.51 (5.40)
-
TMA
346
55.23 (29.06)
-
Block Design
346
15.01 (2.08)
-
*Standard deviation.
a
Mean of the interspinous distance, the intercristal distance and the external conjugate in centimeters.
b
Including, but not limited to, prolonged labour, abnormal presentation assisted delivery of the baby (use of forceps) and episiotomy, uterine rupture, discoloured
amniotic fluid, abnormal fetal souffle and placenta praevia, and combinations of these.
c
Composite score: Z-score of the sum of all cognitive tests (mean: 0, standard deviation: 1).
d
Test-specific raw scores for each cognitive tests (see methods section for further details).
birth complications and maternal health status. We did,
however, find support for an association between higher
parental SES (as measured by father’s occupation) and
global cognitive function in old age in addition to specific
associations with Digit Symbol and TMA test performance, both representing timed tests involving attention,
speed and effortful mental processing. This highlights the
importance of parental SES in relation to some specific
domains of cognitive functioning in old age (Jefferis et al.
2002; Zhang et al. 2009), perhaps relatively independent
of birth size (Zhang et al. 2009), a notion which was confirmed also in our study.
Important strengths of this study included access to
birth records from the 1920s and the possibility to link
this information to a population-based health survey in
the late 1990s, enabling a 72–74 year follow-up. Data
sources for both exposure and outcome status contained
detailed information, and the gathering of information is
unlikely to be biased in any particular direction. Considering the birth records, these were used at the time in
the education of midwives under the supervision of the
head physician with a high level of attention to quality,
and included detailed anthropometric measures, as well
as information about maternal health and circumstances,
Exposures
Level of adjustment
Composite scorea
Separate cognitive testsb
MMS
Digit symbol
KOLT
COWAT
TMA
Block design
Birth weight (kg)
Unadjusted
0.01 (−0.18,0.20)
−0.03 (−0.20,0.14)
−0.12 (−0.99,0.75)
−0.24 (−1.80,1.31)
0.85 (−0.22,1.92)
2.44 (−3.32,8.21)
−0.23 (−0.64,0.19)
+ age/gender
0.02 (−0.17,0.21)
−0.03 (−0.20,0.14)
−0.14 (−1.02,0.73)
0.24 (−1.29,1.78)
0.91 (−0.18,1.99)
2.01 (−3.81,7.84)
−0.26 (−0.68,0.16)
Unadjusted
0.02 (−0.03,0.07)
0.01 (−0.03,0.05)
0.03 (−0.19,0.25)
0.01 (−0.38,0.41)
0.20 (−0.07,0.47)
1.00 (−0.46,2.46)
−0.04 (−0.14,0.07)
+ age/gender
0.03 (−0.02,0.07)
0.01 (−0.03,0.05)
0.03 (−0.20,0.25)
0.22 (−0.17,0.61)
0.23 (−0.04,0.51)
0.94 (−0.56,2.43)
−0.04 (−0.15,0.06)
Unadjusted
0.05 (−0.01,0.11)
0.04 (−0.01,0.09)
−0.06 (−0.33,0.22)
−0.05 (−0.54,0.43)
0.48** (0.15,0.82)
1.95* (0.15,3.76)
0.05 (−0.08,0.18)
Birth length (cm)
Skogen et al. BMC Psychology 2013, 1:16
/>
Table 3 Associations between continuous individual risk factors at birth and continuous cognitive outcomes at age 72–74 years (N=346)
Head circumferencec (cm)
+ age/gender
0.06 (−0.00,0.12)
0.04 (−0.01,0.09)
−0.07 (−0.35,0.21)
0.17 (−0.31,0.65)
0.52 (0.18,0.86)
1.81 (−0.04,3.66)
0.04 (−0.09,0.18)
Unadjusted
−0.11 (−0.54,0.31)
−0.17 (−0.55,0.22)
−0.62 (−2.59,1.34)
−0.64 (−4.17,2.89)
1.15 (−1.28,3.57)
−2.87 (−15.91,10.17)
−0.24 (−1.17,0.70)
+ age/gender
−0.16 (−0.59,0.27)
−0.19 (−0.58,0.19)
−0.74 (−2.73,1.24)
−1.38 (−4.83,2.07)
1.08 (−1.37,3.53)
−3.34 (−16.49,9.82)
−0.27 (−1.21,0.68)
Unadjusted
0.06 (−0.02,0.13)
0.08* (0.01,0.15)
0.16 (−0.20,0.53)
0.18 (−0.48,0.83)
0.38 (−0.06,0.82)
1.00 (−1.41,3.42)
−0.12 (−0.29,0.06)
+ age/gender
0.05 (−0.03,0.13)
0.08* (0.00,0.15)
0.14 (−0.23,0.51)
0.22 (−0.43,0.86)
0.39 (−0.06,0.83)
0.75 (−1.70,3.21)
−0.14 (−0.32,0.03)
Unadjusted
0.01 (−0.01,0.02)
0.01 (−0.00,0.03)
0.02 (−0.06,0.10)
0.04 (−0.10,0.18)
−0.01 (−0.11,0.09)
−0.19 (−0.71,0.34)
0.00 (−0.04,0.04)
+ age/gender
0.00 (−0.01,0.02)
0.01 (−0.00,0.03)
0.02 (−0.06,0.10)
0.02 (−0.12,0.16)
−0.01 (−0.11,0.09)
−0.16 (−0.69,0.36)
0.00 (−0.04,0.04)
**
3
Ponderal index (weight/height )
Mother’s pelvic sized, e (cm)
Mother’s age (years)
Parity (number of births)
Unadjusted
−0.02 (−0.07,0.03)
0.03 (−0.02,0.07)
−0.14 (−0.37,0.10)
0.12 (−0.31,0.55)
−0.10 (−0.39,0.19)
−1.01 (−2.59,0.57)
−0.11 (−0.22,0.01)
+ age/gender
−0.02 (−0.07,0.03)
0.02 (−0.02,0.07)
−0.14 (−0.38,0.10)
0.05 (−0.37,0.47)
−0.11 (−0.40,0.19)
−0.98 (−2.57,0.60)
−0.11 (−0.22,0.01)
Page 7 of 12
Linear regression models, unstandardized coefficients.
95% confidence intervals in parentheses.
Significant associations in bold.
*
p < 0.05, ** p < 0.01, *** p < 0.001.
a
Z-score of the sum of all cognitive tests (mean: 0, standard deviation: 1).
b
Test-specific raw scores for each cognitive tests (see Methods section for further details). MMS: range (5, 12); Digit Symbol: range (2, 22); KOLT: range (6, 60); COWAT: range (3, 34); TMA: range (-154,-14; reversed);
Block Design: range (2, 16).
c
N=344.
d
N=324.
e
Mean of the interspinous distance, the intercristal distance and the external conjugate in centimeters.
Exposures
Level of
adjustment
Separate cognitive testsb
Composite
scorea
MMS
Digit symbol
KOLT
COWAT
TMA
Block design
Mother’s condition, good (vs poor)
Unadjusted
0.17 (−0.17,0.51)
0.09 (−0.21,0.40)
0.83 (−0.72,2.39)
0.74 (−2.05,3.53)
2.26* (0.35,4.16)
−2.27 (−12.61,8.06)
−0.25 (−0.99,0.49)
+ age/gender
0.22 (−0.12,0.56)
0.13 (−0.18,0.43)
0.99 (−0.58,2.57)
1.20 (−1.55,3.96)
2.39* (0.45,4.33)
−1.53 (−12.02,8.95)
−0.21 (−0.96,0.55)
Unadjusted
−0.17 (−0.49,0.15)
−0.07 (−0.35,0.22)
−0.04 (−1.51,1.42)
−2.02 (−4.64,0.60)
−1.42 (−3.23,0.38)
−1.90 (−11.63,7.83)
0.04 (−0.66,0.74)
+ age/gender
−0.16 (−0.48,0.15)
−0.07 (−0.35,0.22)
−0.03 (−1.50,1.44)
−1.89 (−4.43,0.66)
−1.41 (−3.22,0.40)
−1.90 (−11.63,7.83)
0.04 (−0.66,0.74)
Family history of TB, no (vs yes)
CVD, family, no (vs yes)
Unadjusted
−0.09 (−0.39,0.21)
−0.10 (−0.37,0.16)
−0.12 (−1.50,1.25)
−0.71 (−3.18,1.76)
0.35 (−1.35,2.05)
−6.82 (−15.94,2.29)
0.09 (−0.57,0.75)
+ age/gender
−0.08 (−0.38,0.22)
−0.09 (−0.36,0.18)
−0.04 (−1.43,1.35)
−1.12 (−3.54,1.30)
0.34 (−1.39,2.06)
−6.04 (−15.26,3.17)
0.15 (−0.52,0.81)
Unadjusted
0.13 (−0.10,0.37)
−0.09 (−0.30,0.12)
1.06 (−0.02,2.15)
0.52 (−1.44,2.47)
0.65 (−0.70,1.99)
4.76 (−2.46,11.97)
0.11 (−0.41,0.63)
+ age/gender
0.12 (−0.11,0.36)
−0.10 (−0.31,0.11)
1.03 (−0.06,2.11)
0.51 (−1.40,2.41)
0.64 (−0.71,1.99)
4.44 (−2.80,11.68)
0.09 (−0.43,0.61)
Unadjusted
0.25 (−0.07,0.58)
−0.12 (−0.42,0.17)
1.23 (−0.28,2.74)
1.11 (−1.62,3.83)
0.13 (−1.74,2.00)
9.92 (−0.10,19.94)
0.88* (0.16,1.60)
+ age/gender
0.28 (−0.05,0.60)
−0.11 (−0.41,0.19)
1.31 (−0.21,2.83)
1.18 (−1.47,3.83)
0.15 (−1.74,2.03)
10.49 (0.44,20.54)
0.92* (0.20,1.64)
Unadjusted
0.25* (0.05,0.45)
0.12(−0.06,0.30)
1.16* (0.23,2.08)
1.28 (−0.39,2.94)
0.72 (−0.43,1.87)
6.78* (0.63,12.93)
0.08 (−0.36,0.53)
Skogen et al. BMC Psychology 2013, 1:16
/>
Table 4 Associations between dichotomous familial risk factors at birth and continuous cognitive outcomes at age 72–74 years (N=346)
Mother’s appearance, good (vs poor)
Complications, no (vs yes)c
*
Socioeconomic status, higher (vs lower)
*
*
*
+ age/gender
0.25 (0.05,0.45)
0.12 (−0.06,0.30)
1.16 (0.23,2.08)
1.24 (−0.38,2.87)
0.72 (−0.43,1.87)
6.82 (0.66,12.97)
0.09 (−0.36,0.53)
Unmarried, no (vs yes)
Unadjusted
−0.06 (−0.59,0.46)
−0.06 (−0.54,0.41)
−0.73 (−3.17,1.70)
−1.33 (−5.70,3.04)
2.68 (−0.31,5.68)
2.32 (−13.85,18.50)
−0.87 (−2.02,0.29)
+ age/gender
−0.12 (−0.65,0.41)
−0.10 (−0.57,0.38)
−0.88 (−3.34,1.57)
−1.88 (−6.16,2.39)
2.65 (−0.38,5.67)
1.56 (−14.73,17.86)
−0.93 (−2.09,0.24)
Unadjusted
0.06 (−0.14,0.26)
−0.09 (−0.26,0.09)
0.24 (−0.71,1.20)
2.25** (0.56,3.93)
0.10 (−1.08,1.28)
−0.78 (−6.96,5.40)
0.06 (−0.40,0.52)
+ age/gender
0.09 (−0.11,0.29)
−0.08 (−0.25,0.10)
0.29 (−0.67,1.25)
2.75 (1.11,4.39)
0.15 (−1.04,1.35)
−0.70 (−6.92,5.53)
0.06 (−0.40,0.52)
Unadjusted
0.15 (−0.10,0.39)
0.17 (−0.07,0.41)
1.33* (0.22,2.44)
0.38 (−1.56,2.32)
−0.30 (−1.63,1.02)
−0.29 (−7.44,6.86)
0.07 (−0.45,0.59)
+ age/gender
0.14 (−0.11,0.39)
0.17 (−0.07,0.41)
1.30* (0.19,2.41)
0.30 (−1.61,2.20)
−0.32 (−1.65,1.01)
−0.31 (−7.48,6.86)
0.06 (−0.46,0.59)
d
Teeth, lower jaw, good (vs poor)
**
Type of payment, insurance (vs other)e
Page 8 of 12
Number of diseases, ≤1 (vs >1)
Unadjusted
0.00 (−0.22,0.22)
−0.07 (−0.27,0.12)
0.42 (−0.58,1.43)
−0.53 (−2.33,1.27)
0.32 (−0.92,1.56)
1.91 (−4.77,8.58)
−0.12 (−0.60,0.36)
+ age/gender
−0.01 (−0.23,0.21)
−0.08 (−0.27,0.12)
0.39 (−0.62,1.40)
−0.54 (−2.29,1.22)
0.32 (−0.93,1.56)
1.63 (−5.06,8.32)
−0.14 (−0.62,0.34)
Linear regression models, unstandardized coefficients.
95% confidence intervals in parentheses.
Significant associations in bold.
*
p < 0.05, ** p < 0.01, *** p < 0.001.
a
Z-score of the sum of all cognitive tests (mean: 0, standard deviation: 1).
b
Test-specific raw scores for each cognitive tests (see Methods section for further details). MMS: range (5, 12); Digit Symbol: range (2, 22); KOLT: range (6, 60); COWAT: range (3, 34); TMA: range (-154,-14; reversed);
Block Design: range (2, 16).
c
Including, but not limited to, prolonged labour, abnormal presentation assisted delivery of the baby (use of forceps) and episiotomy, uterine rupture, discoloured amniotic fluid, abnormal fetal souffle and placenta
praevia, and combinations of these.
d
N=335.
e
N=245.
Skogen et al. BMC Psychology 2013, 1:16
/>
Table 4 Associations between dichotomous familial risk factors at birth and continuous cognitive outcomes at age 72–74 years (N=346) (Continued)
Page 9 of 12
Skogen et al. BMC Psychology 2013, 1:16
/>
the birth process and the early post-natal period. Another strength, is that the cognitive examination part of
the HUSK study included cognitive tests investigating
several different cognitive domains ranging from episodic memory, executive function visuospatial and
motor skills and verbal fluency.
A key limitation is that a relatively small proportion of
the HUSK sample could be traced to their birth records.
There are several potential reasons for this: the birth records were only available for a subgroup as not everyone
who participated in HUSK was born in the Bergen area,
and some were born at home or at other hospitals.
Based on a conservative estimate, at least one-third of
the HUSK sample would not be within the catchment
area of the public maternity ward at the time of birth.
The sample that was traced was representative of the
participants in the HUSK cognitive examination. The results of the analysis are therefore likely to generalize to
others of this generation and residence. However, it cannot be assumed that the traced participants were representative of people born in the location from which the
early life records were taken. In particular, the representativeness of the birth cohort in HUSK might well have been
influenced by intervening migration and survival effects
because of the long follow-up. Healthy survivor effects
(Baillargeon & Wilkinson 1999) or non-participation bias
(Knudsen et al. 2010) are also possible. Negative findings
could have resulted from inaccuracies in the measurement
of either exposures or outcomes; for example, information
on maternal health and family circumstances was derived
from relatively crude measures. However, despite this, the
similarly crude measure of parental SES included provided
the most consistent significant associations identified with
the outcomes. As previously described, three different social classes dominated Bergen during the time when the
participants were born. Based on information from paternal occupational status, however, most of the participants
in our study sample were from middle to lower socioeconomic strata with the occupation of the fathers varying
from unskilled manual workers to teachers and general
managers. This should be considered as a characteristic of
the analysed sample when interpreting findings. Given the
high number of associations tested, Type I errors cannot
be ruled out, although we chose to focus on patterns of significant associations rather than significant associations per
se. Differential bias arising from measurement is unlikely
since reporting in HUSK is unlikely to be influenced by
birth circumstances and recording of birth circumstances
was carried out blind to all HUSK measures. The low
traceability and small sample size constitute central limitations to our study, and warrants caution with regards to
the precision of our estimates, and the interpretation and
generalisability of the present study. Also of note, the limited size of the sample did not provide sufficient statistical
Page 10 of 12
power to specifically investigate low (<2.5 kg) or high
(>4.5 kg) birth weight, or any influence of rare birth complications on cognitive function in old age, such as obstruction, foetal hypoxia or abnormally low birth weight.
Interpretation of our findings
We found little evidence to support a substantial association between intrauterine or birth environment and
cognitive function in old age in general. The only anthropometric measure which to a certain degree predicted cognition in old age was head circumference, and
parental SES was the only exposure which was associated with the composite cognitive score. Both a higher
head circumference and SES seemed to predict a higher
cognitive function in old age independently of each other.
One potential explanation for this is that early SES and
head circumference are predictors of two different aspects of later cognitive function (Stern 2002). The association between SES and later cognitive function may
represent cognitive reserve, while the association between head circumference and later cognitive function
may represent brain reserve, both of which are relevant
concepts for understanding cognitive function and vulnerability to cognitive impairments in old age (Stern
2002). In this respect, it also interesting that adjusting for
educational attainment substantially weakened the associations between paternal SES and cognitive function in
old age, suggesting that these associations might be substantially mediated through education. On the other
hand, self-rated health reported in later life did not appear to influence these associations meaningfully. Further
specific causal pathway modeling was felt to be beyond
the scope of this study and not warranted by the largely
negative associations of interest.
The lack of a substantial association between intrauterine or birth environment and cognitive function in
old age, may be also be a reflection of a diminished impact of these early factors as other influences comes into
play across the lifespan (Zhang et al. 2009). Both birth
weight and socioeconomic status have been found to be
associated with cognitive function in childhood (Shenkin
et al. 2001; Jefferis et al. 2002), although socioeconomic
status and postnatal influences have been suggested to
be more important than prenatal factors (Jefferis et al.
2002; Erickson et al. 2010), similar to our own finding of
the importance of parental SES. Other studies have also
found that social disadvantage and early life stressors are
related to cognitive function in later life (Mak et al.
2006; Nguyen et al. 2008; Fors et al. 2009), and it is generally accepted that childhood SES is an important predictor for later cognitive function (Mak et al. 2006;
Hackman & Farah 2009), and cognitive reserve (Stern
2002). Even though anthropometric measures obtained at
birth did not predict cognitive function later in life, it is
Skogen et al. BMC Psychology 2013, 1:16
/>
possible that other factors mitigated these initial differences
and reduced or eliminated their influence in later adult life
(Zhang et al. 2009). These may include later nutrition, education and occupational status (Stern 2002).
Conclusion
In conclusion, we found little evidence to support a substantial association between intrauterine or birth environment and cognitive function in old age in general. There
were, however, some findings relating socioeconomic status and head circumference at birth and cognitive functioning in old age that warrants further investigation.
Competing interests
All authors declare that they have no competing interests.
Authors’ contributions
JCS, AM and RS were responsible for the conception this study, and the
study design was developed by JCS, AM and RS. Analyses were carried out
by JCS under supervision of RS and SØ, and manuscript preparation was led
by JCS in cooperation with RS, SØ and ADS. JCS, SØ, ADS, AM and RS were
all involved in the interpretation of data, drafting the article and approval of
the final manuscript. JCS is the guarantor for the study. All authors read and
approved the final manuscript.
Acknowledgments
The guarantor (JCS) takes full responsibility for the data, the analyses, and
interpretation, and the conduct of the research. The guarantor has also full
access to the data, and have the right to publish any and all data separate
and apart from any sponsor.
Author details
1
Faculty of Psychology, Department of Health Promotion and Development,
University of Bergen, Bergen, Norway. 2Division of Mental Health,
Department of Public Mental Health, Norwegian Institute of Public Health,
Bergen, Norway. 3Department of Pharmacology, University of Oxford, Oxford,
UK. 4King’s College London (Institute of Psychiatry), London, UK.
Received: 22 March 2013 Accepted: 12 September 2013
Published: 16 September 2013
References
Baillargeon, J, & Wilkinson, GS. (1999). Characteristics of the healthy survivor effect
among male and female Hanford Workers. American Journal of Industrial
Medicine, 35, 343–347.
Barker, DJP. (1995). Fetal origins of coronary heart-disease. British Medical Journal,
311(6998), 171–174.
Barker, DJP. (2004). The developmental origins of adult disease. Journal of the
American College of Nutrition, 23(suppl 6), 588–595.
Barker, DJP, Hales, CN, Fall, CHD, Osmond, C, Phipps, K, & Clark, PMS. (1993).
Type 2 (non-insulin-dependent) diabetes mellitus, hypertension and
hyperlipidaemia (syndrome X): relation to reduced fetal growth.
Diabetologia, 36, 62–67.
Benton, A, & Hamscher, K. (1989). Multilingual Aphasia Examination. Iowa: AJA
Associates.
Bierman, EJM, Comijs, HC, Jonker, C, & Beekman, ATF. (2007). Symptoms of
anxiety and depression in the course of cognitive decline. Dementia and
Geriatric Cognitive Disorders, 24(3), 213–219.
Braekhus, A, Laake, K, & Engedal, K. (1992). The mini-mental state examination:
identifying the most efficient variables for detecting cognitive impairment in
the elderly. Journal of American Geriatrics Society, 40, 1139–1145.
Breteler, MMB, Claus, JJ, Grobbee, DE, & Hofman, A. (1994). Cardiovascular disease
and distribution of cognitive function in elderly people: the Rotterdam study.
BMJ, 308(6944), 1604–1608.
Cagney, KA, & Lauderdale, DS. (2002). Education, wealth, and cognitive function
in later life. The Journals of Gerontology. Series B, Psychological Sciences and
Social Sciences, 57(2), 163–172.
Cohen, J. (1992). A power primer. Psychological Bulletin, 112(1), 155–159.
Page 11 of 12
Deary, IJ, Corley, J, Gow, AJ, Harris, SE, Houlihan, LM, Marioni, RE, et al. (2009).
Age-associated cognitive decline. British Medical Bulletin, 92(1), 135–152.
Engedal, K, Haugen, P, Gilje, K, & Laake, P. (1988). Efficacy of short mental tests in
the detection of mental impairment in old age. Comprehensive Gerontology.
Section A, 2(2), 87–93.
Erickson, K, Kritz-Silverstein, D, Wingard, DL, & Barrett-Connor, E. (2010). Birth
weight and cognitive performance in older women: the Rancho Bernardo
study. Archives of Womens Mental Health., 13, 141–146.
Ertresvaag, E. (1982). Bergen bys historie III, Et bysamfunn i utvikling 1800–1920
[The history Bergen city (volume 3). A urban society in development 1800–1920].
Bergen: Universitetsforlaget.
Fors, S, Lennartsson, C, & Lundberg, O. (2009). Childhood living conditions,
socioeconomic position in adulthood, and cognition in later life: Exploring
the associations. The Journals of Gerontology. Series B, Psychological Sciences
and Social Sciences, 64B(6), 750–757.
Gale, CR, Walton, S, & Martyn, CN. (2003). Foetal and postnatal head growth and
risk of cognitive decline in old age. Brain, 126(10), 2273–2278.
Gatto, NM, Henderson, VW, St John, JA, McCleary, C, Hodis, HN, & Mack, WJ.
(2009). Metabolic syndrome and cognitive function in healthy middle-aged
and older adults without diabetes. Ageing, Neuropscyhology, and Cognition.,
15(5), 627–641.
Golomb, J, Kluger, A, & Ferris, SH. (2004). Mild cognitive impairment: historical
development and summary of research. Dialogues in Clinical Neuroscience,
6(4), 351–369.
Hackman, DA, & Farah, MJ. (2009). Socioeconomic status and the developing
brain. Trends in Cognitive Science, 13(2), 65–73.
Hales, CN, & Barker, DJP. (2001). The thrifty phenotype hypothesis. British Medical
Bulletin, 60, 5–20.
Izaks, GJ, Gansevoort, RT, van der Knaap, AM, Navis, G, Dullaart, RPF, & Slaets, JPJ.
(2011). The association of APOE genotype with cognitive function in persons
aged 35 years or older. PLoS ONE, 6(11), e27415.
Jefferis, B, Power, C, & Hertzman, C. (2002). Birth weight, childhood socioeconomic
environment, and cognitive development in the 1958 British birth cohort study.
BMJ, 325, 305.
Kajantie, E. (2008). Early-life events. Effects on aging. Hormones., 7(2), 101–113.
Kendrick, D. (1985). Kendrick Cognitive Tests for the Elderly. Windsor: NFER-NELSON
Publishing Company Ltd.
Knudsen, AK, Hotopf, M, Skogen, JC, Øverland, S, & Mykletun, A. (2010). The health
status of nonparticipants in a population-based health study: The Hordaland
Health Study. American Journal of Epidemiology, 172(11), 1306–1314.
Lundgren, E, Cnattingius, S, Jonsson, B, & Tuvemo, T. (2003). Birth characteristics
and different dimensions of intellectual performance in young males: a
nationwide population-based study. Acta Paediatrica, 92, 1138–1143.
Lyketsos, CG, Lopez, O, Jones, B, Fitzpatrick, AL, Breitner, J, & DeKosky, S. (2002).
Prevalence of neuropsychiatric symptoms in dementia and mild cognitive
impairment. JAMA: The Journal of the American Medical Association, 288(12),
1475–1483.
Mak, Z, Kim, JM, & Stewart, R. (2006). Leg length, cognitive impairment and
cognitive decline in an African-Caribbean population. International Journal of
Geriatric Psychiatry, 21(3), 266–272.
Mamelund, S-E, & Borgan, J-K. (1996). Kohort- og periodedødelighet i Norge
1846–1994 [Cohort and Period Mortality in Norway 1846–1994]. Oslo:
Statistics Norway.
Martyn, CN, Gale, CR, Sayer, AA, & Fall, C. (1996). Growth in utero and cognitive
function in adult life: follow up study of people born between 1920 and
1943. BMJ, 312, 1393–1396.
National Institute on Aging. (2007). Why population aging matters: A global perspective.
Bethesda: National Institutes of Health (National Institute on Aging).
Nguyen, CT, Couture, M-C, Alvarado, BE, & Zunzunegui, M-V. (2008). Life course
socioeconomic disadvantage and cognitive function among the elderly
population of seven capitals in Latin America and the Caribbean. Journal of
Aging and Health, 20(3), 347–362.
Petersen, RC, Roberts, RO, Knopman, DS, Bradley, FB, Geda, YE, Ivnik, RJ, et al.
(2009). Mild cognitive impairment: Ten years later. Archives of Neurology,
66(12), 1447–1455.
Refsum, H, Nurk, E, Smith, AD, Ueland, PM, Gjesdal, CG, Bjelland, I, et al. (2006).
The Hordaland homocysteine study: a community-based study of
homocysteine, its determinants, and associations with disease. Journal of
Nutrition, 136(6), 1731–1740.
Reitan, RM. (1958). Validity of the trail making test as an indicator of organic brain
damage. Perceptual and Motor Skills, 8, 271–276.
Skogen et al. BMC Psychology 2013, 1:16
/>
Page 12 of 12
Richards, M, Hardy, R, Kuh, D, & Wadsworth, ME. (2002). Birthweight, postnatal
growth and cognitive function in a national UK birth cohort. International
Journal of Epidemiology, 31(2), 342–348.
Rosenberg, M. (1987). Inntrykk fra arbeid med de gamle fødejournalene
[Impression after working with the historical birth records]. In K Haram & P
Bergsjø (Eds.), Jordmorutdanning og kvinneklinikk : tilbakeblikk og status etter
125 år i Bergen: jubileumsskrift for Bergen jordmorhøgskole og Kvinneklinikken.
Bergen: Kvinneklinikken, Haukeland Sykehus.
Rothman, KJ. (1990). No adjustments are needed for multiple comparisons.
Epidemiology, 1(1), 43–46.
Shenkin, SD, Starr, JM, Pattie, A, Rush, MA, Whalley, LJ, & Deary, IJ. (2001). Birth
weight and cognitive function at age 11 years: the Scottish Mental Survey
1932. Archives of Disease in Childhood, 85, 189–197.
Skogen, JC, & Øverland, S. (2012). The fetal origins of adult disease: a narrative
review of the epidemiological literature. JRSM Short Reports., 2012, 3(8).
Skogen, JC, Stewart, R, Mykletun, A, Knapstad, M, & Overland, S. (2013). An
investigation of factors identified at birth in relation to anxiety and
depression in old age: the Hordaland Health Study (HUSK). BMC Psychiatry,
13(1), 136.
Sorensen, HT, Sabroe, S, Olsen, J, Rothman, KJ, Gillman, MW, & Fischer, P. (1997).
Birth weight and cognitive function in young adult life: historical cohort
study. British Medical Journal, 315(7105), 401–403.
StataCorp. (2010). Statistical Software: Release 11.0. College Station, TX: Stata
Corporation.
Stern, Y. (2002). What is cognitive reserve? Theory and research application
of the reserve concept. Journal of International Neuropsychological
Society, 8(3), 448–460.
Wechsler, D. (1981). Wechsler Adult Intelligence Scale - Revised. New York: The
Psychological Corporation.
Whalley, LJ, Dick, FD, & McNeill, G. (2006). A life-course approach to the aetiology
of late-onset dementias. The Lancet Neurology, 5(1), 87–96.
Zhang, ZX, Plassman, BL, Xu, Q, Zahner, GFP, Wu, B, Gai, MY, et al. (2009). Lifespan
influences on mid- to late-life cognitive function in a Chinese birth cohort.
Neurology, 73, 186–194.
doi:10.1186/2050-7283-1-16
Cite this article as: Skogen et al.: The impact of early life factors on
cognitive function in old age: The Hordaland Health Study (HUSK). BMC
Psychology 2013 1:16.
Submit your next manuscript to BioMed Central
and take full advantage of:
• Convenient online submission
• Thorough peer review
• No space constraints or color figure charges
• Immediate publication on acceptance
• Inclusion in PubMed, CAS, Scopus and Google Scholar
• Research which is freely available for redistribution
Submit your manuscript at
www.biomedcentral.com/submit