Building agricultural information system in An Giang province
Bạn đang xem bản rút gọn của tài liệu. Xem và tải ngay bản đầy đủ của tài liệu tại đây (1.51 MB, 11 trang )
An Giang University Journal of Science – 2019, Vol. 6, 89 – 99
BUILDING AGRICULTURAL INFORMATION SYSTEM
IN AN GIANG PROVINCE
Tran Thai Binh1, Pham Duy Tien2, Ho Lam Truong1
Nguyen Ngoc Phuong Thanh1, Do Thanh Long1
Ho Chi Minh City Space Technology Application Center, Vietnam National Space Center
An Giang University
1
2
Information:
Received: 05/09/2018
Accepted: 02/12/2018
Published: 03/2019
Keywords:
Agricultural information system,
An Giang, Open source
WebGIS, Interactive map
ABSTRACT
An Giang is one of the leading provinces in agricultural production in the
Mekong Delta, Vietnam. However, in recent years, the effects of climate
change and water security in the Mekong River have been major challenges
for An Giang's agriculture. Building an information system for agriculture
based on GIS is a suitable direction. These systems include applications
using WebGIS technology, providing online data management and updating
functions. Display function on WebGIS allows showing information with
interactive maps and interactive time-series chart. In addition, a mobile
application was developed to monitor the disease situation. Applications are
built into an agricultural portal that helps to share useful information with
managers, businesses, and farmers.
1. INTRODUCTION
personal computer that is not optimal for
managing, sharing and publishing. Especially,
during the "restructuring of the agricultural
sector", leaders and managers need to know
spatial-temporal changes in agriculture to make
quick and reasonable decisions.
An Giang is a province with the highest potential
for agricultural production in the Mekong Delta
and one of the “key national food producing
provinces” (Southwest Steering Committee,
2016). However, climate change and water
security in the Mekong Basin are challenges for
An Giang’s agriculture. Therefore, “the
modernization of agriculture” and “restructuring
of the agricultural sector” are the priority policies
for sustainable development of An Giang’s
agriculture. Changes in agriculture in recent years
have increased the need for data management.
However, there are some limitations on storage
and management of agricultural data. Agricultural
data are stored by paper or digital files on a
With the development of information technology
and geographic information systems (GIS),
especially open source WebGIS technology has
allowed building an online and flexible
application that supports for data collection, data
management, and data mining. The development
of sustainable agriculture is not only a plan of
developing countries but of the whole world as
well. At present, many countries have focused on
the development of an agricultural information
89
An Giang University Journal of Science – 2019, Vol. 6, 89 – 99
system that provides useful information to the
public as well as a decision support system.
Thereby, the agricultural information system
contributes to the increase in agricultural
productivity in the context of climate change (Le
et al., 2013; ESRI, 2009; ESRI, 2013).
information system. The system consists of
components: WebGIS application base on an
interactive map and interactive time-series chart
technology; data management application for
editing or updating data on the client computer; a
mobile application for collecting data such as
diseases, water quality, salinity intrusion (Figure
1).
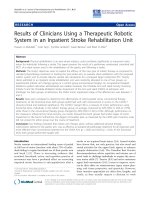
Based on the open source platform, this paper
presents an approach to building an agriculture
Figure 1. An Giang agricultural information system
The agricultural production information and
related information such as meteorology,
hydrology, soil and especially information on the
agricultural disease are provided by WebGIS
interface. An agricultural information system is
an indispensable tool for management, planning
and agricultural structural reform.
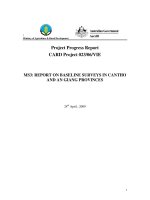
-
Data on agriculture: cultivation data, livestock
data, and aquaculture data.
-
Data on natural conditions: meteorological
data, hydrographic data; soil map; agriculture
disease data.
-
Data on socio-economic: land use map; the
location of agricultural production units
(cooperatives),
agricultural
market
information.
-
Base map: data on administrative boundaries,
traffic, hydrography, topography, satellite
images.
2. MATERIALS AND METHODS
2.1
Materials
The database includes data on agriculture, natural,
socio-economic and base map (Figure 2):
90
An Giang University Journal of Science – 2019, Vol. 6, 89 – 99
Figure 2. Database catalog
2.2 Methods
Spatial data is collected in various formats such
as AutoCAD, MapInfo, MicroStation, Shapefile.
These data are converted into the unified format
and coordinate system by QGIS software. QGIS
is an open-source geographic information system
application that supports viewing, editing, and
analysis of spatial data. In this study, data use
Vietnam Coordinate System for An Giang
province (VN2000 - central meridian 104°45').
Data is stored based on the relational model in
PostgreSQL. Spatial data was imported to
PostgreSQL by PostGIS extension and QGIS
software.
a) Method of data collection
Secondary data was collected from a variety of
sources to build a database for agricultural
management. Agricultural data from 2010 to
2016 was collected directly from An Giang
Department
of
Agriculture
and
Rural
Development. In addition, soil map was collected
from An Giang University, hydro-meteorological
data
collected
from
the
An
Giang
Hydrometeorological Station, base map and
current land use map collected from the An Giang
Department of Natural Resources and
Environment.
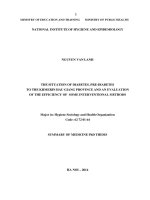
c) WebGIS technology
This system uses WebGIS open source
technology. It consists of three levels (Figure 3):
b) Methods of transformation, standardization
and editing data
91
An Giang University Journal of Science – 2019, Vol. 6, 89 – 99
the database, the application server, and the user
interface.
used the open source map server - GeoServer to
provide Web Map Service (WMS) (Giuliani et al.
2013; Loechel & Schmid, 2012).
At the database level, this WebGIS used
PostgreSQL as database management system.
PostgreSQL is an open source object-relational
database system that provides the full
functionality of a database management system,
including concurrency, integrity, security,
backup, and recovery, especially supporting
spatial data (Nair et al., 2015; Shukla et al.,
2016).
At the user interface level, web browsers (Google
Chrome, Internet Explorer, Mozilla Firefox, etc.)
on the client computer can run WebGIS
applications. This application uses the PHP and
JavaScript programming language to combine the
SQL language that helps to query the data. The
JavaScript language and open source “Mapbox
GL JS” library are used to build user interface
functions such as chart display, map display,
zoom in – zoom out, view object
information,…(map functions).
At the application server level, this research used
Web Servers as Apache and TomCat to handle
Web-related tasks on the server. This system also
Figure 3. WebGIS architecture in this study
3. RESULTS
In addition to the WebGIS application, this study
also developed a mobile application that supports
the collection of diseases data on plant and animal
species in the field. This application is
programmed based on Mobile website technology
(also known as Web Apps). These data are linked
and stored directly on the server to assist decision
makers when an outbreak occurs.
3.1
WebGIS application
The system provides interactive maps and timeseries charts based on WebGIS interface. The
statistics data on agriculture are presented
visually and highly interactive. This is a new way
of expressing geographical information (Taylor &
Plewe, 2006). This technology has the advantage
92
An Giang University Journal of Science – 2019, Vol. 6, 89 – 99
of linking spatial data and statistical data to
represent different types of charts (Andrienko et
al., 2002; Nagel et al., 2013). When interacting
with any component, the other of the components
will be customized accordingly, so that the
information displayed on the user's request
(Figure 4).
analyze data better. However, each type of
information
has
different
graphical
representations. The WebGIS application is
designed to display charts in flexible ways. Bar
charts or column charts are good for comparisons,
while line charts work better for trends. In the pie
chart, the arc length of each slice is proportional
to the magnitude of the quantity.
The chart is a graphical representation of data.
Visual information from the chart helps users
Figure 2. Interactive maps and time-series charts based on WebGIS interface
Data is stored in a time series. Therefore, the
“chart function” in the WebGIS application
provides a time bar at the bottom of some charts.
Users can choose the time period for analyzing
the information (Figure 5).
93
An Giang University Journal of Science – 2019, Vol. 6, 89 – 99
Figure 5. The time bar is used to analyze the information
The WebGIS application is based on Open GIS
Consortium (OGC) standards. Some of the
common standards for geographic data distributed
over the web environment are Web Map Service
(WMS) or Web Feature Service (WFS).
Therefore, WebGIS applications can provide
functions such as displaying and querying
geographic data in various forms, such as maps,
charts, tables from raster data or vector data.
Thematic maps are integrated into the WebGIS
application, such as land use map, soil map,
satellite imagery… (Figure 6).
Figure 6. WebGIS application provides a variety of thematic maps
3.2
Data management application
quickly and conveniently. The data is updated by
the user and stored directly to the server,
including spatial and non-spatial data.
The data management functions is designed using
web interface (Figure 7). Based on this function,
the administrator can manage and update data
94
An Giang University Journal of Science – 2019, Vol. 6, 89 – 99
Figure 7. Data management function
The users are defined into several groups. Each group can access data at different levels (Figure 8).
95
An Giang University Journal of Science – 2019, Vol. 6, 89 – 99
Figure 8. User management function
3.3 Mobile application to collect disease data
same time. The collected data is quickly updated
in the system and widely disseminated to the
management staff as well as farmers to plan
timely prevention (Figure 9).
To collect data on site, a mobile application is
built. It runs on Android system. The location,
information, and pictures can be gathered at the
96
An Giang University Journal of Science – 2019, Vol. 6, 89 – 99
Figure 9. Mobile application to collected disease data
3.4 Agricultural information portal
All applications of the agricultural information system are integrated into a portal. Information on
agriculture will be provided to various users such as administrator, local government office, businessman,
farmer (Figure 10).
97
An Giang University Journal of Science – 2019, Vol. 6, 89 – 99
Figure 10. The main interface of An Giang - Agriculture portal
displayed in a browser with multi-temporal
interactive maps. Users can access data with a
friendly interface.
This site also publishes agricultural news, disaster
information, agricultural market information.
Useful information will help farmers develop
effective production plans. Besides, research
institutions and universities can also access
reliable sources of data for research and training.
Agriculture is an important economic sector in
Vietnam, so the modernization of agricultural
management is one of the urgent requirements.
Research on building an agricultural information
system based on open source WebGIS technology
shows that this technology provides the full
functionality of a WebGIS application in
agriculture. This system promises to be an
effective tool to support the management of local
officials. In addition, farmer and businesses can
also look up useful information about agricultural
production.
4. CONCLUSION
Today, with the development of information
technology, especially in the field of geographic
information systems, the requirements of a
database management system not only have the
function of managing the attribute data but also
must have spatial data management functions. In
this paper, all parts of the system use the open
source software. PostgreSQL and PostGIS can
provide the requirements of a database
management system and a large library of spatial
functions.
Acknowledgments
This study was part of “Research on building
agricultural information systems for agricultural
restructuring
in
An
Giang
Province”372.2016.14 funded by An Giang Department of
Science and Technology.
Our research results show that storing agricultural
data into a centralized and unified database
facilitates the management of agriculture as well
as building an agricultural information system.
Based on spatial data, agricultural information is
98
An Giang University Journal of Science – 2019, Vol. 6, 89 – 99
REFERENCES
rural development database management
system by WebGIS technology. Special Issue:
An Giang University Journal of Science, 1–10.
Andrienko, N., Andrienko, G., Voss, H.,
Bernardo, F., Hipolito, J., & Kretchmer, U.
(2002). Testing the Usability of Interactive
Maps in CommonGIS. Cartography and
Geographic Information Science, 29, 325–342.
/>
Nagel, T., Klerkx, J., Vande Moere, A., & Duval,
E. (2013). Unfolding – A Library for
Interactive Maps. Springer, Berlin, Heidelberg.
/>
ESRI. (2009). GIS for Agriculture. GIS Best
Practice, (June), 1–30.
Nair, R., Chauhan, R., & Vats, M. (2015).
Comparative analysis of open source spatial
database systems. International Journal of
Innovative Computer Science & Engineering,
2(6), 01–03.
ESRI. (2013). Farming the Future. GIS for
Agriculture, 2, 38.
Giuliani, G., Dubois, A., & Lacroix, P. (2013).
Testing OGC Web Feature and Coverage
Service performance: Towards efficient
delivery of geospatial data. Journal of Spatial
Information Science, 7(7), 1–23.
Shukla, D., Shivnani, C., & Comp, D. S. (2016).
Comparing Oracle Spatial and Postgres
PostGIS. International Journal of Computer
Science & Communication, 7, 95–100.
/>
/>
Southwest Steering Committee. (2016). Climate
change adaptation solutions for sustainable
development in the South and Vietnam.
Loechel, A., & Schmid, S. (2012). Caching
techniques for high - performance Web Map
Services. Proceedings of the AGILE’2012
International Conference on Geographic
Information Science, 24–27.
Taylor, W., & Plewe, B. (2006). The effectiveness
of interactive maps in secondary historical
geography
education.
Cartographic
Perspectives, 55, 16–33.
Le, T.; Quang, T.C.; Thanh, L.V.; Minh, V. Q.; &
Quynh, P. V. (2013). Building agriculture and
99