Study on the process of determination of cadmium and lead in some vegetables in Lam Thao - PhuTho by F-AAS method
Bạn đang xem bản rút gọn của tài liệu. Xem và tải ngay bản đầy đủ của tài liệu tại đây (357.71 KB, 7 trang )
Journal of Science & Technology 134 (2019) 020-026
Study on the process of Determination of Cadmium and Lead in Some
Vegetables in Lam Thao - PhuTho by F-AAS Method
Pham Xuan Du1, Nguyen Tien Khi1, Tran Thi Thuy2, Vu Anh Tuan2,*
1
Center for Applied Analysis Techniques, Viet Tri Industrial University
Hanoi University of Science and Technology – No. 1, Dai Co Viet Str., Hai Ba Trung, Ha Noi, Viet Nam
Received: August 04, 2018; Accepted: June 24, 2019
2
Abstract
In this paper, we studied the process of analysis cadmium and lead in green vegetable samples by flame
atomic absorption spectrometry (F-AAS). The conditions of analysis such as acid concentration, subtracted
solution, releasing reagent have been investigated and optimized. Effect of foreign ions on spectral line
intensity was also investigated. At the optimized conditions (HNO3 concentration of 1%, CH3COONH4
concentration of 1%, LaCl3 concentration of 1%), the analysis procedure showed the high accuracy and
repeatability. The linear ranges of Cd and Pb were 0.01-4 ppm and 0.05-8 ppm, respectively. The limit of
detection (LOD) and (LOQ) of Cd were 0.0092 and 0.0310 ppm, respectively and these values for Pb were
0.0090 and 0.0300 ppm. In addition, the procedure was applied to analyze the 10 green vegetable samples
grown in Lam Thao district, Phu Tho province.
Keywords: F-AAS, Cadmium, Lead, Heavy metal, Analysis
obviously contain a high cadmium level. Lead
accumulates in the body and interferes in vitamin D
and calcium metabolites, it is a neurotoxin which
causes behavioral abnormalities. Vegetables,
especially leaf vegetables may contain elevated lead
level when grown near sources of lead [4]. Therefore,
the determination of cadmium and lead in the
vegetable samples at locations is becoming urgent.
1. Introduction
The*process
of
industrialization
and
modernization as well as development of society have
quickly created enormous consequences on the
environment. At present, we are facing serious
environmental problems such as land, water, air, and
ecosystems [1]. Governments and scientists are very
considered about addressing the source of
environmental pollution. In particular, the analysis and
evaluation of environmental indexes will play an
important role in addressing the problem of pollution
[2].
In order to determine the heavy metal contents in
food, water samples, and soil, there many methods
have been developed such as catalytic kinetic method
[5], micro-volume UV-Vis spectrophotometric [6],
flame atomic absorption spectrometry (F-AAS) [7],
and graphite furnace atomic absorption spectrometry
(GF-AAS) [3]. X-ray fluorescence (XRF) [8]. And,
atomic Absorption Spectroscopy (AAS) has been
showed the high selectivity and accuracy. In each
analytical method, the sample preparation and
choosing the analytical conditions play the decisive
roles in the accuracy and repeatability of the analytical
method.
Recently, food contamination issue has received
a great interest from society and government.
Especially, green vegetables are food needs for daily
life, the quality of them is very important to ensure
human health. Normally, green vegetables
accumulated heavy metals from fertilizers, soil and
water source. It is therefore essential to analyze and
evaluate the heavy metal contamination in green
vegetables [3].
In the sample treatment technique, the heating on
hot plate, decomposition by heating block,
decomposition by high pressure, and microwave have
been widely used. In which, microwave most suitable
for AAS analysis due to the following characteristics:
rapid decomposition rate, decomposition time for
environmental samples from several minutes to less
Lead and Cadmium are two unnecessary
elements that accumulate the living organs for which
these elements are toxic. Cadmium ion are easily
absorbed by vegetables and animal food distributed in
kidney and liver consequents to many health problems.
vegetables grown in highly contaminated soils would
*
Corresponding author: Tel.: (+84) 912.911.902
Email:
20
Journal of Science & Technology 134 (2019) 020-026
than 20 minutes, the sealed system that do not
contaminate the environment and not lose the volatile
metals Cd and Pb as compared to other techniques.
The 8 vials of microwave-decomposition of
sample were prepared. Dry vegetable sample (0.3 g)
was put in each vials. Next, 10 mL of concentrated
HNO3 was added into vials and then placed in
microwave oven. The temperature in range of 135-180
℃ and the time in range of 4-12 min were used for
treatment of sample to Fig. out the optimization
temperature and optimization time.
In this paper, we study and evaluate the analytical
procedure of Cd and Pb in some green vegetable
samples by F-AAS. The microwave oven was used to
treat the samples. The effects acid concentration,
substrate solution and releasing reagent on spectral
line intensity were investigated to determine the
optimized conditions. The effect of foreign ions also
was studied. In addition, statistical evaluation methods
were also used to evaluate the reliability and accuracy
of the method.
2.2.3. Analysis conditions
Spectral measurement conditions: The selection
of spectral measurement conditions based on the
combination of theoretical and empirical aspects. The
resonance line and slit width for lead were 288.8 nm
and 0.5 nm, respectively, and the values for lead were
217.0 and 0.5 nm, respectively. The peak signal was
sensitive enough, high stability, and 100 % of peak
area was inside the slit. The currents of lamp for
cadmium and lead (8 mA and 10 mA, respectively)
were chosen to be had the high intensity and stability
and of spectral line.
2. Experimental
2.1. Apparatus and chemicals
The standard solutions, Cd2+ (Merck, 1000 ppm)
and Pb2+ (Merck, 1000 ppm) were used to made the
standard curves. The samples and standard solutions
were prepared by diluting the stock solution in the
respective proportions. Concentrated solutions, HNO3
(Merck, 65%) and HCl (Merck, 37%) were used
without further purification. The solutions, NH4Cl
10%, CH3COONH4 10%, CH3COONa 10%, LaCl3
10% were used to studied the effect of operation
parameters to the analytical methods. Double distilled
water, volumetric flask, filter, filter paper, glass
beaker, analytical balance (accuracy ± 0.0001g),
technical weighing (accuracy ± 0.01 g), and heating
plate were used to sample preparation. The flame
atomic adsorption spectroscopy (F-AAS, NOVAA
350) was used to analyze the samples. The samples
were prepared by a microwave system, Qlab pro.
Canada, the microwave breaking capacity of 1200W,
the frequency of 1250 MHz, power supply of 220V,
50Hz, 20A, and temperature range of 1-300 ℃.
Atomization conditions: The height of lamp for
atomization of Cd and Pb was chosen at 7 mm in order
to have the high sensitivity and stability as well as the
smallest error.
To evaluate the error and repeatability of the
measurement, we used the formulas in the previous
publication [9] as follows.
Relative error was calculated according to the
formula:
Er =
|(
)|
× 100 (1)
Repetitivity of method was determined by formulas:
SD =
2.2. Sample preparation
∑ (
(
RSD = 100 ×
2.2.1. Collection of samples
̅)
(2)
)
̅
(3)
Where ̅ is mean value, Er is average relative error
(%), xt is the true or acceptable value, SD is Standard
deviation, and RSD is relative standard deviation.
Vegetable samples were collected at locations
and packed in clean plastic bags to bring to the
laboratory. After cutting the yellow leaves, the
vegetable samples were rinsed by tap water to remove
the soil and sand, then rinsed with double distilled
water several time. Fresh vegetable samples were keep
at room temperature for 3h to for water drain, and then
chopped in to small pieces and mixed well. The
samples were weighed and then placed in an oven at
80 ℃ until dry. Dry samples were transferred into a
desiccant to cool and weighed once again to
determined the dry weight. The samples were stored in
vials to avoid moisture then analyzed by a F-AAS.
Limit of detection (LOD) is the lowest quantity
of a substance that can be distinguished from the
absence of that substance (a blank value) with a stated
confidence level (generally 99%):
LOD= ̅ blank + 3SD
(4)
Limit of quantification (LOQ):
LOQ =
(5)
The contents of Cd and Pb were determined by
following equation:
2.2.2. Optimization of temperature and time for
treatment of samples
21
Journal of Science & Technology 134 (2019) 020-026
X=
×
HNO3 1%, the results are presented in Fig. 2. The
maximum absorbance for CH3COONa, NH4Cl, and
CH3COONH4 were 0.064, 0.065, and 0.069,
respectively. The absorbance for using CH3COONH4
solution approached maximum value at lower
concentration than for using other solutions.
Therefore, the solution CH3COONH4 1 % was used to
further investigation.
(6)
Where, X (mg/kg) is the content of heavy metal in
fresh vegetable sample, C x (mg/L) is the concentration
of heavy metal from standard curves, V (L) is the
volume of sample, m (kg) is mass of fresh vegetable
sample.
3. Results and discussion
3.1. Study the effect of sample preparation on
spectral line intensity
0.068
Absorbance (a.u.)
3.1.1. Effect of acid concentration on spectral line
intensity
In this study, in order to investigate the effects of
the type of acid and its concentration to spectral line
intensity, we used HCl, H2SO4 and HNO3 in
concentration from 0 to 3% to analyze Cd and Pb at the
concentrations of 1 and 2 ppm. The results in presented
in Fig. 1.
0.064
0.062
0
1
2
3
4
5
Concentration of salts (%)
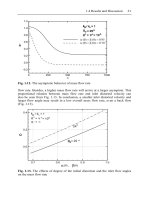
Fig. 2. Effect of substrate solution on absorbance of
sample.
3.1.3. Effect of releasing reagent on spectral line
intensity
0.069
Adsorbence
0.066
0.060
HCl
H2SO4
HNO3
0.070
NH4Cl
CH3COONH4
CH3COONa
0.068
In the previous publication [10], LiCl3 can be
used as releasing reagent to a voice possible
interference by phosphate, sulfate and silicate ions
presents in the matrix. However, LaCl3 has the high
vaporization temperature so that if the LaCl3 content in
the sample is large then the temperature of flame is not
sufficient to vaporize the sample. Therefore, it is
necessary to investigate the LaCl3 content to Fig. out
the suitable concentration. In this study, the LaCl3
concentration was varied from 0 to 2.0% in sample
solution, Cd 1 ppm and Pb 2 ppm in HNO3 1% and
CH3COONH4 1%. Fig. 3 showed the absorbance of
solution was depended on LiCL3 concentration, it
reached the maximum value at concentration of 1.0%.
0.067
0.066
0.065
0
1
2
3
4
Concentration (%)
Fig. 1. Effect of acid concentration on spectral line
intensity
It was seen that the type of acid and its
concentration were significantly affected to spectral
line intensity of Cd and Pb. The HNO3 acid showed the
high intensity compared to other acids. Therefore, we
selected the HNO3 at concentration of 1% to further
study.
0.072
3.1.2. Effect of substrate solution on spectral line
intensity
Absorbance
0.070
In some cases, the samples contain heat-resistant
substances. These substances can inhibit the
atomization, leading the reduction of the sensitivity of
analytical method. We have added additional
vaporized substances for elimination of the effect of
heat-resistant substances. Therefore, in order to
investigate the effect of substrate solution on spectral
line
intensity,
the
solutions
CH3COONa,
CH3COONH4, and NH4Cl in concentration range of 15% were used as substrate solutions to measure the
absorbance of solution Cd 1ppm and Pb 2ppm in
0.068
0.066
0.064
0.0
0.5
1.0
1.5
2.0
LiCl3 concentration (3%)
Fig. 3. The effect of releasing reagent on absorbance
of sample.
22
Journal of Science & Technology 134 (2019) 020-026
3.1.4. Effect of interferences
0.047 and linear regression coefficient was 0.994.
These results revealed that absorbance is directly
proportional to concentration or in other work
Lambert-Beer law is valid.
In order to study the effect of various ions on
determination of Cd and Pb, the solution of Cd 1ppm
and Pb 2ppm in HNO3 1%, CH3COONH4 1% and
LaCl3 1% was used with the addition of different
amount of foreign ions as mentioned in Table 1.
Table 2. Results for the determination of linear
concentration range of Cd.
Table 1. Effect of interference ions on absorbance of
sample in optimum conditions
Cd
concentration
(ppm)
Ion added
0.01
0.0145
0.0145
0.0146
0.025
0.0120
0.0120
0.0120
0.1
0.0165
0.0165
0.0166
0.25
0.0236
0.0237
0.0237
0.5
0.0388
0.0390
0.0389
1
0.0669
0.0670
0.0669
2
0.1359
0.1359
0.1360
3
0.2273
0.2272
0,2273
4
0.3008
0.3008
0.309
Abs1: first measurement, Abs2: second measurement,
Concentration, ppm
K+ (ppm)
0
200
Na+ (ppm)
0
100
Mg2+ (ppm)
0
50
2+
Ca (ppm)
0
50
Ba2+ (ppm)
0
10
Sr2+ (ppm)
0
10
Cu2+ (ppm)
0
20
Ni2+ (ppm)
0.
20
2+
Zn (ppm)
0
20
Mn2+ (ppm)
0
20
Al3+ (ppm)
0
20
Fe2+ (ppm)
0
20
3+
Cr (ppm)
0
2
Abs-Cd
0.3052 0.3056
Abs-Pb
0.0707 0.0700
300
400
800
200
400
500
100
150
200
100
150
200
20
30
40
20
30
40
30
40
50
30
40
50
30
40
50
30
40
50
60
80
100
60
80
100
4
8
10
0.3049 0.3063 0.3060
0.0727 0.0728 0.0708
Absorbance
Abs1
Abs2
Abs3
Average
value
0.0145
0.0120
0.0165
0.0237
0.0389
0.0669
0.1359
0.2273
0.3008
Abs3: third measurement.
Table 3. Results for the determination of linear
concentration range of Pb.
Cd
concentration
(ppm)
Absorbance
Abs1
Abs2
Abs3
Average
value
0.01
0.0298 0.0297 0.0298 0.0298
0.05
0.0356 0.0357 0.0357 0.0357
0.1
0.0395 0.0394 0.0394 0.0394
0.25
0.0476 0.0475 0.0475 0.0475
1
0.0612 0.0613 0.0613 0.0613
2
0.0795 0.0795 0.0794 0.0795
3
0.0962 0.0962 0.0962
0.062
4
0.1128 0.1127 0.1128 0.1128
6
0.1446 0.1445 0.1447 0.1446
7
0.1565 0.1565 0.1565 0.1565
8
0.1721 0.1722 0.1722 0.1722
Abs1: first measurement, Abs2: second measurement,
As seen in Table 1, the foreign ions in survey
range concentration did not affect to determination of
Cd and Pb. Moreover, in the practical samples, the
concentration of these ion is lower than that of the
survey. Therefore, it can be concluded that these ions
did not affect to measurement. This is a great
advantage of atomic absorption spectroscopy as
compared to other methods.
3.2. Validation method
3.2.1. Determination of the linear ranges of Cd and Pb
To determine the linear ranges of Cd and Pb, we
prepared the Cd and Pb standard solutions in HNO3
1%, CH3COONH4 1%, 0.01-4 ppm and 0.01-8 ppm for
Cd and Pb, respectively. The obtained absorbance
values are presented in Tables 2 and 3.
Abs3: third measurement.
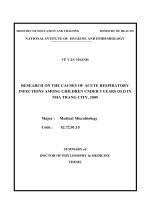
The standard linear calibration curve of Cd
obtained from the standard solutions analysis is
presented in Fig. 4. It showed a good linear
relationship
between
the
absorbance
and
concentrations of the standard solutions in the range
of 0.01-4 ppm. The standard deviation was 0.099 and
the linear regression coefficient was 0.995.
For the Pb, the calibration curve is presented in
Fig. 5. It also showed a good linear relationship
between the absorbance and concentrations over the
range of 0.05-8 ppm. The standard deviation was
Fig. 4. Calibration curve for standard solution
23
Journal of Science & Technology 134 (2019) 020-026
Cd.
Table 6. Accuracy and repeatability for Pb analysis
Sample
CPb
xt (Abs)
Test
1
2
3
4
5
6
7
8
9
10
(Abs)
SD
RSD
Fig. 5. Calibration curve for standard solution Pb
3.2.2. Determination of LOD and LOQ of Cd and Pb
To determine the LOD and LOQ, we prepared
20 bank samples and then analyzed at optimzied
condition. The obtained results of absorbance were
used to calculate the SD, b (intercept of standard
curve), LOD and LOQ by equations 1-5. The results
are recorded in Table 4.
Pb
0.0014
0.017
0.0090
0.0300
Element
Added
standard
(ppm)
0.5
Cd
0.0051
0.062
0.0092
0.0310
Cd
1.0
Table5. Accuracy and repeatability for Cd analysis
Sample
CCd
x(ppm)
t (Abs)
1
0, 025 ppm
0,0120
xi
Test
1
2
3
4
0.0122
0.0118
0.0116
0.0119
5
6
7
8
9
10
(Abs)
SD
RSD
0.0117 2.50
0.0121 0.83
0.0123 2.50
0.0115 4.20
0.0118 1.67
0.0122 1.67
0.0119 0.83
0.00026
2.185
1.67
1.67
3.33
0.83
2
1 ppm
0,0669
xi
0.0673
0.0658
0.0655
0.0662
3
2 ppm
0,1359
1.0
xi
0.60
1.64
2.09
1.04
0.0665 0.60
0.0675 0.90
0.0670 0.15
0.0662 1.05
0.0665 0.60
0.0656 1.86
0.0664 0.75
0.00069
1.0392
0.1343
0.1315
0.1342
0.1312
2
3 ppm
0,0962
xi
0.0958 0.42
0.0955 0.73
0.0945 1.78
0.0948 1.46
0.0942 2.01
0.0966 0.42
0.0939 2.39
0.0935 2.81
0.0951 1.14
0.0954 0.83
0.0949 1.35
0.0011
1.148
3
6 ppm
0,1446
xi
0.1422 1.66
0.1410 2.48
0.1404 2.90
0.1427 1.31
0.1420 1.80
0.1419 1.87
0.1425 1.45
0.1416 2.07
0.1405 2.83
0.1412 2.35
0.1416 2.07
0.0008
0.567
Table 7. The recoveries of Cd and Pb
Table 4. Statistical values of Cd and Pb analysis
method.
Statistical values
SD
b
LOD (ppm)
LOQ (ppm)
1
1 ppm
0,0613
xi
0.0602 1.79
0.0595 2.94
0.0589 3.92
0.0592 3.43
0.0580 5.38
0.0585 4.57
0.0597 2.61
0.0582 5.06
0.0590 3.75
0.0596 2.77
0.0590 3.75
0.0007
1.197
1.18
3.24
1.25
3.45
Pb
2.0
0.1345 1.03
0.1336 1.69
0.1328 2.28
0.1332 1.99
0.1325 2.50
0.1320 2.87
0.1330 2.13
0.00109
0.8595
Analysis
value
(ppm)
0.461
0.482
0.513
0.476
0.522
1.037
0.982
0.985
0.967
0.951
0.984
0.976
0.968
1.016
0.955
1.947
1.895
1.925
1.942
2.108
Recovery
(%)
98.16
98.46
97.98
98.2
3.2.3 Accuracy and repeatability of method
To evaluate the accuracy of the measurement, we
prepare the standard samples with concentration in
linear range of Cd and Pb. Each sample was measured
and repeated in ten times, the Er, SD, and RSD were
calculated by equation 1, 2 and 3. The results are
presented in Table 5 and Table 6. It was showed that
the standard deviation (SD) and relative standard
deviation (RSD) of the Cd and Pb measurements are
small within the permissible limitations (7.3-15%)
24
Journal of Science & Technology 134 (2019) 020-026
according to AOAC. These mean that the F-AAS
method is a stable, good repeatability, high precision,
and fully consistent to the determination of trace metal
in the vegetable samples.
Table 9. The results of analysis of Pb in vegetable
samples.
No.
The repeatablity of method was also evaluate by
recovery. It was detetermined from added standard
sample at the addition of 0.5 and 1.0 ppm for Cd and
1.0 and 2.0 ppm for Pb. The recovery was presented in
Table 7. It can be seen in the Table 7, the recovies were
98.16 and 98.46% for Cd at concentrations of 0.5 and
1.0 ppm, respectively, these values were 97.98 and
98.2% for Pb at concentrations of 1.0 and 2.0 ppm,
respectively. These values were compatible with
AOAC.
1
2
3
4
5
3.2.4. Analysis of the real samples
6
7
8
9
Table 8. The results of analysis of Cd in vegetable
samples.
Concentration Concentration Limit of
from
in vegetable QCVN 8calibration
samples
3:2012/B
curve (ppm)
(mg/kg)
YT
10
Vegetable
sample
Moringa
oleifera
Cabbage
Vegetables
shrinkage
Ceylon
spinach
vegetable
chrysanthemum
Watercress
Tomato
Choy sum
Spinach
Water
spinach
Concentration Concentration Limit of
from
in vegetable QCVN 8calibration
samples
3:2012/B
curve (ppm)
(mg/kg)
YT
0.0518
0.2588
0.0487
0.2433
0.0545
0.2723
0.0533
0.2663
0.0529
0.2645
0.0536
0.0568
0.0496
0.0495
0.2680
0.2841
0.2480
0.2473
0.0536
0.2680
0.3 ppm
No.
Vegetable
sample
1
Moringa
oleifera
0.0347
0.1735
2
Cabbage
0.0300
0.1503
3
Vegetables
shrinkage
0.0338
0.1688
4
Ceylon
spinach
0.0359
0.1797
5
vegetable
chrysanthemum
0.0348
0.1740
6
Watercress
0.0365
0.1827
7
Tomato
0.0384
0.1922
8
Choy sum
0.0340
0.1698
9
Spinach
0.0370
0.1850
The optimum conditions for determination of Cd
and Pb contents in some green vegetable samples in
Lam Thao district, Phu Tho Province, Vietnam by FAAS were investigated and it was indicated following:
The acid HNO3 concentration was 1%, substrate
solution was CH3COONH4 with the concentration of
1%, releasing reagent was LaCl3 with the
concentration of 1%. At this condition, the analysis
method had high accuracy and repeatability with the a
tolerance was less than 5%. The foreign ions such as
Na+, Ca2+, Cu2+, Al3+, etc. did not affect to
measurement. In addition, 10 vegetable samples were
analyzed, Cd and Pb were detected in all samples.
However, the Cd and Pb contents in these samples
were in allowed range as followed the national
technical regulation on the limits of heavy metals
contamination in food (QCVN 8-3:2012/BYT).
10
Water
spinach
0.0373
0.1863
References
4. Conclusion
0.2 ppm
[1]. Truyet T. Mai, Quang M. Nguyen, Development and
environment in Vietnam, Presented at Conference on
Strategies for Sustainable Development in Vietnam
(2013) 1-16.
The 10 vegetable samples collected from Lam
Thao, Phu Tho province were streated by procedure in
section 2.2 and then analyzed by F-AAS
(NOVAA350) at optimized conditions. The results are
presented in Tables 8 and 9. The results showed that
the Cd and Pb content in the samples was low. The Cd
content in 10 vegetable sample was in range 0.15030.1922 ppm and it was 0.2433-0.2841 ppm for Pb
content. And, both of metals were in allowed range as
followed the national technical regulation on the limits
of heavy metals contamination in food (QCVN 83:2012/BYT).
[2]. T.M. Tiến, Vietnam National Environmental
Performance Assessment (EPA) Report, 2015.
[3]. M.J. Baxter, J.A. Burrell, H.M. Crews, R.C. Massey,
D.J. McWeeny, A procedure for the determination of
lead in green vegetables at concentrations down to 1
μg/kg, Food Additives & Contaminants 6 (1989) 341349.
[4]. Z. Ramezani, N. Aghel, N. Amirabedin, Determination
of Pb and Cd in Garlic Herb (Allium sativum) Planted
in Gilan and Khuzestan Provinces Using Graphite
Furnace
Atomic
Absorption
Spectrometry,
25
Journal of Science & Technology 134 (2019) 020-026
Jundishapur Journal of Natural Pharmaceutical
Products 7 (2012) 41-44.
Fluorescence Technology and Geostatistics, in: L.
Pawlowski, W.J. Lacy, J.J. Dlugosz (Eds.) Chemistry
for the Protection of the Environment, Springer US,
Boston, MA, 1991, pp. 155-173.
[5]. V.A. Tuan, N.V. Xuyen, Catalytic kinetic method for
determination of trace manganese in water,, Journal of
Science and Technology 117 (2017) 5.
[9]. V.A. Tuấn, N.V. Xuyến, Phương pháp động học xúc
tác phức xác định hàm lượng vết mangan trong nước
Tạp chí khoa học công nghệ các trường đại học kỹ
thuật 117 (2017) 5.
[6]. A. Fashi, M.R. Yaftian, A. Zamani, Electromembrane
extraction-preconcentration followed by microvolume
UV–Vis spectrophotometric determination of mercury
in water and fish samples, Food Chemistry 221 (2017)
714-720.
[10]. Luong Thi Thu Huyen, Tran Anh Dung, Vu Anh Tuan,
T.T. Thuy, Study the Determination Process of
Cadmium in Fertilizers by Flame Atomic Absorption
Spectroscopy (F-AAS), Journal of Science and
Technology 111 (2016) 15-19.
[7]. A. Elik, N. Altunay, R. Gürkan, Microextraction and
preconcentration of Mn and Cd from vegetables, grains
and nuts prior to their determination by flame atomic
absorption spectrometry using room temperature ionic
liquid, Journal of Molecular Liquids 247 (2017) 262268.
[8]. G.A. Raab, R.E. Enwall, W.H. Cole, C.A. Kuharic, J.S.
Duggan, Fast Analysis of Heavy Metals in
Contaminated Soils Using Field-Portable X-Ray
26