Determination of aquaculture distribution by using remote sensing technology in Thanh Phu district, Ben Tre province, Vietnam
Bạn đang xem bản rút gọn của tài liệu. Xem và tải ngay bản đầy đủ của tài liệu tại đây (1.79 MB, 7 trang )
Physical sciences | Engineering
Doi: 10.31276/VJSTE.61(2).35-41
Determination of aquaculture distribution
by using remote sensing technology in Thanh Phu
district, Ben Tre province, Vietnam
Nguyen Thi Hong Diep1*, Thitinat Korsem2, Nguyen Trong Can1,
Walaiporn Phonphan2, Vo Quang Minh1
1
College of Environment and Natural Resources, Can Tho University, Vietnam
Faculty of Science and Technology, Suan Sunandha Rajabhat University, Thailand
2
Received 18 July 2018; accepted 25 October 2018
Abstract:
Introduction
Aquaculture is an important economic activity in the
coastal zone of Vietnam. Thanh Phu is one the coastal
districts in Ben Tre province that rears brackish
aquaculture. In recent years, farmers could not grow
shrimp because of salinity intrusion and market price
fluctuation. This study aims to determine aquaculture
and fallow aquaculture pond distribution by using
the three indices of NDVI (Normalized Difference
Vegetation Index), MNDWI (Modified Normalized
Difference Water Index) and NDBaI (Modified
Difference Bareness Index) on Landsat 8 imagery.
The results reveal that remote sensing can support
the detection of aquaculture and fallow ponds with
a high accuracy of 77%. The total aquaculture area
is approximately 13,093.65 ha, of which the total
fallow area is 581.49 ha (roughly 4.44% of the total
aquaculture area). Moreover, the fallow ponds are
randomly distributed in all four ecological zones and
mostly in the fourth ecological region (about 73.92%).
In the fourth region, saline concentration in water is
from 20 to 30‰, which directly influences cultured
shrimp farms. The results also indicate the spatial
distribution of aquaculture ponds and ineffective
aquaculture locations using Landsat 8 imagery via
index image analysis. The findings support the local
management’s decision making on further aquaculture
planning.
Ben Tre province is one of the coastal provinces located
in the Lower Mekong River, Vietnam. Its major industry
is agriculture, including orchard and rice crop cultivation
and aquaculture. The famous products of Ben Tre province
are made from coconuts. Two types of farming system are
commonly adopted in the coastal areas, namely rice-shrimp
rotation and shrimp farming [1]. These farming systems can
generate higher income than mono-cropping or double rice
cropping.
Keywords: aquaculture, Ben Tre province, ecological
zone, fallow pond, satellite image indices.
Classification number: 2.3
Changes in climate have adversely affected the coastal
areas in recent years, causing sea level rise, increase in
temperature and rainfall, drought, salinity intrusion, and
spread of epidemic diseases in both rice and shrimp farms;
consequently, aquaculture farming encountered a reduction
in both production and income [2].
Remote sensing and geographical information system
(GIS) are useful tools for detecting the spatial distribution
of natural resources and aquaculture areas. This research
applied remote sensing and GIS technologies to determine
shrimp farming and ineffective shrimp pond. That refers to
a pond where farming culture has ceased due loss of profit
caused by the damage of shrimp diseases, thereby resulting
in “a fallow pond”. This study aims to identify aquaculture
distribution and locate ineffective shrimp ponds. Its
findings endeavour to support local decision making on the
management of coastal aquaculture resources.
Materials and methodology
Study area
Thanh Phu is one of coastal districts located in the
*Corresponding author: Email:
JUne 2019 • Vol.61 Number 2
Vietnam Journal of Science,
Technology and Engineering
35
Physical Sciences | Engineering
southeast of Ben Tre province. Its distance from the seashore
is approximately 45 km, and its total area is roughly 411
km2 (Fig. 1) [3]. Thanh Phu was established by an accretion
of Ham Luong and Co Chien rivers several centuries
ago. Its coastal land consists of paddy fields, sand dunes
and mangrove forests. Thanh Phu district is considered as
a developing core of the third economic region (i.e. salty
region) [4]. The entire district land is affected by salinity
intrusion that is suitable for brackish farming systems,
including rice-shrimp rotation, extensive-intensive shrimp
and clam exploitation on the coastal tidal mudflats [4, 5].
The brackish aquaculture is a principal agricultural product
and plays an important role in the district economy [6].
Materials
Satellite imagery: Landsat 8 (OLI) images from 2015
to 2016 were collected from the U.S. Geological Survey
website ( The Landsat 8
images have a medium resolution with 30 metres. Eight
images were used, including four images each for the sunny
and rainy seasons. The acquired period was focused on the
two seasons to detect shrimp culture, rice-shrimp rotation
system and fallow shrimp pond culture. Farmers in Thanh
Phu district discontinued the cultivation of shrimp farms
in the dry season of 2016 due to shrimp diseases, which
reduced production.
GIS data: administrative and land use maps, natural river
and canal maps and information about ecological zones in
Thanh Phu district, Ben Tre province were obtained from the
Ben Tre Department of Natural Resources and Environment
(Ben Tre DNRE) and the Ben Tre Department of Agriculture
and Rural Development (Ben Tre ARD).
Methods
Remote sensing methods:
A subset study area was identified to limit the scope of the
research area. Besides, rivers and canals were also removed
to reduce the confusion between rivers and aquaculture
areas throughout the year.
Removing cloud from the imagery: Landsat 8 level 1
data products include a 16-bit quality assessment (QA)
band containing integer values that represent bit-packed
combinations of surface, atmosphere and sensor conditions
in which bits 12-13 can be cirrus cloud and bits 14-15 are
cloudy pixels. The reference values from 36,864 to 39,936
may be cloud, and the values from 53,248 to 61,440 are
cloudy values [7]. We also used band 1 (coastal aerosol),
band 9 (cirrus) and band 10 (thermal infrared, or TIR) to
remove cloud. Thick cloud was detected by selecting a
threshold on bands 9 and 10 (i.e. high values on band 9
and low values on band 10). Thin cloud was masked using
bands 1, 9 and 10 using only the low values in both bands
Fig. 1. Study site of Thanh Phu district.
36
Vietnam Journal of Science,
Technology and Engineering
JUne 2019 • Vol.61 Number 2
NDBaI
SWIR TIRS
SWIR TIRS
[12, 13]
(3)
Physical sciences | Engineering
*Note: On the Landsat 8 (OLI) imagery, Red: visible spectrum band of red wavelength (band 4); Green: visible
spectrum band of green wavelength (band 3); NIR: near-infrared radiation (band 5); SWIR: shortwave infrared
Kappa coefficient is another accuracy indicator. It is a
9 and 10. Cloud is also normally brighter than the other
(band 6); and TIR: thermal infrared (band 10).
objects, especially in the blue band, which is given a result measure of how the classification results compare to the
range
of the
index
fromby
˗1chance.
to 1.ItThe
threshold
in highClassification:
pixel values on bandthe
1 [8].
The cloudy
values
were value
valuesisassigned
can take
values frommethod
0 to 1. The
of
classification
was
applied
to
categorize
the
index
images
into
three
land cover
used to create cloud mask in each image; cloud pixels were random point tool was used to create 100 randomly
ground
types,
namely
aquaculture,
vegetation
and
land. Positive values ranging from 0 to
subsequently
deleted
by the cloud mask
and filled values
bybare
truth points on the classified results that were collated with
1multi-time
were applied
to classify water body and vegetation using NDVI and MNDWI
images.
the aquaculture layer on the land use map.
indices;
meanwhile, the beginning values of the NDBaI range were categorized for
Creating spectral indices: the research applied three
GIS methods:
bare
land.
indices to extract information about vegetation, water and
Accuracy
assessment:
bare land
from Landsat
8 imagery. The corresponding
The land cover classifications from the eight index
The
accuracy
of
class
identification
requires
assessment.
This research applied a
indices are normalized difference vegetation index (NDVI), images were
converted to vector file data. The same index
confusion
matrix
(or error
as theandquantitative method of characterizing image
modified normalized
difference
watermatrix)
index (MNDWI)
data were overlaid by a union algorithm to synthesize all
classification
accuracy.
The
overall
(OA) of the classification is the sum of
modified difference bareness index (NDBaI). Theseaccuracy
indices surface
distributions. The results revealed the distribution
the
ofusing
diagonal
by the
of pixels (see Eq. (4)), where PCP
werepixels
calculated
Equationselements
(1) to (3) (Table
1). total number
of vegetation, aquaculture and bare land. The synthesized
are pixels correctly classified, and TP is the total pixels on the image classification
Table 1. Spectral index equations.
data were overlaid to detect land use/land cover (LULC)
[14].
and aquaculture farming distribution.
Index name
Equation
Reference
Equation number
NDVI
PCP
OA NIR − Red
TP
NIR + Red
[9]
(1)
(4)
Results
Satellite imagery
dataacollection
Kappa coefficient is another accuracy indicator.
It is
measure of how the
Green − SWIR
[10, 11]
(2) the values assigned by chance. It can take values
MNDWI
classification
results compare
to
The eight scenes of Landsat 8 were selected from 2015
Green + SWIR
from 0 to 1. The random point tool was used
to create 100 randomly ground truth
(January, February, November and December) and 2016
SWIR
− TIRS
points
on
the
classified
results
that
were
collated
with the aquaculture layer on the
[12, 13]
(3)
NDBaI
(February, March, April and May). The images were located
SWIR
+
TIRS
land use map.
in path 125 and row 53; UTM 48 Northern and WGS-84 were
*Note: GIS
on themethods:
Landsat 8 (OLI) imagery, Red: visible spectrum
used as the projection and reference ellipsoid, respectively
band ofThe
red wavelength
(band 4);classifications
Green: visible spectrum
band the eight index images were converted to
land cover
from
(Fig. 2). One scene covers approximately 185×180 km and
of green wavelength (band 3); NIR: near-infrared radiation (band
vector
file data. The same index data were overlaid
by a union algorithm to synthesize
5); SWIR: shortwave infrared (band 6); and TIR: thermal infrared
a 30-metre spatial resolution for the multispectral bands and
all
surface
distributions.
The
results
revealed
the distribution of vegetation,
(band 10).
a
15-metre
resolution
for the panchromatic
band.
aquaculture and bare land. The synthesized data werespatial
overlaid
to detect
land use/land
Landsat
8
Level
1
product
includes
11
bands,
QA
band
and
cover
(LULC)the
and
aquaculture
farming
Classification:
range
of the index value
is fromdistribution.
˗1
to 1. The threshold method of classification was applied metadata file.
to categorize the index images into three land cover types,
Results
namely aquaculture, vegetation and bare land. Positive
NDBaI
[12,to
13]classify water
(3)
SWIR
values Satellite
ranging from
0 toTIRS
1 were
applied
imagery
data
collection
SWIR TIRS
body and vegetation using NDVI and MNDWI indices;
The
eight
scenes
Landsat
8 were
*Note:
On the
Landsat
8 (OLI)
imagery,
Red:
visibleof
spectrum
band
of red wavelength
(band 4); Green: visible
meanwhile,
the
beginning
values
of the
NDBaI
range
were
spectrum band of green wavelength (band 3); NIR: near-infrared radiation (band 5); SWIR: shortwave infrared
selected
from
2015
(January,
February,
categorized
for bare
land.
(band
6); and TIR: thermal
infrared
(band 10).
November
and
and
2016
Classification: the
range ofDecember)
the index value is from
˗1 to 1. The
threshold method
Accuracy
assessment:
of
classification wasMarch,
applied to categorize
indexMay).
images into
three land cover
(February,
April the
and
The
types, namely aquaculture, vegetation and bare land. Positive values ranging from 0 to
images
were
located
in
path
125
and
row
The
accuracy
of
class
identification
requires
assessment.
1 were applied to classify water body and vegetation using NDVI and MNDWI
This UTM
research
applied
a confusion
matrix
(or error
53;
48
and
were
indices;
meanwhile,
theNorthern
beginning
values
of theWGS-84
NDBaI
rangematrix)
were categorized for
bare
land.
as
the
quantitative
method
of
characterizing
image
used as the projection and reference
Accuracy assessment:
classification
accuracy.
The overall
accuracy
(OA)This
of research
the
ellipsoid,
respectively
(Fig.
2).
One
scene
The accuracy
of class identification
requires
assessment.
applied a
classification
is
the
sum
of
the
pixels
of
diagonal
elements
confusion
matrix
(or
error
matrix)
as
the
quantitative
method
of
characterizing
image
covers approximately 185×180 km and a
classification
the classification
by the totalaccuracy.
numberThe
of overall
pixelsaccuracy
(see Eq.(OA)
(4)),ofwhere
PCP are is the sum of
the pixels of diagonal elements by the total number of pixels (see Eq. (4)), where PCP
pixels
classified,and
and
is the
the classification
are
pixelscorrectly
correctly classified,
TPTP
is the
totaltotal
pixelspixels
on theon
image
[14].
image classification [14].
2. Landsat
image
scene,
with the
Fig.Fig.
2. Landsat
image scene, with
the study
area highlighted
in
PCP
OA
(4)
(4) green.
study
area highlighted in green.
TP
Kappa coefficient is another accuracy indicator. It is a measure of how the
classification results compare to the values assigned by chance. It can take values
from 0 to 1. The random point tool was used to create 100 randomly ground truth
points on the classified results that were collated with the aquacultureJUne
layer2019
on the
• Vol.61 Number 2
land use map.
GIS methods:
The land cover classifications from the eight index images were converted to
Vietnam Journal of Science,
Technology and Engineering
37
Physical Sciences | Engineering
(A)
(B)
Fig. 3. (A) Landsat 8 image, (B) subset study area with removed cloud.
Determining the study area and removing clouds
The Landsat images were affected by clouds (Fig.
3A) and included unrelated zones, rivers and cloud. The
subset study area was removed cloud to limit the confusion
between water surface and aquaculture area (Fig. 3B).
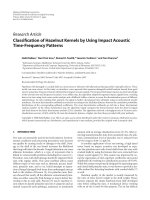
Land covers distribution
Figure 4A illustrates the vegetation that was detected
by NDVI index with a range of value from 0.17 to 0.57.
The vegetation area is approximately 18,972.72 ha, of
which roughly 1,350 ha comprise freshwater plants in
the northwest, including rice crops, orchards and annual
(A) Vegetation
plants. The plantation is near Mo Cay Nam boundary in the
communes of Thoi Thanh, Hoa Loi and Tan Phong. The
vegetation also includes a mangrove forest in the coastal
area of Thanh Hai commune, and it measures 1,450 ha (Fig.
4A).
Water surfaces were determined by the MNDWI
index from 0 to 0.33. The largest water surface area was
contributed by the images in the sunny season, the main
season for cultivating shrimp culture. The total area of water
surfaces was roughly 20,885.85 ha, including extensiveintensive shrimp farming, rice-shrimp rotational cropping
and wetland area. Water surface was distributed virtually
(B) Water surfaces
(C) Bare land
Fig. 4. Land cover distribution of vegetation (A), water surfaces (B) and bare land (C) on the study site.
38
Vietnam Journal of Science,
Technology and Engineering
JUne 2019 • Vol.61 Number 2
Physical sciences | Engineering
along the coastal villages such as Thuan Phong (3,300 ha),
Thanh Hai (2,800 ha), An Dien (2,400 ha) and An Nhon
(2,000 ha) (Fig. 4B).
Bare land was retrieved by the NDBaI index from ˗0.375
to ˗0.001. It covered about 7,414.21 ha and achieved the
largest area in January, February and March after harvesting
rice crops. Bare land was mainly located in My Hung,
Thanh Phu and Hoa Loi communes (i.e. harvested paddy
fields), and sandy dunes located along the seaside (Fig. 4C).
Aquaculture and fallow ponds
Land use/land cover is classified into six types, namely
paddy field (i.e. mono and triple crops), sandy soil,
residential area, rice-shrimp rotation farming, perennial
plant (i.e. orchard and mangrove forest) and aquaculture.
The aquaculture area was extracted from the LULC map.
It is located in the southeast part (i.e. both in the central
and coastal areas) of Thanh Phu district; its distribution
is denser than in the coastal zones. The total aquaculture
area of 13,093.65 ha consists of extensive-intensive shrimp
farming.
The fallow area was also extracted by superimposing the
water surface and bare land layers. A fallow shrimp pond
assumed shrimp cultivation in 2015 and halted this activity
in 2016. Thus, the fallow shrimp pond was detected when
its attribute data had both water-surface and bare-land in
2015 and 2016, respectively. The total fallow aquaculture
area was 581.49 ha, which accounted for 4.44% of the total
aquaculture area. Generally, the fallow aquaculture ponds
were distributed randomly in the study area, and their
distribution was almost along the seashore (Fig. 5).
Fig. 6. Random points in the aquaculture area.
Accuracy assessment
Land use map utilized the aquaculture layer (Ben Tre
DNRE, 2015) as truth data to assess the accuracy and collate
the classified results and survey on 100 ground truth points.
A total of 77/100 correct points (Fig. 6) demonstrated the
overall accuracy achieved, with a high reliability of 77%.
Determining the fallow area in ecological regions
Thanh Phu district comprise four natural ecological
regions. The detailed characteristics of each ecological
region are presented in Table 2, highlighting the differences
in saline concentration. Ecological region 1 has a freshwater
ecosystem that is suitable for farming systems of rice crop,
orchard, giant freshwater prawn and freshwater fish culture.
The rest of the ecological regions (i.e. regions 2, 3, and 4)
have a brackish water ecosystem that is appropriate for
rice-shrimp rotation farming and shrimp cultivation such
as extensive shrimp, intensive shrimp and shrimp-blood
cockle combination.
Table 2. Ecological region in Thanh Phu district.
Fig. 5. Distribution map of aquaculture and fallow aquaculture
ponds.
Region
ASSD (cm)
Salinity
(o/oo)
Flood level
(cm)
Area (ha)
1
No (<50)
<4
0-40
3,211.6
2
No
4-10
0-20
8,210.3
3
No (>50)
10-20
0-40
6,993.0
4
No
20-30
0-40
17,171.6
*Note: ASSD: acid sulphate soil depth.
Source: Ben Tre Department of Agriculture and Rural
Development, 2015.
JUne 2019 • Vol.61 Number 2
Vietnam Journal of Science,
Technology and Engineering
39
*Note: ASSD: Acid sulphate soil depth.
Source: Ben Tre Department of Agriculture and Rural Development, 2015.
Fallow aquaculture covered about 581.49 ha, and the area increased from
ecological
regions
1 to 4 (Fig. 7). The fallow shrimp pond area in region 1 merely
| Engineering
Physical
Sciences
accounted for 0.18%; on the contrary, the area of region 4 reached 429.84 ha and
accounted for more than 70% of the total area of the fallow area (Fig. 8).
500
429,84
450
400
Area (ha)
350
300
250
200
150
93,25
100
50
0
Fallow
ponds zone.
in each
Fig. 7.Fig.
Fallow7.
ponds
in each ecological
zone.
1,02
1
30,05
2
3
Ecological zone
4
8. Distribution
fallow aquaculture byof
ecological
region.
ecologicalFig. Fig.
8. ofDistribution
fallow
aquaculture by ecological region.
Fallow aquaculture covered about 581.49 ha, and the able to detect only the shrimp ponds where farmers had lost
Discussion
area increased from ecological regions 1 to 4 (Fig. 7). The income, that is, fallow ponds in 2016. The other ineffective
fallow shrimp
pond area
in regionin
1 merely
accountedclassification
for ponds that were still covered by water surface would not
Remote
sensing
aquaculture
0.18%; on the contrary, the area of region 4 reached 429.84 be recognized on the remotely sensed imagery. Similarly,
ha and accounted for more than 70% of the total area of the the intensive and extensive aquaculture systems could not
be distinguished through the imagery. The remote sensing
fallow area (Fig. 8).
technique could detect both the general aquaculture areas
Discussion
and the fallow ponds. However, some of LULC types
Remote sensing in aquaculture classification
mixed together-triple rice-orchard and rice shrimp rotationmangrove forest-could not be classified in more detail using
In terms of the satellite resolution and land use map scale
a single Landsat image. The use of a multi-series imagery
for district level, a district with the total area larger than
could improve this limitation. High-resolution imagery and
12,000 ha should be mapped in the scale of 1:25,000 [15].
object-based image analysis via object texture are expected
Hence, in theory, Landsat 8 imagery with a 30-metre spatial
to distinguish extensive and intensive shrimp farming (i.e.
resolution merely achieves the map scale of 1:60,000 [16,
industrial shrimp farming).
17], and it is merely suitable for provincial maps. However,
the Thanh Phu district area is approximately 40,000 ha
Ineffective shrimp in Thanh Phu district
(i.e. nearly four times the size of the standard). Thus, the
According to the published references, the giant tiger
result map could be accepted in the context of freely highprawn (Penaeus monodon) adapts to salinity from 5 to 31‰
resolution imagery is not available. The research period
[19], whereas the white leg shrimp (Penaeus vannamei)
was from 2015 to 2016; hence, Sentinel-2 imagery with
adapts to salinity from 7 to 34‰ [20]. Thus, brackish
a 10-metre resolution was unavailable at the beginning
shrimp culture could be effectively cultivated in ecological
of the research period. In further studies, the resolution
regions 2, 3, and 4. However, the region with the highest
of Landsat-8 imagery could be enhanced by combining
salinity (i.e. region 4: 20 to 30‰) is the most vulnerable
multispectral bands and panchromatic band to obtain a
region. The prolonged sunny season (e.g. 2016) and lack
higher spatial resolution of 15 metres (corresponding to the
of freshwater increased the water salinity in shrimp ponds
scale of 1:30,000).
and exceeded the highest level of salinity to which shrimps
The research identified the highly accurate aquaculture could effectively adapt. Therefore, high water salinity
area including effective shrimp and fallow shrimp farms. influenced the survival rate and productivity of shrimp and
The fallow shrimp pond (fallow pond) was objectively adversely affected the incomes of farmers. Finally, the area
detected through the integration of spectral indices instead of the fallowed aquaculture ponds located in region 4 was
of visual classification [18]. However, the research was rationally higher than the rest of the ecological regions.
40
Vietnam Journal of Science,
Technology and Engineering
JUne 2019 • Vol.61 Number 2
Physical sciences | Engineering
Aquaculture cultivation in Thanh Phu district continues
to encounter obstacles emanating from adverse weather
conditions in the dry season, which increases temperatures
and water salinity levels. Moreover, heavy rain, high
salinity, pH and alkalinity change rapidly affect water
quality, which consequently slows down shrimp growth.
Market prices are the most serious problem in Thanh Phu
district where selling prices are lower than product prices.
The prices of aquatic fingerlings are relatively high. Thus,
merely 50% of the farmers used quality aquatic fingerlings
for their farming, whereas other farmers had no stocks of
aquatic fingerlings on their farms. Hence, the randomly
identified fallow shrimp pond was presented in the context
of the farmers’ decision to halt the cultivation.
Conclusions
This research examines the spatial distribution of
aquaculture and fallow aquaculture ponds in Thanh Phu
district, Ben Tre province by using the three indices of
NDVI, MNDWI and NDBaI. The accuracy is assessed at
77%, which indicates the capacity of remote sensing in
general aquaculture detection.
Moreover, fallow aquaculture ponds are commonly
distributed in ecological region 4 (more than 70% of the
total aquaculture area). High water salinity also affects this
ecological region. The research reveals the aquaculture
zones and fallow ponds, which correspond to water salinity
by ecological region.
The suggestions for further research are related to the
improvement of techniques and reduction in risk in the
ineffective aquaculture region.
ACKNOWLEDGEMENTS
We would like to thank the intern-student from
Suan Sunandha Rajabhat University for her assistance
and performance. We are also grateful to the Ben Tre
Department of Agriculture and Rural Development and
Fisheries Department for providing the primary data and
field survey. Our special thanks go to the staff of the Land
Resources Department of the College of Environment and
Natural Resources at Can Tho University, Vietnam, for their
invaluable support during our research.
The authors declare that there is no conflict of interest
regarding the publication of this article.
REFERENCES
[1] Trai. N. Van (2013), Detailed plaining of Aquaculture on Binh
Dai, Ba Tri and Thanh Phu district to 2020.
[2] Ben Tre People’s Committees (2011), Impact assessment,
detailed climate change scenarios in Ben Tre and recommend
response solutions.
[3] Ben Tre People’s Committees (2010), General report the
overall planning of economic - social development in Ben Tre
Province in 2020.
[4] Prime Minister (2011), Decision 83/QD-TTg: Approving the
master plan of economic - social development in Ben Tre province
in 2020.
[5] Khoa. L. Van, N.T.C. Su, V.Q. Minh, P.T. Vu (2013), “Agroecological zoning according to hydrology, pedology and present land
use for coastal districts in Ben Tre province”, Can Tho University
Journal of Science, 26, pp.227-236.
[6] Thanh Phu People’s Committees (2010), Review Report about
economy and society in Thanh Phu district in 2005, 2006, 2007, 2008,
2009, and 9 beginning months of 2010.
[7] US. Geological Survey (2013), Landsat Quality Assessment
Band, />[8] B. Kim, Y. Han, Y. Kim (2012), Generation of cloud-free
imagery using Landsat-8.
[9] C.J. Tucker (1979), “Red and photographic infrared linear
combinations for monitoring vegetation”, Remote Sensing of
Environment, 8(2), pp.127-150.
[10] S.K. McFeeters (1996), “The use of the Normalized
Difference Water Index (NDWI) in the delineation of open water
features”, International Journal of Remote Sensing, 17(7), pp.14251432.
[11] H. Xu (2006), “Modification of normalised difference water
index (NDWI) to enhance open water features in remotely sensed
imagery”, International Journal of Remote Sensing, 27(14), pp.30253033.
[12] R. Bouhennache, T. Bouden, A.A. Taleb, A. Chaddad (2015),
Extraction of urban land features from TM Landsat image using the
land features index and Tasseled cap transformation, http://www.
inase.org/library/2015/barcelona/bypaper/ELECTR/ELECTR-22.
pdf.
[13] A.R. As-Syakur, I.W.S. Adnyana, I.W. Arthana, I.WW.
Nuarsa (2012), “Enhanced built-up and bareness index (EBBI) for
mapping built-up and bare land in an urban area”, Remote Sensing,
4(10), pp.2957-2970.
[14] N. Horning (2004), Overview of accuracy assessment of land
cover products Version 1.0, American Museum of Natural History,
Center for Biodiversity and Conservation.
[15] Ministry of Natural Resources and Environment (2007),
Decision 22/2007/QD-BTNMT: Issue regulations on establishment of
land use map.
[16] W.R. Tobler (1987), “Measuring spatial resolution”, Land
Resources Information Systems Conference, pp.12-16.
[17] W.R. Tobler (1988), “Resolution, resampling, and all that”,
Building Data Bases for Global Science, pp.129-137.
[18] N. Van Thao, N.D. Cu, and N.X. Thanh (2012), “Maping and
detecting fallowed area of cultivated tiger shrimp ponds of coastal
provinces by using remote sensing data”, J. Mar. Sci. Technol., 12(3),
pp.34-45.
[19] The National Fisheries Promotion Center (2006), Cultivation
techniques for intensive giant tiger prawn (Penaeus monodon),
Publishing house of Agriculture.
[20] Agricultural Extension Center Hochiminh city (2009),
Handbook: Whiteleg shrimp cultivation (Penaeus vannamei).
JUne 2019 • Vol.61 Number 2
Vietnam Journal of Science,
Technology and Engineering
41