Arthropods and their Conservation in India (Insects Spiders)
Bạn đang xem bản rút gọn của tài liệu. Xem và tải ngay bản đầy đủ của tài liệu tại đây (5.69 MB, 234 trang )
envis
Wildlife and protected areas
The
Environmental
Information
System
(ENVIS)
Centre
at
the
Wildlife
Institute of India, set up in September 1997, is part of the ENVIS setup of the Ministry of Environment and Forests, Government of India. It deals with general matters
concerning ‘wildlife’ and specifically those related to ‘protected area’. Its objectives
are to :
Establish a data bank on information related to wildlife and wildlife
protected areas, and thereby build up a repository and dissemination centre for
information on wildlife science;
Promote national and international cooperation, and exchange of wildlife related
information;
Provide decision makers at the apex level with information related to
conservation and development.
ENVIS BULLETIN
Wildlife and Protected Areas
Project Leader
P. R. Sinha
Project Coordinator
V. B. Mathur
Project Co-coordinator
S. A. Hussain
Senior Research Fellow
Shazia Quasin (Feb 2012 - Feb 2013)
Anant Pande (April 2013- onwards)
Project Assistant
Jyoti Prasad Nautiyal
Advisory Committee
P. K. Mathur
B. C. Choudhury
K. Sivakumar
Y. S. Verma
R. Thapa
K. K. Shrivastva
Dinesh S. Punder
Wildlife Institute of India
Chandrabani, Dehradun-248001, India
Tel.: +91 135 2640111-115, Fax.: +91 135 2640117
Email.: ,
ENVIS Bulletin:
Arthropods and
their Conservation
in India
(Insects & Spiders)
envis
Wildlife and protected areas
Arthropods and their Conservation in India
(Insects & Spiders)
Website.: , />
The contents of the bulletin may be freely used for non-commercial
purposes with due acknowledgement
CITATION
V.P. Uniyal and Aseem Shrivastava (Eds.) 2012. Arthropods
and their Conservation in India (Insects & Spiders), ENVIS
Bulletin : Wildlife & Protected Areas. Vol. 14, 2011. Printed in 2013;
Wildlife Institute of India, Dehradun-248001, India.
COVER PHOTOS BY
Abesh Sanyal & V.P. Uniyal
EDITORIAL PROECESSING
Jyoti Prasad Nautiyal & Rajeev Thapa
PROOF EDITOR
Mr. Kumaran Sathasivam,
Palladium Documentation, C - 14,
Casa Granda, 13 & 14 Ellai Amman Koil Street,
Chennai, Tamil Nadu - 600020
ENVIS Bulletin is also available on
; />
the
internet
at
Vol. 14, No1. 2011
ENVIS
BULLETIN
Wildlife and protected areas
Arthropods and their Conservation
in India (Insects & Spiders)
EDITORS
V.P. Uniyal
Aseem Shrivastava
SENIOR RESEARCH FELLOW
Shazia Quasin (Feb 2012 - Feb 2013)
Anant Pande (April 2013- onwards)
PROJECT ASSISTANT
Jyoti Prasad Nautiyal
CONTENTS
Foreword
Editor’s Note
Higher Taxa Surrogacy and Efficiency in Spider
Conservation: A Case Study from Terai Conservation Area, India
Upamanyu Hore & V.P. Uniyal
09-20
Spider Diversity Attributes in a Cultural Landscape Dominated by
Field Crops and Fruit Orchards in the Konkan Region of Maharashtra
Vinayak K Patil
21-33
Pollinators in Changing Landscape of Agriculture: Global and
Indian Scenario
Parthiba Basu & Mahua Ghara
34-37
High Altitude Butterfly Fauna of Gangotri National Park,
Uttarakhand: Pattern in Species, Abundance Composition and Similarity
Manish Bhardwaj & V.P. Uniyal
38-48
Climate Change Adaptation and Honeybees in
Mountain Regions
Harish K Sharma & Uma Partap
49-53
Conservation of Spiders in India
Ganesh Nanu Vankhede
54-59
Challenges for Taxonomy in Indian Context
H.V. Ghate
60-66
Indian Insect and Spider Diversity: Richness Estimates Based on
True Flies of the Western Ghats, and a Protection Status Assessment
Kumar Ghorpadé
67-86
Role of Butterfly Gardens in Promoting Biodiversity
Conservation and Ecotourism
George Mathew, Elizabeth George & Mary Anto
87-97
Studies of Tiger Beetles. CCII. Indian Tiger Beetle Conservation
(Coleoptera: Cicindelidae)
Fabio Cassola
98-107
Assessment of Environmental Stresses on Himalayan Wetlands by
Morphological Deformities in Chironomidae (Insecta :Diptera)
Girish Maheshwari & Geeta Maheshwari
108-113
Diversity and Indicator Species of Moth (Lepidoptera: Heterocera)
Assemblages in Different Vegetation Zones in Gangotri Landscape,
Western Himalaya, India
Abesh Kumar Sanyal, V.P. Uniyal, Kailash Chandra & Manish Bhardwaj
114-129
Impact of Environmental Condition on Egg Laying Behaviour of
Eri Silkworm, Cynthea Ricini Donovan
B.K. Negi & R.K. Pant
130-134
Review of Indian Lepidoptera Collections and Their Significance in
Conservation
Peter Smetacek
135-139
Rarity in Oak Forest Butterflies of Garhwal
Arun P. Singh
140-146
Role of Entomology Outreach Education in
Developing Insect Interest Groups in India
V.Shubhalaxmi & Isaac Kehimkar
147-158
Spider Fauna in the Forest and Agricultural Ecosystems of Central Kerala, India
P.A. Sebastian, M.J. Mathew & S. Murugesan
159-174
Mygalomorphs of India: An Overview
Manju Siliwal, Sanjay Molur & Robert Raven
175-188
Insect Fauna of States and Union Territories in India
Kailash Chandra
189-218
Spider Diversity Along Altitudinal Gradient & Associated Changes in
Microclimate Attributes in Nanda Devi Biosphere Reserve,
Uttarakhand, India
Shazia Quasin & V.P. Uniyal
219-232
ENVIS Bulletin:
Arthropods and
their Conservation
in India
(Insects & Spiders)
7
Editor’s Note
Having existed for more than 400 million years after surviving the Permian and Cretaceous mass
extinction, arthropods have been the most successful group of all living beings and along with
other invertebrates constitute more than three-fourth of today’s global biodiversity. Despite such
richness of species and their role in all ecosystems, much of the world beyond taxonomists
and entomologists does not realize the benefits accrued from conserving arthropods. Much
of the perception of human kind beyond this academic horizon about the arthropods is only
as pest or as some harmful elements. The current global conservation attention is primarily on
charismatic mega-vertebrate fauna, the invertebrate/arthropod conservation has yet to fully join the
mainstream of global biodiversity conservation efforts and in words of R. Dunn, arthropod
conservation always remains the awkward “kid sister of vertebrate conservation.”
Numerous recent developments taking place worldwide in taxonomy, inventorying, monitoring,
data compilation, statistical analysis and science communication are facilitating in overcoming
these impediments to plan effective in-situ conservation and in both policy and practice. In India,
there are still enormous opportunities for original research in this particular subject to generate
baseline data which are crucial for conservation planning of arthropods. In view of this, the
Wildlife Institute of India, decided to come up with an issue of ENVIS Bulletin titled “Arthropod
and their conservation in India (Insects & Spiders)” with the hope to provide a snapshot of
current research trends and future needs in this particular aspect of biodiversity conservation. We
have solicited papers from eminent scholars to cover all possible facts and facets of arthropod
conservation especially on issues and challenges. Special emphasis has been on the state of
our current knowledge of diversity of insects and spiders viz. challenges for taxonomy in Indian
context and review of Indian lepidoptera; diversity and attributes of spiders in human-dominated
landscape and overview of Mygalomorph diversity of India.
This issue of ENVIS includes a review on important order of insects i.e. Lepidoptera by having
papers on rarity of oak forest butterflies, patterns in species composition and abundance of
high altitude butterfly fauna and diversity and indicator species of moths in different vegetation
zones. We have also included a paper on the role of butterfly garden in promoting biodiversity
conservation and role of entomology outreach education in developing insect interest groups in
India.
Overall, we have covered all the important issues on arthropod conservation in Indian scenario.
We thank all the authors and reviewers who kindly agreed to contribute to this issue and
collectively bring their vast knowledge and expertise to generate more information on status,
biology of arthropods and deliver them to policy/decision makers and stakeholders for effective
conservation. The document could be of immense use as reference for the information needed
in conservation planning.
We would like to request for your feedback on the contents and quality of this issue.
This voluminous and important information on poorly known taxa as lower invertebrate could
motivate many more researchers in this field.
V.P. Uniyal
Aseem Shrivastava
ENVIS Bulletin:
Arthropods and
their Conservation
in India
(Insects & Spiders)
8
Vol. 14, No1. 2011
9
HIGHER-TAXA SURROGACY
AND EFFICIENCY IN
SPIDER CONSERVATION: A CASE
STUDY FROM TERAI
CONSERVATION AREA, INDIA
Upamanyu Hore1 and V.P. Uniyal2
1. Amity School of Natural Resources and Sustainable Development, Amity University, Noida, Uttar Pradesh.
email : /
2. Wildlife Institute of India, Chandrabani, Dehradun.
email :
ABSTRACT
The establishment of a strong relationship between species richness and a surrogate index is a critical issue in conservation
biology. Such a relationship could provide the basis for the establishment of cost-effective and easy-to-monitor methods for
measuring biodiversity, providing an alternative for prioritization of sites for conservation. Both family and genus richness are
tested for their ability to predict the number of spider (Araneae) species independent of sampling detection, spatial autocorrelation,
area, geographical location and type of habitat. Data from two protected areas of Terai Conservation Area (TCA) were used as
a test case. Genus richness is considered to be a good surrogate of species richness, despite some caution being needed
regarding comparison of sites with considerably different sampling effort. Genus alone is found to be reliable indicator for
ranking sites according to taxa richness or for determining near-minimum sets of sites for conservation. This study
recommends surrogacy at this higher taxonomic level as a promising approach for prediction of spider species richness or
evaluation and ranking of areas according to conservation importance.
INTRODUCTION
Biodiversity on Earth is rapidly diminishing, and conservation biologists are struggling to catalogue and preserve what remains
of it. The rapid decline in biodiversity and practical challenges in describing and enumerating it rigorously enough, including the
money, effort, expertise and time involved (May, 1994), have urged conservation biologists to rely on surrogates for explaining
patterns in biodiversity. Such approaches try to overcome the problem of the enormous amount of resources (e.g. time, money,
taxonomists) required to reach close-to-complete inventories, if at all such a goal is possible to achieve. Among the most
popular of these approaches is the use of higher-taxa surrogates, as proposed by Gaston and Williams (1993; see also
Williams, 1993; Williams and Gaston, 1994). Others include the use of indicator (or surrogate) groups of overall richness (e.g.
Pearson and Cassola, 1992; Beccaloni and Gaston, 1995; Prendergast and Eversham, 1997) and the inference of diversity
from available information on environmental variables (e.g. Braithwaite et al., 1989; MacNally et al., 2003). Despite all the pros
and cons that these have, the higher-taxon approach has several advantages, allowing information to be obtained on a large
number of taxa with relatively little effort and use of resources. Another crucial advantage is the retention of broad biological
information, which allows distribution patterns to be understood (Eggleton et al., 1994; Williams et al., 1994; Gaston et al.,
1995) and conservation priority areas to be defined more efficiently (Williams, 1993; Williams et al., 1994; Vanderklift et al.,
1998), which is, after all, the ultimate goal of conservation biology. The higher-taxon approach has been used at both local and
regional scales (Gaston et al., 1995; Larsen and Rahbek, 2005), and use of this approach could be highly demanding in
terms of performing direct species measurements. Although most previous work points to reliability in the use of higher-taxa
surrogacy in many different kinds of organisms (Williams and Gaston, 1994; Williams et al., 1994; Gaston and Blackburn, 1995;
Vanderklift et al., 1998; Balmford et al., 2000), caution should be exercised when applying the method and interpreting results
ENVIS Bulletin:
Arthropods and
their Conservation
in India
(Insects & Spiders)
since the method is subject to a series of limitations such as sampling effort, data quality, habitat type, geographic location and
spatial autocorrelation (Gaston and Williams, 1993; Andersen, 1995; Grelle, 2002; Cardoso et al., 2004).
Nearly all studies of higher-taxa surrogates have simply looked at the extent of correspondence between the richness of areas
measured at different taxonomic levels. But efficient reserve networks consist not just of rich sites but of sites that are rather
different from one another biotically and that, therefore, exhibit high between-site complementarity (Pressey and Nicholls, 1989;
Pressey et al., 1993; Williams, 1998). Hence a full evaluation of the utility of the higher-taxon approach for reserve planning
should include a consideration of the degree of cross-level correspondence in patterns of complementarity as well as richness
and an assessment of how well entire reserve networks designed using information on genera or families manage to capture
species-level diversity (Vane-Wright and Rahardja, 1993; Williams, 1993; Balmford et al., 1996a). One critical limitation is that
even those tests that have addressed these other concerns have nearly always targeted relatively species-poor groups such
as birds and mammals (Balmford et al., 1996a). This is not surprising as very few good-quality, local-scale data sets of highly
speciose groups such as insects and arachnids currently exist. Nevertheless, rapid assessment methods are obviously most
needed for megadiverse groups, for which a shortage of expertise is compounded by the long time required to sort records
down to the level of species (Bloemers et al., 1997; Lawton et al., 1998).
With this work, we intend to provide evidence of the possible usefulness of the higher-taxa surrogacy approach with spiders in
the Terai, testing it as a species richness predictor. We also consider the effects of environmental and methodological factors on
the validity of predictions. Finally, we test the use of this kind of surrogacy as a tool for reliable definition of conservation priority
sites, either by ranking them according to taxa richness or by considering the complementarity of known taxa between sites to
examine how well subsets of our sites capture species-level diversity when using information on species, genera, families and
orders. The species richness of spiders and their respective spatial distributions are virtually unknown in India, with a certainly
very low figure of 1520 species registered for the country (Sebastian and Peter, 2009). Although not even higher-taxa data are
available for most of the country’s territory, given the difficulty in identification of species, many remaining to be described or
discovered, it seems advisable to test for future use such potential tools as different surrogates of biodiversity.
METHODS
Fieldwork design was implemented to test for several effects that can influence the higher-taxa surrogates approach—
geographical location, type of habitat and sampling effort. Two protected areas of the Terai Conservation Area (TCA) under the
jurisdiction of Dudhwa Tiger Reserve, one in the north—Dudhwa National Park—and the other in a nearby area in the south—
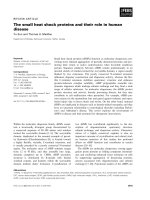
Kishanpur Wildlife Sanctuary were sampled in 2006–2007 (Fig. 1).
Figure 1.
Map showing sampling sites in TCA
10
Vol. 14, No1. 2011
11
For simplicity, these two areas are simply referred to hitherto as belonging to northern and southern geographical regions.
Ideally, all sites in all protected areas were sampled during the same year. We chose such areas because of their high
habitat diversity. By comparing the two regions, the geographical effects on the surrogacy methods could be tested. In each
area, we sampled several sites, a total of 10, trying to cover a majority of the most significant habitats represented. This way,
we also considered the habitat effect by differentiating sites with arboreal cover from those without and those with “natural”
vegetation from the ones dominated by introduced vegetation or under severe human influence or management. Ten major
vegetation types were identified, and two sampling sites per vegetation type were selected for spider sampling. The size of the
sampled sites ranged from 1.8 to 13.3 km2. Spiders were sampled along 50 m transects using pitfall traps and
semi-quantitative sampling. Ten transects were placed randomly within each vegetation type. Pitfall sampling was carried out for
64 weeks, and other semi-quantitative sampling methods were used on 64 occasions (once every week) at the same sampling
sites. The pitfall traps consisted of cylindrical plastic bottles of diameter 10 cm and depth 11 cm (Churchill and Arthur, 1999).
Six pitfall traps were laid along each transect line at intervals of 10 m. Traps were filled with preservative (69% water, 30% ethyl
acetate, and 1% detergent). After seven days, the specimens were removed from the traps. This allowed us to maintain the spider
specimens in a good condition before they were processed in the laboratory and identified. Semi-quantitative sampling involves aerial
sampling; ground collection; beating; litter sampling; or sweep netting. Each sampling method involved 1 hour of active
sampling, measured using a stopwatch.
ANALYSIS
To test if either family or genus richness can be reliably used to predict species richness, regression analysis was performed
over all the available data. Linear, log-log and exponential regression were tested. We used both the percentage of variance
explained by the independent variable and visual evaluation of the scatter plots as measures of adjustment, surrogacy reliability
and predictive power. Searching for the possible influence of sampling detection, geographical location and habitat type on
the surrogacy results, we also adjusted regression lines after separating the sites according to their characteristics, one factor
at a time. Analysis of covariance (ANCOVA) was carried out to test for statistically significant differences between regression
lines. If differences were found, the factor involved was considered to potentially influence the reliability of surrogacy. The SPSS
16.0 software package was used for statistical analysis. We estimated the relationship between study site areas. In order to
test if the study site area affected the relationship between species richness and higher-order richness, we regressed the
residuals of the relationship with the site area. The pattern of diversity is known to be spatially autocorrelated (Lennon et al., 2001).
Autocorrelation distorts systematically the classical tests of association and can generate misleading results—correlation
coefficients, regression slopes and the associated significance tests (Clifford et al., 1989; Lennon et al., 2001). To avoid this,
we applied the modified correlation test of Clifford et al. (1989), which corrects the significance of the Pearson correlation
coefficient for the spatial dependency within and between the two patterns examined. This correction uses the concept of
“effective sample size”. This is the equivalent sample size for the two patterns when the redundancy produced by spatial
autocorrelation is removed. In the present study, the effective sampling size was always equal to or close to the real sample
size, and thus the spatial autocorrelation did not affect the estimated level of statistical significance.
Two approaches were tested for prioritisation and ranking of sites for conservation. The first approach is scoring approach,
which uses the raw number of taxa represented in each site as the sole value for ranking sites (Table 1). The Spearman rank
correlation index was used to test for surrogacy reliability in the scoring of sites. In addition, scatter plots of family and genus
richness versus species richness ranking of sites were used for visual inspection of reliability. The second approach we tested
a more efficient iterative approach of conservation priority ranking. For each of the considered taxonomic levels (family, genus
and species), we first choose the site with the highest species richness and then calculate the complementarity richness by
counting the species that are not already present. Subsequently we choose a site with the highest complementarity and repeat
the procedure until all the species are represented in the data matrix. Finally we reorder the sites by complementarity richness
and chose the richest site (combining the value of species richness and complementarity) and from it, in a stepwise manner, the
one site that would further raise the number of represented taxa was added to the set of sites to be considered for protection.
In case of ties, we chose the most species rich site in the respective taxa. By doing so, we tested the effect of using higher taxa
for choosing a near-minimum set of sites that potentially preserves the maximum number of species.
RESULTS
A total of 186 species belongs to 77 genera and 27 families were collected during the entire sampling period. Of these, 67
species (36% of all species) belong to morphospecies. The Terai spider assemblage represents 20% of all genera described
from India, which is very rich. The nomenclature adopted consistently follows Platnick’s (2008) world spider catalogue.
SPECIES RICHNESS PREDICTION
CHOOSING THE BEST SURROGATE
After fitting all previously defined regression types—linear, log-log and exponential—to family and genus taxonomic levels, we
chose the ones with the highest regression coefficient value. A non-linear exponential relationship was found for the families
HIGHER-TAXA SURROGACY AND EFFICIENCY IN SPIDER CONSERVATION:
A CASE STUDY FROM TERAI CONSERVATION AREA, INDIA
ENVIS Bulletin:
Arthropods and
their Conservation
in India
(Insects & Spiders)
and a linear relationship for the genera (Fig. 2). Both taxonomic levels present a highly significant relationship with the number
of species (n = 20, p < 0.001); however, the genus richness seems to have a much better predictive power, with a high r2 value.
Figure 2 a.
(a) Exponential relationship between family and
species richness;
Figure 2 b.
(b) linear relationship between genus and species
richness in all 20 sites sampled for spiders in the
study area
INFLUENCE OF FACTORS
Since genus richness was found to have high predictive power and has a linear relationship with species richness, in subsequent
tests for influence of factors on taxonomic level, only genus-level data were considered. Comparing the regression lines of sites
representing different detection (captured ratio for individuals per species) level for individual species was found significantly
different (n = 20, p < 0.05) (Fig. 3a). This was to be expected as the heterogeneity in the detection probabilities of different
species capture varies with local and regional species pools. The same did not happen with other factors, whose differences
were not found to be statistically different.
Regression-based analysis demonstrated only a weak correlation between area and different taxonomic levels for all classes
(r2 = 0.123 and 0.204, respectively). The correlation between area and the residuals of the relationship between species richness
and higher-taxonomic-level richness was not significant (a = 0.001).The spatial autocorrelation among sites seems to be not
a significant effect since the effective sample size deviated only slightly from the real sample size without altering the results.
12
Vol. 14, No1. 2011
13
Figure 3 a.
(a) Comparison of the relationship between genus richness
and species richness between sites with high (open
squares) and low (filled squares) detection;
Figure 3 b.
(b) comparison of sites in the northern (filled squares) and
southern (open squares) regions;
Figure 3 c.
(c) comparison of sites with (filled squares) and without
(open squares) arboreal cover;
HIGHER-TAXA SURROGACY AND EFFICIENCY IN SPIDER CONSERVATION:
A CASE STUDY FROM TERAI CONSERVATION AREA, INDIA
ENVIS Bulletin:
Arthropods and
their Conservation
in India
(Insects & Spiders)
Figure 3 d.
(d) comparison of “natural” areas (open squares)
and those under intense human influence (filled
squares).
CROSS-LEVEL CORRELATIONS IN COMPLEMENTARITY
There was good congruence in the complementarity patterns measured in terms of species and genera but not across families
(Fig. 4b). The between-site complementarity of species was quite closely related to the between-site complementarity of genera
(r2 = 0.84, n = 0 pairs of sites, p < 0.001); thus sites with very different spider species also had very different spider genera,
and vice versa. However, the species-level complementarity could be far less closely predicted compared with the family-level
complementarity (for species vs families, r2 = 0.44, n = 20, p < 0.10). These results were apparently not confounded by variations
in the difference in area of paired sites (since pairs are of widely differing size).Thus, it appears that the match in how well sites
complement each other when assessed in terms of species and genera is real and, alongside congruence in richness, explains
why sets of sites identified using spider genera do so well at representing spider species.
Figure 4 a.
Cross-level congruence in the complementarity of pairs of sites in the study area: a) species vs genera
14
Vol. 14, No1. 2011
15
Figure 4 b
(b) species vs families. Complementarity scores are calculated as the number of species or genera or families found at just one or
the other site, divided by the combined total found at either or both (Colwell and Coddington, 1994).
Cross-level congruence in the complementarity of pairs of sites in the study area:
CONSERVATION PRIORITY
Scoring Approach
Using the rank of sites according to their taxa richness, families were found to have a low predictive power of species-based site
ranking (Table 1), despite the high Spearman rank correlation value of 0.855. Examination of the rank scatter plot (Fig. 5b) also
leads to conclusions about the low reliability of the family surrogacy approach. Genera, in contrast, seem to rank sites in much
the same way as species do (Table 1) (Spearman rank correlation = 0.962). Predictive power is especially high at the highest
and lowest ranked sites, not being as good at the middle ones (Fig. 5b).
Table 1. Taxa richness of sampled sites and respective ranking
Site
Richness
Species
Genera
Rank
Families
Species
Genera
Families
grsk2
45
27
13
1
3
4
pssk1
45
25
10
1
4
7
grsd2
44
31
17
2
1
1
rpsd2
44
28
10
2
2
7
pssd2
42
25
11
3
4
6
grsk1
41
31
15
4
1
3
mssd2
41
27
13
4
3
4
rpsk1
39
24
9
5
5
8
rpsd1
36
22
12
7
6
5
HIGHER-TAXA SURROGACY AND EFFICIENCY IN SPIDER CONSERVATION:
A CASE STUDY FROM TERAI CONSERVATION AREA, INDIA
ENVIS Bulletin:
Arthropods and
their Conservation
in India
(Insects & Spiders)
rpsk2
36
25
11
7
4
6
mssk1
32
21
10
8
7
7
pssd1
31
21
10
9
7
7
grsd1
30
24
16
10
5
2
mssd1
30
14
8
10
10
9
mssk2
29
21
12
11
7
5
plsd2
23
15
8
12
9
9
plsk1
19
15
8
13
9
9
plsk2
10
7
4
14
11
11
plsd1
7
6
5
15
12
10
Figure 5 a.
(a) Comparison of site ranking according to family
and species richness;
Figure 5 b.
(b) comparison of site ranking according to genus
and species richness
16
Vol. 14, No1. 2011
17
ITERATIVE APPROACH
Although a scoring approach to site ranking can be evaluated for future use, it is not the most efficient method for establishing
conservation networks of sites. Complementarity is a fundamental issue to be taken into account. Thus, scoring of sites
was not done simply according to their richness values but according to which ones will protect the maximum number of
species not included in previously chosen sites. By using accumulation curves, the effects of adopting this approach for the
different taxonomic levels can be carefully considered. The objective is to check what proportion of species can be protected by
using the same number of sites that protects all considered higher taxa. Genus-level data were chosen for this analysis since it
fitted best with the species algorithm. The number of sites (13 sites; 65% of all sites sampled) necessary to include all genera
is enough to protect, at most, 90% of the species (Fig. 6).
Figure 6.
Accumulation curves of the number of taxa represented by adding sites in a stepwise manner,
considering the complementarity algorithm
DISCUSSION
The results of the study suggest that only genus richness can be used as a significant and reliable surrogate of species richness,
with a much higher regression coefficient value and predictive power compared with families. Its linear relationship is also simpler
than the more complex, non-linear, exponential relationship that family richness has with species richness. Previous studies
also recognize the same strong relationships between species and genera richness, while several studies highlight caveats on
the use of family richness (Williams and Gaston, 1994; Gaston and Blackburn, 1995; Balmford et al., 1996a, 1996b; Roy et al.,
1996; Grelle, 2002; Cardoso et al., 2004; Bergamini et al., 2005). However, there is evidence demonstrating family richness to
be an equally good predictor of species richness (Williams et al., 1994; Negi and Gadgil, 2002; Báldi, 2003). Given the findings
of strong correlation and predictive power between higher-taxonomic-level richness and species richness, this study concluded
that genus-level richness could be used in describing patterns of species diversity. However, caution should be exercised
regarding the decision on the taxonomic level to be used in a similar analysis, which should be based on a preliminary analysis
undertaken at the region of interest. This is mainly because the responses of organisms to environmental variability differ for the
same group of species from region to region.
Species richness is known to increase as the sampling area and environmental variability (here measured as habitat diversity)
increase. In the present study, the relationship between species richness and area or habitat diversity was found to be generally
weak. Neither geographical location nor area nor habitat was found to have significant influence over the usefulness of higher-taxa
surrogacy at the genus level. When the sampling effort is the same, the only factor found that may limit the use of higher-taxa
surrogacy is imperfect detection of species in single or multiple sites.
Because species are detected imperfectly, some species that were not detected at the site may have in fact been present (i.e.,
a false absence), while others could be genuinely absent from the site (i.e., not part of the local community during that sampling
period). Repeated surveys are needed to estimate the detection probability, and the assumptions that need to be fulfilled are
(1) the occupancy status of the site for each species does not change during the season and (2) changes occur completely
at random (i.e., the members of the local species pool present at the site are constant during the sampling period) (MacKenzie
et al., 2006).
HIGHER-TAXA SURROGACY AND EFFICIENCY IN SPIDER CONSERVATION:
A CASE STUDY FROM TERAI CONSERVATION AREA, INDIA
ENVIS Bulletin:
Arthropods and
their Conservation
in India
(Insects & Spiders)
The results also show that fine-scale variations in genus-level richness mirror variations in the species richness. This is also due
to moderate cross-level correspondence in the extent to which different sites complement one another: sites that are highly
complementary at the species level also tend to exhibit high complementarity at the genus level, and vice versa. In contrast,
data on families and orders are much poorer predictors of patterns of species richness and species-level complementarity.
Attempts have been made recently to explore the performance of the higher-taxa approach in identifying priority areas for
conservation (Balmford et al., 2000; Fjeldså, 2002; Whiting et al., 2000). Accordingly, some encouraging results have been
obtained, at a continental scale, but only for large grain sizes (Larsen and Rahbek, 2005). Such an analysis was performed at
the regional scale in order to explore the ability of different taxonomic levels to encompass species diversity. The aim was to
investigate the efficiency of different levels of information in prioritizing sites for conservation and to investigate the reliability
of the higher-taxon approach. Analysis demonstrated that the higher-taxon approach performed as well as the species-level
approach. Yet, its use in reserve selection should follow further analysis.
Genera, but not families, are also considered a good surrogate for choosing priority sites for conservation. Whether we choose
to apply a simple scoring approach or a much more efficient iterative algorithm approach to the problem of sites ranking, genera
can be used as a surrogate of species when no taxonomic data are available on these. The use of caution is suggested, and in
case of doubt, a conservative approach should be taken, by trying to protect more sites than those expected to be necessary
to represent all genera. This will guarantee that the proposed reserve network covers a large proportion of the species.
From a practical point of view, the method could be applied to monitoring and management proposes to frequently study and
determine changes in biodiversity richness and distribution. The results show clearly that the higher-taxon approach could be
used for performing rapid area inventories. Assuming, very conservatively, that there are no savings from higher-taxon surveys
in terms of field time, that subsequent identification of spiders in the laboratory takes no longer than fieldwork, and that the
identification time required for genera is fully half that for species, it follows that genus-level surveys will take at the most only
50% of the time required for sorting down to species. Perhaps more important than time savings, in most situations (e.g.
the highly diverse tropics), the great majority of the work required for genus-level inventories of spiders could be carried out
by well-trained parataxonomists or by nonspecialists using local or regionally based operational keys, rather than by expert
scientists (Oliver and Beattie, 1996; Krell, 2004). Apart from spiders, the higher-taxon approach should continue to be
encouraged for other, richer arthropod groups, and the cautious use of genus- level surveys represents a very promising route
to setting priorities for megadiverse groups on the conservation map. The efficiency of the method to be used for prioritization
of conservation areas needs to be demonstrated for different groups of taxa in different biomes and in different biogeographical
areas (Balmford et al., 2000).
REFERENCES
Andersen, A.N. 1995. Measuring more of biodiversity: Genus richness as a surrogate for species richness in Australian
ant faunas. Biological Conservation 73: 39-43.
Báldi, A. 2003. Using higher taxa as surrogates of species richness: A study based on 3700 Coleoptera, Diptera, and Acari
species in central-Hungarian reserves. Basic and Applied Ecology 4: 589-593.
Balmford, A., Green, M.J.B. & Murray, M.G. 1996a. Using higher-taxon richness as a surrogate for species richness. I. Regional
tests. Proceedings of the Royal Society: Biological Sciences 263: 1267-1274.
Balmford, A., Jayasuriya, A.H.M. & Green, M.J.B. 1996b. Using higher-taxon richness as a surrogate for species richness.
II. Local applications. Proceedings of the Royal Society: Biological Sciences 263: 1571-1575.
Balmford, A., Lyon, A.J.E. & Lang, R.M. 2000. Testing the higher-taxon approach to conservation planning in a megadiverse
group: The macrofungi. Biological Conservation 93: 209-217.
Beccaloni, G.W. & Gaston, K.J. 1995. Predicting the species richness of Neotropical forest butterflies: Ithomiinae (Lepidoptera:
Nymphalidae) as indicators. Biological Conservation 71: 77-86.
Bergamini, A., Scheidegger, C., Stofer, S., Carvalho, P., Davey, S., Dietrich, M., Farkas, E., Groner, U., Ivits, E., Kärkkäinen, K.,
Keller, C., Koch, B., Lökös, L., Lommi, L., Máguas, C., Mitchell, R., Pinho, P., Rico, V.J., Rubio, J.A., Truscott, A.M., Wolseley,
P. & Watt, A. 2005. Performance of macrolichens and lichen genera as indicators of lichen species richness and
composition. Conservation Biology 19: 1051-1062.
Bloemers, G.F., Hodda, M., Lambshead, P.J.D., Lawton, J.H. & Wanless, F.R. 1997. The effects of forest disturbance on diversity
of tropical soil nematodes. Oecologia 111: 575-582.
18
Vol. 14, No1. 2011
19
Braithwaite, L.W., Austin, M.P., Clayton, M., Turner, J. & Nicholls, A.O. 1989. On predicting the presence of birds in Eucalyptus
forest types. Biological Conservation 50: 33-50.
Cardoso, P., Silva, I., De Oliveira, N.G. & Serrano, A.R.M. 2004. Higher taxa surrogates of spider (Araneae) diversity and their
efficiency in conservation. Biological Conservation 117: 453-459.
Churchill, T.B. & Arthur, J.M. 1999. Measuring spider richness: Effects of different sampling methods and spatial and temporal
scales. Journal of Insect Conservation 3: 287-295.
Clifford, P., Richardson, S. & Hémon, D. 1989. Assessing the significance of the correlation between two spatial processes.
Biometrics 45:123-134.
Eggleton, P., Williams, P.H. & Gaston, K.J. 1994. Explaining global termite diversity: Productivity or history? Biodiversity and
Conservation 3: 318-330.
Fjeldså, J.O.N. 2002. The relevance of systematics in choosing priority areas for global conservation. Environmental
Conservation 27: 67-75.
Gaston, K.J. & Blackburn, T.M. 1995. Mapping biodiversity using surrogates for species richness: Macro-scales and New World
birds. Proceedings of the Royal Society: Biological Sciences 262: 335-341.
Gaston, K.J. & Williams, P.H. 1993. Mapping the world’s species: The higher taxon approach. Biodiversity Letters 1: 2-8.
Gaston, K.J., Williams, P.H., Eggleton, P. & Humphries, C.J. 1995. Large scale patterns of biodiversity: Spatial variation in family
richness. Proceedings of the Royal Society: Biological Sciences 260: 149-154.
Grelle, C.E.V. 2002. Is higher-taxon analysis a useful surrogate of species richness in studies of Neotropical mammal diversity?
Biological Conservation 108: 101-106.
Krell, F.T. 2004. Parataxonomy vs. taxonomy in biodiversity studies: Pitfalls and applicability of ‘morphospecies’ sorting.
Biodiversity and Conservation 13: 795-812.
Larsen, F.W. & Rahbek, C. 2005. The influence of spatial grain size on the suitability of the higher-taxon approach in continental
priority-setting. Animal Conservation 8: 389-396.
Lawton, J.H., Bignell, D.E., Bolton, B., Bloemers, G.F., Eggleton, P., Hammond, P.M., Hodda, M., Holt, R.D., Larsen, T.B.,
Mawdsley, N.A., Stork, N.E., Srivastava, D.S. & Watt, A.D. 1998. Biodiversity inventories, indicator taxa and effects of
habitat modification in tropical forest. Nature 391: 72-75.
Lennon, J.J., Koleff, P., Greenwood, J.J.D. & Gaston, K.J. 2001. The geographical structure of British bird distributions: Diversity,
spatial turnover and scale. Journal of Animal Ecology 70: 966-979.
Mackenzie, D.I., Nichols, J.D. & Pollock, K.H. 2006. Occupancy Estimation and Modeling: Inferring Patterns and Dynamics of
Species Occurrence. Elsevier, Burlington, MA. 324 pp.
Macnally, R., Fleishman, E., Fay, J.P. & Murphy, D.D. 2003. Modelling butterfly species richness using mesoscale environmental
variables: Model construction and validation for mountain ranges in the Great Basin of western North America. Biological
Conservation 110: 21-31.
May, R.M., 1994. Conceptual aspects of the quantification of the extent of biological diversity. Proceedings of the Royal Society
of London Series B 345:13-20.
Negi, H.R. & Gadgil, M. 2002. Cross-taxon surrogacy of biodiversity in the Indian Garhwal Himalaya. Biological Conservation
105: 143-155.
Oliver, I. & Beattie, A.J. 1996. Invertebrate morphospecies as surrogates for species: A case study. Conservation Biology
1: 99-109.
Pearson, D.L. & Cassola, F. 1992. World-wide species richness patterns of tiger beetles (Coleoptera: Cicindelidae): Indicator
taxon for biodiversity and conservation studies. Conservation Biology 6: 376-391.
Platnick, N.I. 2008. The World Spider Catalogue, version 9.0. American Museum of Natural History (AMNH), http://research.
amnh.org / entomology /spiders /catalog /index. html. [Accessed July 2008].
HIGHER-TAXA SURROGACY AND EFFICIENCY IN SPIDER CONSERVATION:
A CASE STUDY FROM TERAI CONSERVATION AREA, INDIA
ENVIS Bulletin:
Arthropods and
their Conservation
in India
(Insects & Spiders)
Prendergast, J.R. & Eversham, B.C. 1997. Species richness covariance in higher taxa: Empirical tests of the biodiversity
indicator concept. Ecography 20: 210-216.
Pressey, R.L. & Nicholls, A.O. 1989. Efficiency in conservation evaluation: Scoring versus iterative approaches. Biological
Conservation 50: 199-218.
Pressey, R.L., Humphries, C.J., Margules, C.R., Van-Wright, R.I. & Williams, P.H. 1993. Beyond opportunism: Key principles for
systematic reserve selection. Trends in Ecology and Evolution 8: 124-128.
Roy, K., Jablonski, D. & Valentine, J.W. 1996. Higher taxa in biodiversity studies: Patterns from eastern Pacific marine molluscs.
Philosophical Transactions: Biological Sciences 351: 1605-1613.
Sebastian, P.A. & Peter, K.V. 2009. Spiders of India (first edition). Universities Press, Hyderabad. 614 pp.
Vanderklift, M.A., Ward, T.J. & Phillips, J.C. 1998. Use of assemblages derived from different taxonomic levels to select areas for
conserving marine biodiversity. Biological Conservation 86: 307-315.
Vane-Wright, R.I. & Rahardja, D.P. 1993. An evaluation of the diversity of subspecies, species and genera of Hesperiidae within
the Philippines, using the worldmap computer program. Zoologische Verhandelingen 288:116-121.
Whiting, A.S., Lawler, S.H., Horwitz, P. & Crandall, K.A. 2000. Biogeographic regionalization of Australia: Assigning conservation
priorities based on endemic freshwater crayfish phylogenetics. Animal Conservation 3: 155-163.
Williams, P.H. 1993. Measuring more of biodiversity for choosing conservation areas, using taxonomic relatedness. Pp. 194-227
in Moon, T.Y. (ed.), International Symposium on Biodiversity and Conservation. Seoul: Korean Entomological Institute.
Williams, P.H. & Gaston, K.J. 1994. Measuring more of biodiversity: Can higher-taxon richness predict wholesale species
richness? Biological Conservation 67: 211-217.
Williams, P.H., Humphries, C.J. & Gaston, K.J. 1994. Centres of seed-plant diversity: The family way. Proceedings of the
Royal Society of London B 256: 67-70.
Williams, P.H. 1998. Key sites for conservation: Area-selection methods for biodiversity. Pp. 211-250 in Mace, G.M., Balmford,
A. & Ginsberg, J.R. (eds.), Conservation in a Changing World. Cambridge University Press, Cambridge (UK).
20
Vol. 14, No1. 2011
SPIDER DIVERSITY ATTRIBUTES IN
A CULTURAL LANDSCAPE
DOMINATED BY FIELD CROPS AND
FRUIT ORCHARDS IN
THE KONKAN REGION OF
MAHARASHTRA
Nilam Vasant Bhuvad, Vinayak Krishna Patil, Sanjay Ghanshyam Bhave, Satish Sopan Narkhede,
Vinayak N. Jalgaonkar and Vinod Manikrao Mhaiske
College of Forestry, Dr. Balasaheb Sawant Konkan Krishi Vidyapeeth, Dapoli, District Ratnagiri, Maharashtra – 415 712.
email:
ABSTRACT
A study was undertaken to explore the spider diversity of important agro-ecosystems (rice, finger millet, cashew and mango)
in the Konkan region of Maharashtra. Standard-time visual sampling was done with spatial and temporal replication from June
2010 to March 2011. A total of 4035 individual spiders were recorded. They belonged to 141 species, 70 genera and 21 families.
The families Araneidae and Salticidae were the dominant families overall. A total of 29, 35, 69 and 98 species were recorded
in rice, finger millet, cashew and mango, respectively. The completeness of the surveys was found to be as high as 87% in
mango and as low as 49% in finger millet on the basis of proven reliable estimators of species richness. Simpson’s index of
dominance showed a mango (0.119) > rice (0.103) > finger millet (0.081) > cashew (0.054) trend. On the other hand, the Shannon
diversity index showed a cashew (3.41) > mango (3.02) > finger millet (2.81) > rice (2.73) trend. Beta diversity indices for
combinations showed a high spatial turnover between field crops and orchards. But within each group, there was considerable
overlap in the composition underlining the value of a heterogeneous landscape in maintaining spider diversity.
INTRODUCTION
Spiders—belonging to the order Araneae, the seventh largest order of the animal kingdom—are small invertebrate animals
distributed throughout the world. The total number of described species of spider from all over the world is 43,244. They belong
to 3879 genera under 111 families (Platnick 2012). In India, there are 1442 spider species in 361 genera belonging to 59 families
(Siliwal et al. 2005). Spiders have been known to occupy almost every terrestrial habitat (Preston-Mafham and Preston-Mafham
1993) including cultural habitats.
As a land use, agriculture has contributed to modification and destruction of natural habitats of spiders. Apart from the
usual natural factors, spider diversity in agro-ecosystems is influenced by farming activities such as tillage, irrigation, fertilization,
weeding, crop establishment and pesticide application (Parris 2001) and inherent properties such as monoculture and
intensification (Rypstra et al. 1999, Oberg 2007, Abhilash and Singh 2009). One underlying reason is the lower levels of vegetation
diversity compared with natural habitats. Yet, numerous spider species have been successful in occupying various
agro-ecosystems to a large extent (Young and Edwards 1990). Studying and exploring spiders in agro-ecosystems is essential
for two reasons.—first, they represent an important component of animal diversity of a given site, and second, they contribute
to an increased yield by controlling insect pest populations.
Worldwide, the spider fauna in agricultural landscapes has been studied extensively for its composition and population
densities (e.g. Bishop & Riechert 1990, Marc et al 1999, Lee & Kim 2001, Sebastian et al. 2005, Sudhikumar et al. 2005 etc.).
Similarly, some work has also been done in fruit orchards in other countries (Marc and Canard 1997, Brown et al. 2003, Tavares
2007, Monzo et al. 2011 etc.), but very little has been done in India (Sugumaran et al. 2007).
21
ENVIS Bulletin:
Arthropods and
their Conservation
in India
(Insects & Spiders)
The Konkan, which is a part of the famous Western Ghats-Sri Lanka biodiversity hotspot, is speculated by the authors to
hold a rich diversity of spiders. However, very little documentation of the spider diversity of this region exists in the literature
(Pradhan 2006). There is a complete lack of published reports on the spider diversity and abundance in agricultural fields in this
region. We present here results of a study of spider diversity in an agriculture-dominated landscape in the Konkan. The study
landscape was assumed to be simplistic (as in the dominant agricultural pattern in Konkan), comprising two crop systems (rice,
finger millet) and two orchard systems (cashew, mango) for the purposes of landscape-level attributes of spider assemblages.
STUDY SITE
The Konkan is a coastal belt of land sandwiched between high hills of the Western Ghats in the east and the Arabian Sea in
the west. The terrain is mostly hilly, fragmented by several short rivers originating in the Sahyadris and rushing to the Arabian
Sea. Some areas in the region have coastal plains. The altitude varies from sea level to over 1000 m above MSL. The major
landforms include coastal plains, creeks and estuaries, forested slopes, grassy hilltops and precipitous mountainsides.
Agricultural land uses include flooded and upland paddies and finger millet on the hill-slopes and fruit orchards in the hills. A
large proportion of land (>40%) is covered with forests (FSI 2011). The forests are mostly dry deciduous and moist deciduous
mixed forests.
The region is characterized by a humid climate with over 3500 mm average annual rainfall and moderate temperatures ranging
from as low as 7.5°C to as high as 38.5°C. The average relative humidity ranges from 55% to 100%. During the study period, the
maximum and minimum temperatures ranged from 31°C to 32°C and from 18°C to19°C, respectively. The total rainfall received
during the period of study was 4801.3 mm in 149 rainy days. The intensity of rainfall was higher during July and September. The
relative humidity during the crop period ranged from 95% to 71.2%.
The Konkan region is famous for its rice (Oryza sativa) cultivation. In addition, finger millet (Elusine corocana) is also cultivated on
hill-slopes. Recently, the area under cultivation of horticulture crops such as mango (Mangifera indica) and cashew (Anacardium
occidentale) has also increased. In the Konkan region, rice, finger millet, cashew and mango are cultivated on 4.13, 0.47, 1.75
and 1.75 lakh ha, respectively (Magar et al. 2006, www.maccia.org.in, www.shivrai.co.in).
The main campus of Dr. Balasaheb Sawant Konkan Krishi Vidyapeeth in Dapoli, was selected for a landscape-level study of
spider diversity. A map of the Konkan region showing the study site is presented in Fig1.
Figure 1.
The campus is spread over 200 ha. Various departmental farms cultivate different crops and maintain orchards
22
Vol. 14, No1. 2011
23
METHODS
SAMPLING FOR SPIDERS
A sample in the field crop was 15 minutes of visual search at a random location, usually restricted to an area of 1 m2. Following
Sebastian et al. (2005), the area around each plant in the area was searched for spider webs, and all plant parts were examined
for spiders by a visual search and using the hand picking method. A sample in an orchard was 30 minutes of visual search of
and around a fruit tree. Spiders were recorded by web visualization and using the branch collecting and hand picking methods.
The ground under the canopy of the sample tree, the bark of its main stem and primary branches, and the foliage up to a height
of 2 m above the ground were thoroughly searched for spiders. Each crop field was sampled every week from the first week of
July 2010 to the first week of November 2010. Each orchard was sampled once every fortnight from the first fortnight of June
2010 to the last fortnight of March 2011. Four samples were collected from each field during one sampling instance.
After one reference spider was collected, others closely matching it were not collected. But those presenting confusion over
identity in the field were collected for further exploration. The collected spiders were preserved in 70% ethanol, as suggested in
Marc et al. (1999), with proper labeling, and deposited in the collection of the College of Forestry, Dapoli.
IDENTIFICATION OF SPIDERS
Even the latest checklists of Indian spiders have fewer than 1500 spiders (Siliwal et al. 2005)—less than 5% of the world’s spiders.
Compared with other megadiverse countries, this is only a small fraction. Thus, it seems that the spider fauna of India is
inadequately explored. Further, there is a lack of elaborate identification keys, making it difficult for lay workers to fully identify
species with certainty. In this study, the available reference material (Sebastian and Peter 2009, Proszynski 2009, Barrion and
Litsinger 1995) was used, and online resources (www.southindianspiders.org, www.spidersofcentralindia.org etc.) were also
referred to. The help of Dr. G. N. Vankhede of SGB University, Amravati, and Dr. S. K. Jose of Deva Matha College, Kuravilangadu,
Kerala, was taken for identification of spiders on the basis of specimens and/or photographs. The individuals were put into
uniquely coded morphospecies until further identification was possible.
INVENTORY COMPLETENESS
Inventory completeness is an important aspect of biodiversity inventories. It is defined as the ratio of observed to estimated
species expressed as a percentage. A staggering number of species estimators based on presumably incomplete inventories
are available (Walther and Martin 2001). However, according to them, Chao1, Chao2, Jackknife1 and Jackknife2 are the most
reliable. The values of these estimators for spider assemblage in each of the agro-ecosystem were calculated using the
EstimateS software package (Colwell 2009). This software also calculated the numbers of singletons (species with only one
individual) and doubletons (species with only two individuals). The range of per cent completeness was calculated by dividing
the observed species richness by each estimator. Along with these, the average number of individuals per sample and the
average number of species per sample were also calculated for each agro-ecosystem. The sampling intensity is also considered
as a measure of inventory completeness. It was calculated as the number of individuals collected per species.
SPECIES DIVERSITY
The diversity of a community is assessed in terms of its species richness—the observed number of species—first and foremost.
Since inventories are always incomplete, the estimated number of species, calculated as described in the previous section,
is a more reliable measure of the species richness. In addition, diversity indices such as Simpson’s index (D) and Shannon’s
index (H’) are used to explore the apportionment component of the diversity of a community (Magurran 2004). Simpson’s
index shows whether a community is dominated by one or a few species. Shannon’s index, on the other hand, assesses the
heterogeneity of species abundances within a community. Various transformations are available for easy interpretation of D
and H’, like 1/D, 1-D and 1/H’. But it was decided to use the straightforward calculated figures. Thus, a higher value of D in the
results indicates a high dominance of one or few species, making the community less diverse. On the other hand, a higher
value of H’ indicates a high degree of heterogeneity within the community and hence higher diversity.
The diversity of a community within a given habitat is alternatively termed as the alpha diversity; that between two habitats
within a landscape is termed the beta diversity (Whittaker 1972 as adopted in Magurran 2004). The species richness, D
and H’ all represent the alpha diversity of spider communities in particular agro-ecosystems. Whittaker’s β values were also
calculated for pairs of agro-ecosystems. The results of this analysis are presented as the spatial turnover at the species and
SPIDER DIVERSITY ATTRIBUTES IN A CULTURAL LANDSCAPE DOMINATED BY
FIELD CROPS ANDFRUIT ORCHARDS IN THE KONKAN REGION OF MAHARASHTRA
ENVIS Bulletin:
Arthropods and
their Conservation
in India
(Insects & Spiders)
family levels between pairs of agro-ecosystems. The higher the value of Whittaker’s β is, the higher the turnover between those two
communities, indicating minimal compositional overlap.
RESULTS
In this study, a total of 4035 individual spiders were recorded. These were identified, as far as possible, to the species level
using the techniques described in the previous section. After exhausting all the available resources for identification, it was
determined that these belonged to 141 species under 21 families. Of these, 65 species could be identified to the species level
with certainty. The remaining species could be identified up to the genus level (67) or the family level (9). A checklist of the
spider species recorded in this study is given in Appendix I. The dominant families were the families Araneidae and Salticidae,
with 35 and 34 species, respectively. Similarly, the maximum number of species was also recorded in the families Araneidae
(15) and Salticidae (16).
A summary of the observations is provided in Table 1. Mango agro-ecosystems had the highest observed species richness,
whereas rice had the lowest. However, they cannot be compared validly because of the completely different types of habitats
and sampling units. Thus, between mango and cashew agro-ecosystems, mango was more species-rich, with 98 species,
compared with 69 in cashew. Similarly, between rice and finger millet, finger millet was more species-rich, with 35 species,
compared with 29 in rice agro-ecosystems. Similar trends were observed in the case of the number of genera. In terms of the
number of families, rice and finger millet had the same number. However, cashew had only two thirds of the families recorded
in mango.
Table 1.
Summary of observations on spiders in major agro-ecosystems of Konkan region
Agroecosystem
Sampling unit
N
Individuals
Families
Genera
Species
D
H’
Rice
Quadrant
204
526
7
14
29
0.103
2.73
Finger millet
Quadrant
192
423
7
19
35
0.081
2.81
Cashew
Tree
240
743
14
43
69
0.054
3.41
Mango
Tree
240
2343
21
60
98
0.119
3.02
4035
21
70
141
Total
The ranges of per cent completeness based on the minimum and maximum estimates for each system are presented in
Table 2. For comparison, the values of the observed species richness, sampling intensity, singletons and doubletons are also
provided in the same table. The sampling intensity was found to be highest in mango and lowest in cashew. The combined
proportion of singletons and doubletons with observed species richness ranged from 34% in the case of rice and 41% in the
case of cashew. Two commonly used diversity indices were also worked out for each agro-ecosystem and are presented in
Table 1.
The compositions of spider families in different systems under study are presented in Table 3. Rice and finger millet agroecosystems had equal numbers of families recorded. Whereas the family Thomisidae was found only in rice, the family Oonopidae
was found only in finger millet. The remaining six families were shared by these two agro-ecosystems. The family Tetragnathidae
was dominant in rice, with 7 species. On the other hand, the families Araneidae and Salticidae were the dominant families in
finger millet, with 13 species each. Similarly, the family Araneidae was the dominant family in both cashew and mango orchards
(21 and 26 species, respectively), followed by the family Salticidae (16 and 21 species, respectively). The families Corinnidae,
Ctenidae, Filistatidae, Miturgidae, Philodromidae and Sparassidae were the rare spider families in the landscape, with only
one species each and found only in one agro-ecosystem, i.e. mango orchards. None of the families were found exclusively in
cashew orchards.
To note the contribution these varied ecosystems make to the spider assemblages of the landscape, the beta diversity was
explored. The beta diversity values (Whittaker’s β) were worked out at the family and species levels. The values are presented
in Tables 4 and 5, respectively.
24