CFA 2018 level 2 fixed income quest bank r37 valuation analysis bonds with embedded options q bank
Bạn đang xem bản rút gọn của tài liệu. Xem và tải ngay bản đầy đủ của tài liệu tại đây (771.26 KB, 31 trang )
Valuation and Analysis: Bonds with Embedded Options Q Bank
Set 1 Questions
1. A bond with an issuer option is a(an):
A. callable bond.
B. putable bond.
C. extendible bond.
2. A call option that can only be exercised on predetermined dates is best known as a(n):
A. American-style callable bond.
B. Bermudan-style call option.
C. European-style call option.
3. An embedded option in which the holder can keep the bond for a number of years after
maturity is best known as a(n):
A. Bermudan call option.
B. put option.
C. extension option.
4. An acceleration provision and a delivery option are most likely unique to:
A. sinking fund bonds.
B. extendible bonds.
C. hybrid bonds.
5. Compared to an otherwise similar straight bond, a callable bond most likely has:
A. a higher value because of the call option.
B. a lower value because of the call option.
C. the same value.
6.
If the value of a 10% coupon, annual-pay straight bond with five years remaining to maturity
is $102.50, and the value of a callable bond of similar terms is $102.00, the value of the call
option is given by:
A. 0.
B. $102.50 - $102.00.
C. $102.00 - $102.50.
7. Relative to a straight bond, a putable bond most likely has:
A. a higher value because of the put option.
B. a lower value because of the put option.
C. the same value.
8. A wealth manager has identified two four-year annual coupon government bonds, Bond X
and Bond Y with similar terms. Bond X is callable at par three years from today and Bond Y
is callable and putable at par three years from today. Compared to Bond Y, value of Bond X
is:
A. higher.
B. lower.
Copyright © IFT. All rights reserved.
Page 1
Valuation and Analysis: Bonds with Embedded Options Q Bank
C. the same.
9. Consider a bond callable at 100. The bond is least likely to be called if:
A. value of the bond’s future cash flows is higher than 100.
B. value of the bond’s future cash flows is lower than 100.
C. value of the bond’s future cash flows is close to 100.
Table 1: Equivalent Forms of a Yield Curve
Maturity (Years) Par Rate (%)
Spot Rate (%)
One-Year Forward Rate (%)
1
1.00
1.00
1.00
2
2.00
2.01
3.03
3
3.00
3.04
5.13
10. Assume zero volatility and the term structure given in Table 1. The value of a three-year
4.50% default-free annual coupon bond callable at par one year and two years from now is
closest to:
A. $103.50
B. $103.90
C. $103.00
11. If the value of a three-year 4.5% straight bond is $104.30, and the value of a three-year 4.5%
callable bond is $104.00, (both default-free bonds), the value of the call option is closest to:
A. $0.20
B. $0.00
C. $0.30
12. For a three-year bond putable at par one year and two years from today, an investor will most
likely exercise the put option when the:
A. value of the bond’s future cash flows is lower than 100.
B. value of the bond’s future cash flows is higher than 100.
C. bond is trading at premium to par.
Table 1: Equivalent Forms of a Yield Curve
Maturity (Years)
One-Year Forward Rate (%)
1
1.00
2
3.03
3
5.13
13. Based on the one-year forward rates given in Table 1, the value of a three-year 4.5% annualcoupon default-free bond, putable at par one year and two years from today at zero volatility
is closest to:
A. $103.
B. $104.
C. $105.
14. Assume a flat yield curve. If interest rate volatility increases, the value of a callable bond:
A. increases.
Copyright © IFT. All rights reserved.
Page 2
Valuation and Analysis: Bonds with Embedded Options Q Bank
B. decreases.
C. stays the same.
15. Assume a flat yield curve. If interest rate volatility increases, the value of a putable bond:
A. increases.
B. decreases.
C. stays the same.
16. All else equal, as the yield curve slopes upward, value of the call option in callable bonds
most likely:
A. decreases.
B. increases.
C. remains unaffected.
17. All else equal, a put option provides a hedge against:
A. falling interest rates.
B. rising interest rates.
C. a change in shape of the yield curve.
The information below relates to questions 18-21.
Table 2: Binomial Interest Rate Tree at 10% Interest Rate Volatility
Based on the implied forward rates of Table 1
Table 3: Valuation of a Default-Free Three-Year 4.50% Annual Coupon Bond Callable at Par
One Year and Two Years from Now at 10% Interest Rate Volatility
Year 0
Year 1
Year 2
Year 3
Value of the callable bond V0 = $103.465
C = 4.50
C = 4.50
104.50
Value of a straight three-year 4.50% annual
V = 100.085
Node 2-1 V = ?
coupon bond = $104.306
C = 4.50
C = 4.50
104.50
V = 101.454
V = 99.448
C = 4.50
Node 2-3 V = ?
104.50
104.50
18. Given the one-year forward rates in Table 2, the value of the callable three-year 4.50%
annual coupon bond at Node 2-3 is closest to:
Copyright © IFT. All rights reserved.
Page 3
Valuation and Analysis: Bonds with Embedded Options Q Bank
A. $99.870; bond will not be callable at par.
B. $100.33; bond will be callable at par.
C. $98.670. bond will be callable at par.
19. Assuming no change in the initial setting except that volatility changes from 10% to 20% in
Table 2, the new value of the same three-year 4.50% annual coupon callable bond from
Table 3 is:
A. more than 103.465.
B. less than 103.465.
C. equal to 103.465.
20. Using Table 2, the value at Node 2-1 (Table 3) of the three-year 4.50% annual coupon bond
putable at par in one year and two years from now is closest to:
A. $98.40 putable at par.
B. $99.40 not putable at par.
C. $100.33 putable at par.
21. Assume nothing changes in the initial setting of the three-year 4.50% annual coupon putable
bond valued at 104.96, except the bond is now putable at 96 instead of 100. A similar
straight bond is valued at 104.31. The new value of the putable bond is closest to:
A. $100.00.
B. $104.96.
C. $104.31.
22. One of the approaches used to value risky bonds is to raise the one-year forward rates derived
from the default-free benchmark yield curve by a fixed spread at zero volatility known as the:
A. swap spread.
B. Libor-OIS spread.
C. Z-spread.
23. For risky bonds with embedded options, the constant spread when added to one-year forward
rates on the interest rate tree, makes the arbitrage-free value of the bond equal to its market
price is best known as:
A. option-adjusted spread.
B. TED spread.
C. swap spread.
The information below relates to question 24
Table 2: Binomial Interest Rate Tree at 10% Interest Rate Volatility
Copyright © IFT. All rights reserved.
Page 4
Valuation and Analysis: Bonds with Embedded Options Q Bank
24. Consider the interest rates given in Table 2. The price of a three-year 4.50% annual coupon
risky callable bond (callable at par one year and two years) is 103.00 at 10% interest rate
volatility. If the one-year forward rates in Table 2 are raised by an OAS of 30 bps, the price
of the callable bond is 102.90. The correct OAS that justifies the given market price of 103
is:
A. more than 30 bps.
B. equal to 30 bps.
C. less than 30 bps.
25. A portfolio manager is analyzing three 10-year 5.0% annual coupon callable bonds of equal
risk. The bonds differ only in the OAS but are similar in characteristics and credit quality.
Bond A
OAS = 30 bps
Bond B
OAS = 25 bps
Bond C
OAS = 27 bps
Which bond is the most underpriced?
A. Bond A.
B. Bond B.
C. Bond C.
26. If interest rate volatility increases from 10% to 20%, for a 20-year 5% annual coupon bond,
callable in five years, the OAS for the bond:
A. increases.
B. decreases.
C. is unaffected.
27. The most appropriate duration measure for bonds with embedded options is:
A. effective duration.
B. yield duration measure.
C. modified duration.
28. Bond A has the following characteristics:
Time to maturity
5 years from now
Coupon
4.75% annual
Type of Bond
Callable at par one year from today
Current price (% of par)
101.25
Price (% of par) when shifting the
102.00
benchmark yield curve down by 30 bps
Price (% of par) when shifting the
100.74
benchmark yield curve up by 30 bps
The effective duration for Bond A is closest to:
A. 0.60
B. 2.10
C. 5.20
29. At very high interest rates, the effective duration of a:
Copyright © IFT. All rights reserved.
Page 5
Valuation and Analysis: Bonds with Embedded Options Q Bank
A. callable bond significantly exceeds that of an otherwise identical straight bond.
B. callable bond is similar to that of an otherwise identical straight bond.
C. callable bond is lower than an identical straight bond because the call option is deep in
the money.
30. When interest rates fall, the effective duration of a putable bond is:
A. exceeds that of an otherwise identical option-free bond.
B. similar to that of an otherwise identical straight bond.
C. less than that of a straight bond.
31. To measure the interest rate sensitivity of a callable or putable bond when the embedded
option is near the money:
A. one-sided durations are used.
B. two-sided effective duration is used.
C. average price response to up- and down-shifts of interest rates is applied.
32. A callable bond is more sensitive to interest rate rises than to interest rate declines,
particularly when the call option is near the money. The one-sided duration for a 25 bps
increase in interest rates is most likely:
A. higher than a one-sided duration for a 25 bps decrease in interest rates.
B. equal to a one-sided duration for a 25 bps decrease in interest rates.
C. lower than a one-sided duration for a 25 bps decrease in interest rates.
33. Which of the following statements is least accurate?
A. Key rate durations measure the sensitivity of a bond’s price to changes in certain
maturities on the benchmark yield curve.
B. Key rate durations help portfolio managers detect the “shaping risk” for bonds.
C. Key rate durations are calculated by assuming parallel shifts in the benchmark yield
curve.
Table 4: Key Rate Durations of 30-Year Bonds Putable in 10 Years Valued at a 5% Flat Yield
Curve with 15% Interest Rate Volatility
Coupon
Price (%
Total
3-Year
5-Year
10-Year
30-Year
(%)
of par)
2
76.85
7.80
–0.12
–0.32
7.56
0.68
5
106.87
14.97
–0.02
–0.06
5.45
9.60
10
205.30
12.79
0.06
0.18
2.05
10.50
34. Using the information presented in Table 4, the 10% coupon bond compared to the 2%
coupon bond, is most sensitive to changes in the:
A. 10-year rate.
B. 3-year rate.
C. 30-year rate.
35. The effective convexity of a three-year 3.50% annual coupon bond callable at par one year
from now:
Copyright © IFT. All rights reserved.
Page 6
Valuation and Analysis: Bonds with Embedded Options Q Bank
A. is always positive.
B. turns negative when the call option is out of money.
C. turns negative when the call option is near the money.
36. Which of the following statements is least accurate?
A. Putable bonds always exhibit positive convexity.
B. Putable bonds have greater upside potential than otherwise similar callable bonds when
interest rates fall.
C. The upside for a putable bond is much larger than the downside when the put option is
out of money.
The information below relates to question 37 - 38
Binomial Interest Rate Tree at 10% Interest Rate Volatility
6.2%
3.3%
5.1%
2.7%
4.2%
3 Year Floating Rate Bonds issued by Cemex Corp.
Bond X
One-year
Libor annually, set in arrears, capped at 5.00%
Bond Y
One-year
Libor annually, set in arrears, floored at 3.25%
Both bonds have the same credit rating.
37. The value of Bond X is closest to:
A. 98.874% of par.
B. 99.684% of par.
C. 10.324% of par.
38. The value of Bond Y is closest to:
A. 100.000% of par.
B. 101.490% of par.
C. 102.493% of par.
Consider the following table for Questions 39-40.
Bond X: 4.25% Annual Coupon Callable Convertible Bond Maturing on 4 May 2020
Issue date
4 May 2015
Issue Price
At par denominated into bonds of $100,000 each, and
multiples of $1,000 each thereafter
Copyright © IFT. All rights reserved.
Page 7
Valuation and Analysis: Bonds with Embedded Options Q Bank
Conversion Period
Initial Conversion Price
Issuer Call Price
Market Information
Convertible Bond Price on 5 May 2016
Share Price on Issue Date
Share Price on 5 May 2016
4 June 2015 to 3 April 2020
$7.00 per share
Two years, three years and four years from now at
premium to par, where premium declines after the
second year from 10% to 6% third year and to 3% in
fourth year
$125,000
$5.00
$7.50
39. Using the initial conversion price of Bond X, the conversion ratio (in shares) is closest to:
A. 14,286.
B. 20,000.
C. 17,900.
40. The minimum value of Bond A on 5 May 2016, assuming a yield of 5% on an identical nonconvertible bond on that date, is given as:
A. $82,285.
B. $107,145.
C. $100,000.
41. Value of a callable convertible bond is given by:
A. Value of straight bond + Value of call option on the issuer’s stock.
B. Value of straight bond + Value of call option on the issuer’s stock – Value of issuer call
option.
C. Value of straight bond + Value of call option on stock + Value of issuer call option.
42. On 1 June 2015 Company X issued a 5-year, 4% annual coupon convertible bond at $1,000
par with a conversion ratio of 25 ordinary shares, on 02 June 2016, given the market price of
Company X stock as $54, the risk-return characteristics of the convertible most likely
resemble that of:
A. a busted convertible.
B. a straight bond without the conversion option.
C. Company X’s common stock.
Copyright © IFT. All rights reserved.
Page 8
Valuation and Analysis: Bonds with Embedded Options Q Bank
Set 1 Solutions
1. A is correct. A callable bond has an embedded call option which is an issuer option—that is,
the right to exercise the option at the discretion of the bond’s issuer. The call provision
allows the issuer to redeem the bond before its intended maturity. A putable bond has an
embedded put option which is an investor option. An extendible bond has an extension
option which allows the bondholder the right to keep the bond for a number of years after
maturity, with a different coupon. Sections 2.1.1, 2.1.2. LO.a.
2. B is correct. A Bermudan-style call option can be exercised only on a preset schedule dates
after the end of the lockout period. These dates are given in the bond’s indenture. The issuer
of a European-style callable bond can only exercise the call option on a single date at the end
of the lockout period. An American-style callable bond is continuously callable from the end
of the lockout period until the maturity date. Section 2.1.1. LO.a.
3. C is correct. An embedded option in which at maturity, the bondholder (an extendible bond
investor) has the right to keep the bond for a number of years after maturity, possibly with a
different coupon is known as an extension option. Section 2.1.2. LO.a.
4. A is correct. A sinking fund bond (sinker), requires the issuer to make principal repayments
where each payment is a certain percent of the original principal amount. The issuer sets
aside funds over time to retire the bond issue, thereby lowering credit risk. Such a bond may
include the following options: call option, an acceleration provision and a delivery option.
Section 2.2. LO.a.
5. B is correct. For a callable bond, the investor is long the bond but short the call option.
Compared to a straight bond, the value of the callable bond is lower because of the call
option. Value of callable bond = Value of straight bond – Value of call option. Section 3.1.
LO.b.
6. B is correct. Value of issuer call option = Value of straight bond – Value of callable bond =
$102.50-$102.00 = $0.50. Section 3.1. LO.b.
7. A is correct. For a putable bond, an investor is long the bond and long the put option. Hence
the value of the putable bond relative to the value of the straight bond is higher because of
the put option. Value of putable bond = Value of straight bond + Value of investor put
option. Section 3.1. LO.b.
8. B is correct. Relative to Bond Y, Bond X will have a lower value than Bond Y because it
does not have a put option. Section 3.1. LO.b.
9. B is correct. Because the issuer borrows money, it will exercise the call option when the
value of the bond’s future cash flows is higher than the call price or if the price is very close
to the call price. Section 3.3.1. LO.c.
Copyright © IFT. All rights reserved.
Page 9
Valuation and Analysis: Bonds with Embedded Options Q Bank
10. A is correct. Value of a callable default-free three-year 4.50% annual coupon bond is given
below. The bond is callable at par one year and two years from now at zero volatility. Using
the one-year forward rates given in Table 1:
Today
Cash Flow
Discount Rate
Value of
Callable Bond
100 + 4.50
1.01
= 103.4653
≅ $103.50
Year 1
4.50
1.00%
99.40 + 4.50
1.0303
= 100.8444
Called at 100
Year 2
4.50
3.03%
104.50
1.0513
= 99.4007
Not called
Year 3
104.50
5.13%
Section 3.3.1. LO.c.
11. C is correct. The value of the call option in this callable bond is given by the difference
between the value of the three-year 4.50% annual coupon straight bond $104.30 and the
three-year 4.5% callable bond $104.00: 104.30 – 104.00 = $0.30. Section 3.3.1. LO.c.
12. A is correct. The decision to exercise the put option is made by the investor. He will exercise
the put option when the value of the bond’s future cash flows is lower than 100 (put price).
Section 3.3.2. LO.c.
13. C is correct. Value of a bond with 4.5% annual coupon putable at par two years and one year
from today at zero volatility is given as:
Today
Cash Flow
Discount Rate
Value of the
Putable Bond
101.43 + 4.50
1.01
= $104.88
Year 1
4.50
1.00%
100 + 4.50
1.0303
= 101.4268
≅ 101.43
Not put
Year2
4.50
3.03%
104.50
1.0513
= 99.4007
Put at 100
Year 3
104.50
5.13%
Section 3.3.2. LO.c.
14. B is correct. Value of a callable bond = Value of a straight bond – Value of the call option.
All else equal an increase in volatility increases the chances of the call option being exercised
by the issuer. As value of the call option increases, value of the callable bond decreases.
Section 3.4.1. LO.d.
15. A is correct. Value of the putable bond = Value of the straight bond + Value of the put
option. All else equal a higher volatility increases the value of the put and hence the value of
the putable bond. Value of a straight bond is unaffected by interest rate volatility. Section
3.4.1. LO.d.
16. A is correct. When the yield curve is upward sloping, the one-year forward rates are higher
and the opportunities for the callable bond issuer to call the bond are fewer. Hence the value
Copyright © IFT. All rights reserved.
Page 10
Valuation and Analysis: Bonds with Embedded Options Q Bank
of the call option decreases. Value of call option in callable bonds increases as yield curve
flattens or inverts. Section 3.4.2.1. LO.e.
17. B is correct. If interest rates start rising, bond investor would like their principal back so they
can invest their money at a higher rate. Investing in a bond with an embedded put option
makes this possible. All else being equal, the value of the put option decreases as the yield
curve moves from being upward sloping, to flat, to downward sloping as opportunities to put
the bond decline. Section 3.4.2.2. LO.e.
18. B is correct. At Node 2-3 V = 0.5 × [(104.5/1.04160) + (104.50/1.04160)] =
$100.326. The bond price exceeds par hence the bond is callable at par. The bond value is
reset from $100.326 to $100.000. Section 3.5.1. LO.f.
19. B is correct. Value will be less than 103.465. A higher interest rate volatility increases the
value of the call option. Value of the callable bond = value of the straight bond – value of
call option. A higher call option value will consequently reduce the value of the callable bond
since it is subtracted from the straight bond value. Section 3.5.1. LO.f.
20. A is correct. Given the one-year forward rates in Table 2, from Table 3 the three-year 4.50%
annual coupon bond (putable at par one year and two years), is putable at Node 2-1.
At Time 2, value at Node 2-1 = 0.5 × [(104.5/1.06205) + (104.50/1.06205)] =
$98.395. The bond is at a discount to par so it will be putable at par at Node (2, 1). Bond
value will reset to 100. Section 3.5.2. LO.f.
21. C is correct. The put price of 96 is too low for the put option to be exercised in any scenario.
Therefore, it will not be equal to its previous value of 104.96. The value of the put option is
zero. Value of the putable bond is equal to the value of the straight bond which is $104.31.
Section 3.5.2. LO.f.
22. C is correct. The Z-spread or zero-volatility spread is a fixed spread added to the one-year
forward rates derived from the default-free benchmark yield curve to value risky bonds. A is
incorrect, because swap spread is the spread paid by the fixed-rate payer of an interest rate
swap over the rate of recently issued government security. B is incorrect because the LiborOIS spread which is the difference between Libor and the OIS rate is used as an indicator of
risk and liquidity of money market securities. Section 3.6.1. LO.g.
23. A is correct. Option-adjusted spread is that constant spread when added to the one-year
forward rates of the binomial lattice makes the arbitrage-free price of a risky bond with
embedded options equal to its market price. B & C are incorrect. The TED spread is an
indicator of credit risk in the economy. Swap spread is explained above. Section 3.6.1. LO.g.
24. C is correct. The three-year 4.50% annual coupon callable risky bond at 10% interest rate
volatility is given as 103.00. If the bond’s price is given, the OAS is found by the trial and
error method. At 30 bps which is added to the one-year forward rates in each state of the
binomial interest rate tree, the price is lower at 102.90. Because of the inverse relationship
Copyright © IFT. All rights reserved.
Page 11
Valuation and Analysis: Bonds with Embedded Options Q Bank
between a bond’s price and its yield, this means that the discount rates are too high. Hence
the OAS should be lower than 30 bps. Section 3.6.1. LO.g.
25. A is correct. Bond A has the highest OAS compared to Bond B and Bond C, so it is the most
underpriced (cheap). Lower OAS for bonds with similar characteristics and credit quality
(Bonds B & C) indicate that they are possibly overpriced. Section 3.6.1. LO.g.
26. B is correct. As interest rate volatility increases the OAS of the callable bonds decreases and
vice versa. Section 3.6.2. LO.h.
27. A is correct. Effective duration works for bonds with embedded options and for straight
bonds. Therefore, it is used by practitioners regardless of the type of bond being analyzed.
Yield duration measures, such as modified duration, can be used only for option-free bonds
because these measures assume that a bond’s expected cash flows do not change when the
yield changes. Section 4.1. LO.i.
28. B is correct. The effective duration for Bond A = (102.00 − 100.74)/(2 × 0.003 ×
101.25) = 2.074. Section 4.1.1. LO.i.
29. B is correct. The effective duration of a callable bond cannot exceed that of a straight bond.
At high interest rates, the call option is out of money, so the bond will unlikely be called.
Therefore, the effect of an interest rate rise on a callable bond is very similar to an otherwise
identical straight bond, and the two bonds in such an interest rate scenario will have similar
effective durations. A & B are incorrect because, when interest rates fall, the call option
moves into money limiting the price appreciation of the callable bond. Consequently, the
call option reduces the effective duration of the callable bond relative to that of the straight
bond. Section 4.1.1. LO.i.
30. B is correct. When interest rates fall, the put option is out of the money. The effective
duration of a putable bond is similar to that of an otherwise identical option-free bond.
Section 4.1.1. LO.j.
31. A is correct. One-sided durations—that is, the effective durations when interest rates go up or
down—are better at capturing the interest rate sensitivity of a callable or putable bond than
the the average price response to up- and down-shifts of interest rates - (two-sided) effective
duration, particularly when the embedded option is near the money. When the embedded
option is in the money, the price of the callable bond has limited upside potential or price of
putable bond has limited downside potential. Section 4.1.2. LO.k.
32. A is correct. When the bond is immediately callable, a 25 bps increase in the interest rate has
a greater effect on the value of the callable bond than a 25 bps decrease in the interest rate.
When interest rates are high the call option will not be exercised. No matter how far interest
rates decline, the price of the callable bond cannot exceed 100 because no investor will pay
more than the price at which the bond can be immediately called. In contrast, there is no limit
to the price decline if interest rates rise. Therefore, the one-sided up-duration is higher than
the one-sided down-duration. Section 4.1.2. LO.k.
Copyright © IFT. All rights reserved.
Page 12
Valuation and Analysis: Bonds with Embedded Options Q Bank
33. C is correct. Effective duration is calculated by assuming parallel shifts in the benchmark
yield curve. In the calculation of key rate durations instead of shifting the entire benchmark
yield curve, only key points are shifted, one at a time. The effective duration for each
maturity point shift is then calculated separately. Key rate durations help to identify the
“shaping risk” for bonds—that is, the bond’s sensitivity to changes in the shape of the yield
curve. Section 4.1.3. LO.k.
34. C is correct. Compared to the low coupon bond, the 10% putable bond (high coupon) is most
sensitive to changes in the 30-year rate, because it is unlikely to be put and thus behaves like
an otherwise identical option-free bond. Section 4.1.3. LO.k.
35. C is correct. The effective convexity of the callable bond turns negative when the call option
is near the money, because the upside for a callable bond is much smaller than the downside.
When interest rates decline, the price of the callable bond is capped by the price of the call
option if it is near the exercise date. When interest rates are high the value of the call option
is low, the callable and straight bond behave similarly from changes in interest rates – both
have positive convexity. Section 4.2. LO.l.
36. C is correct. A & B hold true for putable bonds. When the option is near the money, the
upside for a putable bond is much larger than the downside since putable bond price is
floored by the price of the put option near the exercise date. Putable bonds have more upside
potential than otherwise identical callable bonds when interest rates decline, because put
option is worthless, and putable bond is similar to straight bond in terms of price change,
whereas the call option is valuable which caps price appreciation in callable bonds. Section
4.2. LO.l.
37. B is correct. Valuation of the Three-Year Libor Floater Capped at 5.00%.
Today
Year 1
Year2
Year 3
C = 3.3
C = 106.2
R = 6.2
105.0
V = 98.870
C =1.0
C = 106.2
R = 3.3
105.0
V = 99.407
V = 99.684
C = 3.3
C = 105.1
R = 1.0
R = 5.1
105.0
V = 99.905
C = 2.7
C = 1.0
R = 2.7
V = 99.954
C = 105.1
105.0
C = 2.7
R = 4.2
V = 100
Copyright © IFT. All rights reserved.
C = 104.2
Page 13
Valuation and Analysis: Bonds with Embedded Options Q Bank
C = 104.2
C = Cash Flow (% of par)
R = One-Year Interest Rate (%)
V = Value of the Capped Floater
(% of par)
For each scenario, we check whether the cap applies, and if it does, the cash flow is adjusted.
For example, in state uuu, Libor is higher than the 5.00% cap. Thus, the coupon is capped at
the 5.00 maximum amount, and the cash flow is adjusted downward from the uncapped
amount (106.2) to the capped amount (105.0). The coupon is also capped for three other
scenarios in Year 3.
(105)
(105)
For Year 2: [1.062 + 1.062] × 0.5 = 98.870.
(105)
(105)
[1.051 + 1.051] × 0.5 = 99.905.
(104.2)
[ 1.042 +
For Year 1: [
[
(104.2)
1.042
(98.870+3.3)
1.033
(99.905+2.7)
1.027
+
(99.407+1.0)
For Year 0: [
Section 5.1. LO.m.
1.01
+
] × 0.5 = 100.
(99.905+3.3)
] × 0.5 = 99.407.
1.033
(100+2.7)
+
1.027
] × 0.5 = 99.954.
(99.954+1.0)
1.01
] × 0.5 = 99.684.
38. C is correct. Valuation of the Three-Year Libor Floored Floater at 3.25%.
Today
Year 1
Year2
Year 3
C = 3.3
C = 106.2
R = 6.2
V = 100
C =1.0
C = 106.2
3.25
R = 3.3
V = 100
V = 102.493
C = 3.3
C = 105.1
R = 1.0
R = 5.1
V = 100
C = 2.7
3.25
C = 1.0
3.25
R = 2.7
V = 100.536
C = 105.1
C = 2.7
3.25
R = 4.2
Copyright © IFT. All rights reserved.
C = 104.2
Page 14
Valuation and Analysis: Bonds with Embedded Options Q Bank
V = 100
C = 104.2
C = Cash Flow (% of par)
R = One-Year Interest Rate (%)
V = Value of the Capped Floater
(% of par)
(106.2)
For Year 2: [ 1.062 +
(105.1)
1.062
(105.1)
(104.2)
1.051
(104.2)
[ 1.051 +
[ 1.042 +
For Year 1: [
[
(106.2)
(100+3.3)
1.033
(100+3.25)
1.027
] × 0.5 = 100.
1.042
+
1.01
] × 0.5 = 100.
(100+3.3)
+
(100+3.25)
For Year 0: [
Section 5.2. LO.m.
] × 0.5 = 100.
] × 0.5 = 100.
1.033
(100+3.25)
+
1.027
] × 0.5 = 100.536.
(100.536+3.25)
1.01
] × 0.5 = 102.493.
39. A is correct. Conversion ratio = (𝐵𝑜𝑛𝑑 𝐴′𝑠 𝑝𝑎𝑟 𝑣𝑎𝑙𝑢𝑒)/(𝑖𝑛𝑖𝑡𝑖𝑎𝑙 𝑐𝑜𝑛𝑣𝑒𝑟𝑠𝑖𝑜𝑛 𝑝𝑟𝑖𝑐𝑒) =
100,000/7 = 14,285.71 ≅ 14,286 𝑠ℎ𝑎𝑟𝑒𝑠. Section 6.1. LO.n.o.
40. B is correct. The minimum value of the convertible bond is given as:
Maximum (Conversion Value, Straight Bond Value)
The Conversion Value of Bond A on 5 May 2016 = Share Price x no. of shares
$7.50 x 14,286 = $107,145
The Straight Bond Value of Bond A, is given as:
Using the FC: N= 4, I/Y = 5, PMT = 4.25, FV = 100,000; CPT PV = 82,285.32
Max ($107,145, $82,285) = $107,145. Section 6.2. LO.o.
41. B is correct. Value of callable convertible bond = Value of straight bond + Value of call
option on the issuer’s stock -Value of issuer call option. Section 6.3. LO.p.
42. C is correct. The conversion price = par value/conversion ratio = $1000/25 = $40 per share.
On 02 June 2016, the stock price of Company X = $54. The share price of $54 is well above
the conversion price of $40. The risk-return characteristics of the convertible bond are
similar to those of the underlying stock of Company X. When the underlying share price is
well below the conversion price, the convertible bond is described as “busted convertible”
and exhibits mostly bond risk–return characteristics, hence A & B are incorrect. Section 6.4.
LO.q.
Copyright © IFT. All rights reserved.
Page 15
Valuation and Analysis: Bonds with Embedded Options Q Bank
Set 2 Questions
The following information relates to questions 1-4.
Sienna Miller, CIO of a hedge fund, is interviewing Kumar for the post of a fixed income
analyst, and asks him to evaluate two bonds. Information on the bonds is given in Table 1:
Table 1: Bond Information
Bond
Maturity
C&N Corp. Bond (1) Three years
Coupon
4.5% annual
PBX Co. Bond (2)
4.5% annual
Three years
Type of Bond
Callable at par in one year &
two years from now
Putable at par in one year &
two years from now
Miller questions Kumar on how to determine the value of these bonds. Kumar responds by
stating, "For both bonds 1 & 2, the value of the bond is calculated by subtracting the value of the
embedded option from the value of the straight bond."
Miller next states, “"Interest rate volatility and the shape of the yield curve may also affect the
values of Bonds 1 & 2. Assume the following situations:
I: Interest rate volatility increases and the yield curve remains flat.
II: Interest rate volatility remains at the current 10% level and the yield curve flattens further
with rates rising in the 0 – 1 year maturity and declining in the 2-year maturity and above."
Miller inquires, about the impact on both bonds under each volatility and interest rate scenario.
1. The embedded option in both bonds (listed in Table 1), is most likely known as:
A. Bermudan-style.
B. European-style.
C. American-style.
2. Is Kumar correct about the valuation of bonds with embedded option?
A. Yes.
B. No, he is incorrect about the valuation of Bond 1.
C. No, he is incorrect about the valuation of Bond 2.
3. If Situation I occurs, it is most likely that the value of Bond 1:
A. and value of Bond 2 will fall.
B. will fall and value of Bond 2 will rise.
C. will rise and value of Bond 2 will fall.
4. If Situation II occurs, it is most likely that the value of Bond 1:
A. will rise more rapidly than the straight bond value and Bond 2 value will rise less rapidly
than the straight bond value.
B. and Bond 2 will rise less rapidly than the straight bond value.
C. will fall and value of Bond 2 will rise more rapidly than the straight bond value.
Copyright © IFT. All rights reserved.
Page 16
Valuation and Analysis: Bonds with Embedded Options Q Bank
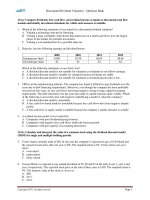
5. Li Min, fixed-income strategist, asks her intern to evaluate a three-year 5.25% annual coupon
bond callable at par ($100) in one year and two years from now using the binomial interest
rate tree depicted in Table 2.
Table 2. Binomial Interest Rate Tree at 10% Interest Rate Volatility
Year 0
Year 1
Year 2
2.50%
3.87%
5.52%
3.17%
4.52%
3.70%
Using the above information, the value of the bond is closest to:
A. $102.68.
B. $101.85.
C. $100.16.
6. Trudie Wilder, CFO, asks Bret Ruttie, recently hired quantitative analyst, about valuation
approaches of callable bonds. Ruttie responds by making the following statements:
Statement I: "One approach is to use a binomial interest rate tree and then use a process
of backward induction to determine the value of a default-free bond.
Statement II: To value risky bonds, option-adjusted spread (OAS) is used; OAS is a
constant spread that, when added to all the one-period forward rates on the interest rate
tree, makes the value of the bond equal to its market price.
Statement III: OAS may be used as a relative value measure. An OAS greater than the
OAS of bonds with similar characteristics and credit quality shows that it is most likely
underpriced. However, if interest rate volatility increases, then the OAS and thus relative
cheapness of a callable bond will increase."
Which of Ruttie’s statements is least likely correct?
A. Statement I.
B. Statement II.
C. Statement III.
The following information relates to questions 7 – 9.
Peter Han is a portfolio manager for a fixed-income fund that invests in corporate bonds,
including convertible bonds. One of the convertible bonds in the fund was issued on 3 March
2016 by Shou Heavy Industries. Each bond has a par value of CNY1,000,000. The initial
conversion price was CNY1,500. At the convertible bond issuance date, Shou’s common stock
was trading at CNY1,080. The bonds have a threshold dividend of CNY100 and a change of
control conversion price of CNY500.
On 4 March 2017, the market conversion price for Shou bonds was CNY1,600 and its common
shares closed at CNY995. The next day, Shou, paid a dividend (never previously paid) to
common shareholders of CNY150 per share.
Copyright © IFT. All rights reserved.
Page 17
Valuation and Analysis: Bonds with Embedded Options Q Bank
7. The conversion ratio of the Shou bonds on the date of issuance was closest to:
A. 925.93.
B. 666.67.
C. 2,000.
8. On 4 March 2017, the risk-return characteristics of Shou’s bonds most likely resemble those
of:
A. shares of common stock.
B. busted convertibles.
C. putable bond.
9. The dividend paid to Shou’s common stock holders will least likely affect the bond’s:
A. conversion ratio.
B. conversion price.
C. change of control conversion price.
10. Ann Georgiou, portfolio manager asks Libby Kareblo, junior fixed income analyst, about the
advantages of holding convertible bonds in a portfolio to investors. Kareblo explains, “The
first advantage is a higher coupon rate for investors than similarly rated option-free bond.
The second advantage is that the convertibles will generally increase in value if the
underlying common stock price increases.” Is Kareblo most likely correct regarding the two
advantages of investing in convertibles?
A. Yes.
B. No, she is incorrect regarding the increase in value.
C. No, she is incorrect regarding the higher coupon rate.
11. Greet Wilder, head of research, discusses convertible bonds that were issued by Haldrone
Corporation with a call option and a conversion price of ₤6.00 with his team members.
Haldrone’s common stock is currently trading at ₤5.625 and has been rising steadily for two
months. Wilder asks one of the analysts, “Will you convert the bonds if the common stock
price rises above the conversion price or wait and continue to receive the coupon payments?”
The analyst responds, “I’ll wait because the share price may trend further upwards.” Wilder
interjects, “No, bondholders will likely not be able to wait, since there’s a mechanism in
Haldrone bonds to protect existing shareholders.” The mechanism that Wilder refers to is
most likely a(n):
A. call option.
B. conversion period.
C. adjusted conversion price.
12. Shams Lakhani, fund manager DLB Asset Management Company, during a presentation to
portfolio managers, makes the following comments comparing the valuation of convertible
bonds with callable bonds:
Comment 1: “Value of a convertible bond is equal to the value of an otherwise identical
straight bond minus the value of a call option on the issuer’s stock. Hence, it is similar to the
value of a callable bond.
Copyright © IFT. All rights reserved.
Page 18
Valuation and Analysis: Bonds with Embedded Options Q Bank
Comment 2: The valuation procedure of a convertible is similar to the valuation of a bond
with embedded options. Its value is determined using an interest rate tree based on the given
yield curve and interest rate volatility assumptions. Backward induction process is applied to
calculate the bond’s present value after determining whether the embedded options will be
exercised at each node.
Comment 3: Convertible bonds are more complex than callable bonds because the analyst
must consider factors that may affect the issuer’s common stock, including dividend
payments and the issuer’s actions, plus market conditions and exogenous reasons that affect
the value of the issuer's common stock and the bond.”
Which of Lakhani’s comments is least likely correct?
A. 1.
B. 2.
C. 3.
The following information relates to questions 13-15.
Tom Bailey, a quantitative analyst, is asked to evaluate bonds with embedded options that are
currently perceived to be mispriced. He gathers data on a group of comparable bonds that have
the same market liquidity.
Table 3: Bond Features and Prices
Bond I
Remaining maturity
3 years
Credit rating
AA
Coupon rate
5.00%
Optionality
Callable
Price
102.282
Bond II
3 years
AA
5.00%
option-free
102.114
Bond III
3 years
AA
5.00%
Putable
102.397
Bailey’s supervisor tells him that the research desk has just circulated an interest rate forecast
according to which the interest rate volatility is expected to decrease and the yield curve, which
is currently flat, is expected to become upward sloping. He asks Bailey to consider the impact of
these expected changes on the values of the bonds given in Table 3.
13. Assuming Bond II is correctly priced, given the information in Table 3, is Bond I mispriced?
A. No.
B. Yes.
C. Lack of sufficient information to determine mispricing.
14. If the interest rate volatility changes in the way forecasted, which bond in Table 3 will most
likely experience the largest decrease in price?
A. Bond I.
B. Bond II.
C. Bond III.
Copyright © IFT. All rights reserved.
Page 19
Valuation and Analysis: Bonds with Embedded Options Q Bank
15. If the shape of the yield curve changes as forecasted, and price of Bond II does not change,
the price of Bond III will most likely:
A. decrease.
B. increase.
C. not change.
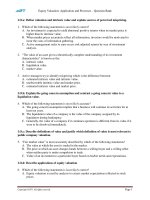
16. Akash Bhavin analyzes Bond T, a three year 4.75% annual-pay coupon bond putable at 98
one year and two years from now. He assumes 15% interest rate volatility and, using yields
on par bonds, constructs the binomial interest rate tree given in Table 4.
Table 4: Binomial Interest Rate Tree
Year 0
Year 1
Year 2
4.20%
5.51%
7.14%
4.08%
5.29%
3.92%
Using the interest rate tree given in Table 4, the value of the putable bond is closest to:
A. 97.965.
B. 99.986.
C. 101.236.
17. Shermeen Ojas, portfolio manager, is evaluating a 5-year putable bond recently purchased by
a client. She calculates the current and the expected values of the bond if market interest rates
were to rise or fall by 30 basis points (bps). Ojas then uses the estimated values of the bond
given in Table 5 to determine the effective duration.
Table 5: Value of 5-year Putable Bond
Change in interest rates
+30 bps
Value of bond
96.890
No change
98.875
-30 bps
100.699
The effective duration calculated by Ojas is closest to:
A. 6.4.
B. 7.0.
C. 3.1.
18. Pal Lakshay, senior fixed income portfolio manager, while discussing the effective duration
and convexity of bonds with his colleagues makes the following comments:
Comment I: “The effective duration of a callable or a putable bond cannot be greater than
that of an otherwise identical option-free bond.
Comment II: The effective convexity of a callable bond is always positive whereas the
effective convexity of a putable bond turns negative when the put is near the money.
Comment III: The option-free bonds have low positive convexity.”
Which of Lakshay’s three comments is least likely correct?
A. Comment I.
B. Comment II.
C. Comment III.
Copyright © IFT. All rights reserved.
Page 20
Valuation and Analysis: Bonds with Embedded Options Q Bank
The following information relates to questions 19 – 22.
Andy Sloan, chief investment officer at Puth Investments, a firm specializing in fixed- income
portfolio management, would like to add bonds with embedded options to the firm’s bond
portfolio. He asks Su Crane, one of the firm’s senior analysts, to analyse and select bonds for the
firm’s bond portfolio.
Crane first chooses two corporate bonds that are callable at par and uses the option
adjusted spread (OAS) approach to analyse the bonds, assuming an interest rate volatility
of 15%. The following Table 6 presents the results of her approach.
Table 6: Crane’s Analysis Using OAS Approach
Bond*
OAS
Bond S
28.5 bps
Bond T
33.6 bps
*
Both bonds have the same maturity credit ratings and call dates.
Crane then selects the following four bonds issued by Dragnet Industries listed in Table 7.
Table 7: Dragnet Industries’ Bonds
Bond
Coupon
Bond P
5.00% annual
Bond Q
5.00% annual
Maturity
3 years
3 years
Bond R
3 years
5.00% annual
Special Provision
option- free bond
Callable at par in one
year & two years
Putable at par in one
year & two years
Bond V
One- year Libor
3 years
annually,
set in arrears
Note: These bonds have the same credit quality.
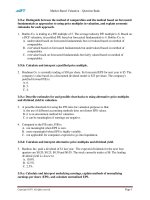
To value the Dragnet Industries’ bonds, Crane uses constructs the binomial interest rate tree
presented in Table 8 with an interest rate volatility of 10%.
Table 8
Year 0
2.00%
Year 1
3.90%
3.20%
Year 2
5.50%
4.50%
3.70%
Finally, Sloan wants Crane to determine the sensitivity of Bond Q’s price to a 30 bps parallel
shift of the benchmark yield curve. Crane calculates Bond Q’s price as 103.245% of par for a 30
bps parallel shift down in interest rates, and 102.639% of par for a 30 bps shift up in interest
rates.
Copyright © IFT. All rights reserved.
Page 21
Valuation and Analysis: Bonds with Embedded Options Q Bank
19. Based on Table 6, compared to Bond S, Bond T is most likely:
A. underpriced.
B. overpriced.
C. fairly priced.
20. The effective duration of Bond V is closest to:
A. higher than 3.
B. higher than or equal to 2.
C. lower than or equal to 1.
21. Using Table 7, if interest rates increase, the bond whose effective duration will lengthen is
most likely:
A. Bond P.
B. Bond Q.
C. Bond R.
22. Using Table 8, if the current full price of the bond (with no shift) is 102.941% of par, the
effective duration of Bond Q is closest to:
A. 1.70.
B. 0.98.
C. 0.93.
The following information relates to questions 23 – 24.
Bella Hadim, a fixed-income analyst has been assigned to value two floating-rate bonds issued
by Dymax Inc. given in Table 9. Both bonds have a maturity of three years and the same credit
quality.
Table 9
Bond I
Bond II
One-year
Libor annually, set in arrears, capped at
4.00%
One-year
Libor annually, set in arrears, floored at
3.00%
Using the binomial interest rate tree given below, Hadim calculates the value of the Dymax
bonds.
Year 0
Year 1
Year 2
2.50%
4.63%
5.33%
3.43%
3.95%
2.93%
Hadim’s analysis for the 4.5% capped floater is shown below:
Table 10: Valuation of Bond I.
Copyright © IFT. All rights reserved.
Page 22
Valuation and Analysis: Bonds with Embedded Options Q Bank
Today
Year 1
Year2
C = 4.63
4.00
R = 5.33
V = 98.737
C =2.5
R = 4.63
V = 98.794
R = 2.50
Year 3
C = 105.33
104.00
C = 105.33
104.00
C = 4.63
4.00
R = 3.95
V = 100
C = 103.95
C = 3.43
C = 2.5
R = 3.43
V = 100
C = Cash Flow
(% of par)
R = One-Year
Interest Rate (%)
V = Value of the
Capped Floater
(% of par)
C = 103.95
C = 3.43
R = 2.93
V = 100
C = 102.93
C = 102.93
23. Using Table 10, the value of Bond I is closest to:
A. 100.00% of par.
B. 99.41% of par.
C. 97.83% of par.
24. Using Table 9, the value of Bond II is closest to:
A. 100.5% of par.
B. 101.4% of par.
C. 99.97% of par.
The following information relates to questions 25 – 29.
Tom Holland, chief investment officer Zavier Investment Advisors during his meeting with the
analysts discusses the impact of weakening economic activity. The equity market values are
predicted to decline in the coming year and the negative GDP growth rate of the previous
quarters is not expected to improve. Holland wants the investors to consider adding more fixedincome securities to their portfolios and limiting their equity exposure.
Copyright © IFT. All rights reserved.
Page 23
Valuation and Analysis: Bonds with Embedded Options Q Bank
Holland observes, “Because of low government yields we should consider investment- grade
corporate bonds over government securities. According to the consensus forecast among
economists, the central bank is expected to lower interest rates in their upcoming meeting.”
After the meeting, Zandya Coleman, a fixed-income analyst selects the following four fixed- rate
investment- grade bonds issued by Bliss Paper Company for investment (Exhibit 1).
Exhibit 1: Bliss Paper Company’s Fixed-Rate Bonds
Bond
Annual Coupon
Type
*
Bond X
2.0%
Straight bond
Bond Y
2.0%
Callable at par without a lockout period
Bond Z
2.0%
Putable at par one and two years from now
Bond S
2.0%
Convertible bond: currently out of money
*
Note: All bonds have a remaining maturity of three years.
Coleman finds that demand for consumer credit is relatively strong, despite other poor
macroeconomic indicators. As a result, she believes that volatility in interest rates will increase.
Coleman also reads a report from Thomson Crew, a reliable financial and economic information
provider, forecasting that the yield curve may invert in the coming months.
25. Based on Exhibit 1, if the forecast for interest rates and equity returns are proven accurate,
which bond’s option is most likely to be exercised?
A. Bond Y.
B. Bond Z.
C. Bond S.
26. Based on Exhibit 1, Bond X is most likely trading at a current price higher than the price of:
A. Bond Y.
B. Bond Z.
C. Bond S.
27. Assuming the interest rates forecast is proven accurate, the bond with the smallest price
increase is most likely:
A. Bond X.
B. Bond Y.
C. Bond Z.
28. If the forecast of the interest rate volatility proves accurate, the bond with the greatest price
increase is most likely:
A. Bond Y.
B. Bond Z.
C. Bond S.
29. If Thomson Crew’s forecast comes true, the value of the embedded option will most likely
increase in:
A. Bond Y.
Copyright © IFT. All rights reserved.
Page 24
Valuation and Analysis: Bonds with Embedded Options Q Bank
B. Bond Z.
C. Both Bond Y and Z.
The following information relates to questions 30 – 33.
Julianne Maurice, a fixed-income analyst for Chariot Investments, Inc. collects data on three
corporate bonds, given below.
Bond
Annual Coupon
Type
Price
Bond S
4.5%
Callable at par one year & two
101.300
years from now
Bond T
4.5%
Option-free
102.400
Bond U
4.5%
Putable at par one year & two
103.200
years from now
Note: Each bond has a maturity of three years remaining and a credit rating of BBB+.
30. If benchmark yields fall, which bond would most likely exhibit a decline in effective
duration?
A. Bond S.
B. Bond T.
C. Bond U.
31. For Bond S, one-sided:
A. up-duration will be lesser than one-sided down-duration.
B. up-duration will be greater than one-sided down-duration.
C. up-duration and one-sided down duration will be equal.
32. The key rate duration which is the largest for Bond T is:
A. one-year key rate duration.
B. two-year key rate duration.
C. three-year key rate duration.
33. The bond which has most likely the lowest effective convexity is:
A. Bond S.
B. Bond T.
C. Bond U.
Copyright © IFT. All rights reserved.
Page 25