CFA 2018 quest bank 04 free cash flow valuation
Bạn đang xem bản rút gọn của tài liệu. Xem và tải ngay bản đầy đủ của tài liệu tại đây (399.36 KB, 62 trang )
Free Cash Flow Valuation
Test ID: 7441130
Question #1 of 145
Question ID: 463221
An analyst has prepared the following scenarios for Schneider, Inc.:
Scenario 1 Assumptions:
Tax rate is 40%.
Weighted average cost of capital (WACC) = 12%.
Constant growth rate in free cash flow = 3%.
Last year, free cash flow to the firm (FCFF) = $30.
Target debt ratio = 10%.
Scenario 2 Assumptions:
Tax rate is 40%.
Expenses before interest and taxes (EBIT), capital expenditures, and depreciation will grow at 15% for the next three
years.
After three years, the growth in EBIT will be 2%, and capital expenditure and depreciation will offset each other.
WACC during high growth stage = 20%.
WACC during stable growth stage = 12%.
Target debt ratio = 10%.
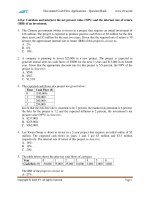
Year 0
Scenario 2 FCFF
(last
Year 1
Year 2
Year 3
Year 4
$15.00
$17.25
$19.84
$22.81
$23.27
Capital Expenditures
6.00
6.90
7.94
9.13
Depreciation
4.00
4.60
5.29
6.08
Change in Working Capital
2.00
2.10
2.20
2.40
2.40
5.95
7.06
8.25
11.56
year)
EBIT
FCFF
Assuming that Schneider, Inc., slightly increases its financial leverage, what should happen to its firm value? The firm value
should:
ᅚ A) increase due to the additional value of interest tax shields.
ᅞ B) not change because financial leverage has no relationship with firm value.
ᅞ C) decline due to the increase in risk.
Explanation
For small changes in leverage, the additional value added by the interest tax shields will more than offset the additional risk of bankruptcy
/ financial distress. Given the tax advantage of debt, the firm's WACC should decline, not increase with small changes in leverage.
Questions #2-7 of 145
Harrisburg Tire Company (HTC) forecasts the following for 2013:
Earnings (net income) = $600M.
Dividends = $120M.
Interest expense = $400M.
Tax rate = 40.0%.
Depreciation = $500M.
Capital spending = $800M.
Total assets = $10B (book value and market value).
Debt = $4B (book value and market value).
Equity = $6B (book value and market value).
Target debt to asset ratio = 0.40.
Shares outstanding = 2.0 billion
The firm's working capital needs are negligible, and HTC plans to continue to operate with the current capital structure.The tire industry
demand is highly dependent on demand for new automobiles. Individual companies in the industry don't have much influence on the
design of automobiles and have very little ability to affect their business environment. The demand for new automobiles is highly cyclical
but demand forecast errors tend to be low.
Question #2 of 145
Question ID: 463279
The firm's earnings growth rate is most accurately estimated as:
ᅞ A) 6.4%.
ᅞ B) 4.8%.
ᅚ C) 8.0%.
Explanation
The firm's estimated earnings growth rate is the product of its retention ratio and ROE:
g = RR × (ROE) = [(600 − 120) / 600] × (600 / 6000) = 0.08 (LOS 35.o)
Question #3 of 145
The 2013 forecasted free cash flow to equity is:
ᅞ A) $300M.
ᅚ B) $420M.
ᅞ C) $340M.
Explanation
Since working capital needs are negligible, the free cash flow to equity is:
FCFE = Net income − [1 − DR)] × [FCInv − Depreciation] − [(1 − DR) × WCInv]
FCFE = 600M − [1 − 0.4] × (800M − 500M) = 420M
where:
DR = target debt to asset ratio (LOS 36.d)
Question ID: 463280
Question #4 of 145
Question ID: 463281
If the total market value of equity is $6.0 billion and the growth rate is 8.0%, the cost of equity based on the stable growth FCFE model is
closest to:
ᅞ A) 15.0%.
ᅞ B) 7.6%.
ᅚ C) 15.6%.
Explanation
Value of equity = FCFE1/(Cost of equity - growth rate); so $6,000 = [$420 × (1.08)]/(Cost of equity - 0.08)
(Cost of equity - 0.08) × $6,000 = $453.6
Cost of equity - 0.08 = 0.0756
Cost of equity = 0.1556 = 15.56% (LOS 36.j)
Question #5 of 145
Question ID: 463282
The beta for HTC is 1.056, the risk-free rate is 5.0% and the market risk premium is 10.0%. The weighted average cost of capital for HTC
is closest to:
ᅚ A) 11.74%.
ᅞ B) 13.34%.
ᅞ C) 15.56%.
Explanation
Cost of equity = rf + (rm - rf) = 0.05 + 1.056(0.10) = 0.05 + 0.1056 = 0.1556
The best approximation for cost of debt is the interest expense divided by the market value of the debt.
Cost of debt = Interest expense/market value of debt = $400 million/$4.0 billion = 0.10
WACC = wd × rd × (1 - t) + we × re = 0.40 × 0.10 × (1 - 0.40) + 0.60 × 0.1556 = 0.1174 (LOS 36.j)
Question #6 of 145
Question ID: 463283
The most appropriate strategy formulation style for HTC is:
ᅞ A) Adaptive
ᅚ B) Classical
ᅞ C) Shaping
Explanation
Industry demand is cyclical but forecast errors tend to be low - indicating predictable business environment. We are also given that
malleability is low. Hence Classical style would be most appropriate. (LOS 33.c)
Question #7 of 145
Question ID: 463284
FCFE for 2013 is $400.0 million; and HTC took on an additional debt of $40.0 million while repaying existing debt of $60.0
million. The growth rate for FCFF is 5.0% and the WACC is 11.5%. The value of the firm calculated using the stable growth
model is most accurately described as:
ᅞ A) less than the market value of the firm by $3.3 billion.
ᅞ B) less than the market value of the firm by $7.5 billion.
ᅚ C) greater than the market value of the firm by $0.7 billion.
Explanation
FCFF = FCFE + Interest expense × (1 - t) - net borrowing = $400 million + $400 million × (1- 0.40) - ($40 million - $60 million)
= $660 million.
Value of the firm = [$660 million × (1.05)]/(0.115 -0.05) = $10.662 billion. This is a difference of $0.662 billion compared to the
$10.0 billion current market value. (LOS 36.j,m)
Question #8 of 145
Question ID: 463199
A firm currently has sales per share of $10.00, and expects sales to grow by 25% next year. The net profit margin is expected to be 15%.
Fixed capital investment net of depreciation is projected to be 65% of the sales increase, and working capital requirements are 15% of the
projected sales increase. Debt will finance 45% of the investments in net capital and working capital. The company has an 11% required
rate of return on equity. What is the firm's expected free cash flow to equity (FCFE) per share next year under these assumptions?
ᅞ A) $0.38.
ᅞ B) $1.88.
ᅚ C) $0.77.
Explanation
FCFE = net profit - NetFCInv - WCInv + DebtFin = $1.88 - $1.63 - 0.38 + 0.90 = 0.77
Question #9 of 145
Question ID: 463244
In using FCFE models, the assumption of growth should be:
ᅞ A) independent from the assumptions of other variables.
ᅞ B) only consistent with the assumptions of capital spending and depreciation.
ᅚ C) consistent with assumptions of other variables.
Explanation
The assumption of growth should be consistent with assumptions about other variables. Net capital expenditures (capital
expenditures minus depreciation) and beta (risk) used to calculate required rate of return should be consistent with assumed
growth rate.
Question #10 of 145
Which of the following statements about the three-stage FCFE model is most accurate?
ᅞ A) There is a final phase when growth rate starts to decline.
Question ID: 463232
ᅚ B) There is a transition period where the growth rate declines.
ᅞ C) There is a transition period where the growth rate is stable.
Explanation
In the three-stage FCFE model, there is an initial phase of high growth, a transition period where the growth rate declines, and
a steady-state period where growth is stable.
Questions #11-16 of 145
Michael Ballmer is an equity analyst with New Horizon Research. The firm has historically relied on dividend and residual
income valuation models to value equity, but the firm's director of research, Doug Leads, has decided that the firm needs to
incorporate free cash flow valuations into its practices. Therefore, Leads decides to send Ballmer to a seminar on free cash
flow valuation.
Upon his return from the convention, Ballmer is excited to share his newfound knowledge with his co-workers. Ballmer is asked
to give a debriefing to New Horizon's team of equity analysts, where he makes the following statements:
Statement
1:
Free cash flow to the firm is the amount of the firm's cash flow that is
free for the firm to use in making investments after cash operating
expenses have been covered.
Statement
2:
Free cash flow to equity, then, is the amount of the firm's cash flow
that is free for equity holders after covering cash operating expenses,
working capital and fixed capital investments, interest principal
payments to bondholders, and required divided payments.
Statement
3:
One of the benefits of free cash flow valuation is that the value of the
firm and the value of equity can be found by discounting free cash
flow to the firm and free cash flow to equity, respectively, by the
WACC.
As part of his presentation, Ballmer includes a short example of how to calculate free cash flow to equity. The figures from his
example are included below.
Figure 1: Example Balance Sheet
20X2
20X1
Cash
$632
$245
Accounts receivable
$208
$105
Inventory
$8,249
$8,209
Current assets
$9,089
$8,559
Gross PPE
$22,499 $22,722
Accumulated depreciation
($3,251) ($2,875)
Total assets
$28,337 $28,406
Accounts payable
$4,864
$4,543
Short-term debt
$2,491
$2,996
Current liabilities
$7,355
$7,539
Long-term debt
$4,528
$5,039
Common stock
$729
$735
Retained earnings
$15,725 $15,093
Total liabilities and owner's
equity
$28,337 $28,406
Figure 2: Example Cash Flow From
Operations
20X2
Net income
20X1
$1,783 $2,195
Depreciation
$376
$267
WCInv
($178)
$357
Cash flow from
operations
$2,337 $2,819
After discussing the calculation of free cash flow to the firm and free cash flow to equity from historical information, Ballmer
proceeds to explain the major approaches for forecasting free cash flow. He focuses his discussion on forecasting the
components of free cash flow as this method is more flexible. During his presentation, several of the analysts notice that the
formula for forecasting free cash flow to equity does not include net borrowing. They bring this to Ballmer's attention, and he
states that he will look into the formula and send out an updated presentation after the meeting.
A week after the meeting, Jonathan Hodges approached Ballmer regarding two issues he had while applying free cash flow
based valuations. The first issue that Hodges had was that he calculated the equity value of a firm using both free cash flow to
equity based and dividend-based valuations and arrived at different values. The second issue that Hodges came across was
the effect of a change in a firm's target leverage on FCFE. One of the firms that Hodges was analyzing may reduce leverage,
and Hodges needs to know if this will affect his valuation.
Question #11 of 145
Question ID: 463179
Regarding statements 1 and 2, are Ballmer's interpretations of free cash flow to the firm (FCFF) and free cash flow to equity
(FCFE) CORRECT?
ᅚ A) No, neither interpretation is correct.
ᅞ B) No, only one interpretation is correct.
ᅞ C) Yes, both interpretations are correct.
Explanation
Free cash flow to the firm (FCFF) is the cash flows that are free to investors after cash operating expenses (including taxes
but excluding interest expense), working capital investments, and fixed capital investments have been made. Free cash flow to
equity (FCFE) is FCFF less interest payments to bondholders and net borrowing from bondholders. (Study Session 12, LOS
36.a)
Question #12 of 145
Is Ballmer's third statement regarding the computation of firm value and equity value CORRECT?
ᅞ A) Yes.
Question ID: 463180
ᅚ B) No, free cash flow to equity should be discounted at the required return on equity.
ᅞ C) No, both free cash flow to the firm and free cash flow to equity should be discounted
at the required rate of return on equity.
Explanation
The value of a firm is the expected future free cash flow to the firm (FCFF) discounted at the firm's weighted average cost of
capital (WACC). The value of the firm's equity is the expected future free cash flow to equity discounted at the required return
on equity. (Study Session 12, LOS 36.d)
Question #13 of 145
Question ID: 463181
Based on figures 1 and 2, the 20X2 free cash flow to equity (FCFE) for Ballmer's example firm is:
ᅞ A) $1,010.
ᅞ B) $1,693.
ᅚ C) $1,544.
Explanation
Free cash flow to equity (FCFE) can be computed as:
FCFE = CFO − FCInv + net borrowing
Based on the figures included in the example, fixed capital investment (FCInv) is −$223 (= $22,499 − $22,722) and net
borrowing is −$1,016 (= $2,491 + $4,528 − $2,996 − $5,039).
FCFE is therefore: FCFE = $2,337 + $223 − $1,016 = $1,544. (Study Session 12, LOS 36.d)
Question #14 of 145
Question ID: 463182
Which of the following statements regarding forecasting FCFE using the components of free cash flow method and net
borrowing is most accurate?
ᅞ A) Investment in fixed capital and net borrowing are assumed to offset each other.
ᅞ B) Net income already accounts for interest expense; therefore, net borrowing is not
needed.
ᅚ C) The target debt-to-asset ratio accounts for the financing of new investment in fixed
capital and working capital.
Explanation
When forecasting FCFE, it is common to assume that a firm will maintain a target debt-to-asset ratio for new investments in
fixed capital and working capital. Based on this assumption, the formula for forecasting FCFE is:
FCFE = NI &£8722; [(1 − DR) × (FCInv − Dep)] − [(1 − DR) × WCInv]
By multiplying the fixed capital and working capital investments by one minus the target debt-to-asset ratio, you are left with
the investment amount less the amount financed by debt, which is the net borrowing amount. Therefore, this formula accounts
for net borrowing through the target debt-to-asset ratio. (Study Session 12, LOS 36.e)
Question #15 of 145
Question ID: 463183
Should dividend-based and free cash flow from equity (FCFE) based valuations result in different equity values for a firm?
ᅞ A) Yes, dividend-based valuations would be higher for firms with large, consistent
dividends.
ᅚ B) Yes, the free cash flow from equity valuation would be higher if there were a premium
associated with control of the firm.
ᅞ C) No, both models should result in the same value.
Explanation
The ownership perspectives of dividend-based and FCFE based valuations are different. Dividend-based valuations take the
perspective of minority shareholders, while FCFE based valuations take the perspective of an acquirer who will assume a
controlling position in the firm. If investors were willing to pay a premium for a controlling position in the firm, then the equity
value computed under the FCFE approach would be higher. (Study Session 12, LOS 36.b)
Question #16 of 145
Question ID: 463184
Which of the following statements regarding the effect a decrease in leverage has on a firm's free cash flow from equity
(FCFE) is most accurate?
ᅞ A) FCFE is unaffected by changes in leverage.
ᅞ B) Current year FCFE increases, but future FCFE will be reduced.
ᅚ C) Current year FCFE decreases, but future FCFE will be increased.
Explanation
Changes in leverage do have a small effect on FCFE. A decrease in leverage will cause the current year FCFE to decrease
through the repayment of debt. Future FCFE will be increased because interest expense will be lower. (Study Session 12, LOS
36.g)
Question #17 of 145
Question ID: 463243
A three-stage free cash flow to the firm (FCFF) is typically appropriate when:
ᅞ A) growth is currently low and will move through a transitional stage to a final stage
wherein growth exceeds the required rate of return.
ᅚ B) growth is currently high and will move through a transitional stage to a steady-state growth
rate.
ᅞ C) the required rate of return is less than the growth rate in the last stage.
Explanation
The three-stage model using either FCFE or FCFF typically assumes that growth is currently high and will move through a transitional
stage to a steady-state growth rate. Multi-stage models assume that the required rate of return exceeds the growth rate in the last stage.
Question #18 of 145
Question ID: 463225
Which of the following statements regarding dividends and free cash flow to equity (FCFE) is least accurate?
ᅞ A) FCFE can be negative but dividends cannot.
ᅚ B) Required returns are higher in FCFE discount models than they are in dividend discount
models, since FCFE is more difficult to estimate.
ᅞ C) FCFE discount models usually result in higher equity values than do dividend discount models
(DDMs).
Explanation
Although FCFE may be more difficult to estimate than dividends, the required return is based on the risk faced by the shareholders, which
would be the same under both models.
Questions #19-24 of 145
An analyst has prepared the following scenarios for Schneider Inc.:
Scenario 1 Assumptions:
Tax Rate is 40%.
Weighted average cost of capital (WACC) = 12.0%.
Constant growth rate in free cash flow (FCF) = 3.0%.
Year 0, free cash flow to the firm (FCFF) = $30.0 million
Target debt ratio = 10.0%.
Scenario 2 Assumptions:
Tax Rate is 40.0%.
Expenses before interest and taxes (EBIT), capital expenditures, and depreciation will grow at 20.0% for the next three
years.
After three years, the growth in EBIT will be 2.0%, and capital expenditure and depreciation will offset each other.
Weighted average cost of capital (WACC) = 12.0%
Target debt ratio = 10.0%.
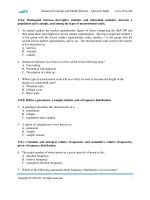
Year 0 Year 1 Year 2 Year 3 Year 4
Scenario 2 FCFF (in $ millions)
Year 0
EBIT
$45.00 $54.00 $64.80 $77.76 $79.70
Capital Expenditures
18.00
21.60
25.92
31.10
Depreciation
12.00
14.40
17.28
20.74
Change in Working Capital
6.00
6.30
6.60
7.20
7.20
18.90
23.64
29.09
40.62
FCFF
Other financial items for Schneider Inc.:
Estimated market value of debt = $35.0 million
Cost of debt = 5.0%
Shares outstanding = 20 million.
Question #19 of 145
Question ID: 463248
Given the assumptions contained in Scenario 1, the value of the firm is most accurately estimated as:
ᅚ A) $343 million.
ᅞ B) $250 million.
ᅞ C) $333 million
Explanation
Under the stable growth FCFF model, the value of the firm = FCFF 1 / (WACC − gn) = $30 million × (1.03) / (0.12 − 0.03) =
$343.33 million.
(LOS 36.j)
Question #20 of 145
Question ID: 463249
In Scenario 2, the year 0 free cash flow to the firm (FCFF) is closest to
ᅚ A) $15 million.
ᅞ B) $16 million.
ᅞ C) $27 million.
Explanation
FCFF = EBIT × (1 − tax rate) + Depreciation − Capital Expenditures − Change in Working Capital = 45.0 × (1 − 0.4) + 12.0 −
18.0 − 6.0 = 15.00.
(LOS 36.d)
Question #21 of 145
Question ID: 463250
In Scenario 2, the present value of the terminal value is closest to:
ᅚ A) $289 million.
ᅞ B) $347 million.
ᅞ C) $258 million.
Explanation
The terminal value is: FCFF for year 4/(WACC - growth rate) = $40.62/(0.12 - 0.02) = $406.22 million in terms of year 3
dollars. The calculator inputs to solve for the present value is: FV = $406.22, N = 3, I/Y = 12 solve for PV. PV is $289.14
Million. (LOS 36.e)
(LOS 36.e)
Question #22 of 145
In Scenario 2, the value of the firm is closest to:
ᅞ A) $315 million.
Question ID: 463251
ᅚ B) $346 million.
ᅞ C) $321 million.
Explanation
The value of the firm is the present value of Year 1-3 plus the terminal value. The terminal value is: FCFF for year 4/(WACC growth rate) = $40.62/(0.12 - 0.02) = $406.22 million in terms of year 3 dollars. The calculator inputs to solve NPV for the
value of the firm is: CF0 = $0, CF1 = $18.90, CF2 = $23.64, CF3 = $29.09 + $406.22 = $435.31, I =12. NPV = $345.57 million.
(LOS 36.d)
Question #23 of 145
Question ID: 463252
The cost of equity for Schneider Inc. is closest to:
ᅚ A) 13.0%.
ᅞ B) 5.8%.
ᅞ C) 11.3%
Explanation
The weighted average cost of capital formula is WACC = wd × rd × (1 − t) + we × re. The weight of debt is 10.0% − the weight of
equity must be 90.0%.
0.12 = 0.10 × 0.05 × (1 − 0.40) + 0.90 × re
0.120 - 0.003 = 0.90 × re
0.117/0.9 = re
re = 13.0%
(LOS 36.j)
Question #24 of 145
Question ID: 463253
The market value of Scheider Inc.'s stock is:
ᅞ A) $17.50 per share.
ᅚ B) $15.75 per share
ᅞ C) $31.50 per share.
Explanation
The estimated market value of debt is $35 million, which represents 10.0% of the value of the firm. The other 90.0% is the
value of equity or $315 million. $315 million/20 million shares = $15.75 per share.
(LOS 36.j)
Question #25 of 145
Question ID: 463185
An analyst is performing an equity valuation for a minority equity position in a dividend paying multinational. The appropriate
model for this analysis is most likely:
ᅞ A) FCFE approach.
ᅚ B) The Dividend Discount approach.
ᅞ C) FCFF approach.
Explanation
The dividend discount model is most appropriate for valuing a minority equity position in a dividend-paying company. The free
cash flow approach looks to the source of dividends from the perspective of an owner that has control rather than directly at
dividends.
Question #26 of 145
Question ID: 463217
An increase in financial leverage will cause free cash flow to equity (FCFE) to:
ᅚ A) increase in the year the borrowing occurred.
ᅞ B) decrease in the year the borrowing occurred.
ᅞ C) decrease or increase, depending on its circumstances.
Explanation
An increase in financial leverage will increase net borrowing and, hence, increase FCFE in the year the borrowing occurred because:
FCFE = FCFF - [interest expense] (1 - tax rate) + net borrowing.
Questions #27-32 of 145
Burcar-Eckhardt, a firm specializing in value investments, has been approached by the management of Overhaul Trucking,
Inc., to explore the possibility of taking the firm private via a management buyout. Overhaul's stock has stumbled recently, in
large part due to a sudden increase in oil prices. Management considers this an opportune time to take the company private.
Burcar would be a minority investor in a group of friendly buyers.
Jaimie Carson, CFA, is a private equity portfolio manager with Burcar. He has been asked by Thelma Eckhardt, CFA, one of
the firm's founding partners, to take a look at Overhaul and come up with a strategy for valuing the firm. After analyzing
Overhaul's financial statements as of the most recent fiscal year-end (presented below), he determines that a valuation using
Free Cash Flow to Equity (FCFE) is most appropriate. He also notes that there were no sales of PPE.
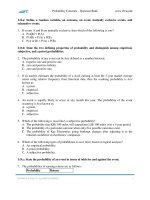
Overhaul Trucking, Inc.
Income Statement
April 30, 2005
(Millions of dollars)
2005 2006E
Sales
300.0
320.0
Gross Profit
200.0
190.0
SG&A
50.0
50.0
Depreciation
70.0
80.0
EBIT
80.0
60.0
Interest Expense
30.0
34.0
Taxes (at 35 percent)
17.5
9.1
Net Income
32.5
16.9
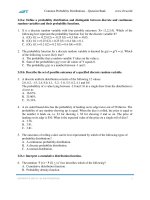
Overhaul Trucking, Inc.
Balance Sheet
April 30, 2005
(Millions of dollars)
2005
2006E
Cash
10.0
15.0
Accounts Receivable
50.0
55.0
Gross Property, Plant & Equip.
400.0
480.0
Accumulated Depreciation
(160.0) (240.0)
Total Assets
300.0
310.0
Accounts Payable
50.0
70.0
Long-Term Debt
140.0
113.1
Common Stock
80.0
80.0
Retained Earnings
30.0
46.9
Total Liabilities & Equity
300.0
310.0
Eckhardt agrees with Carson's choice of valuation method, but her concern is Overhaul's debt ratio. Considerably higher than
the industry average, Eckhardt worries that the firm's heavy leverage poses a risk to equity investors. Overhaul Trucking uses
a weighted average cost of capital of 12% for capital budgeting, and Eckhardt wonders if that's realistic.
Eckhardt asks Carson to do a valuation of Overhaul in a high-growth scenario to see if optimistic estimates of the firm's nearterm growth rate can justify the required return to equity. For the high-growth scenario, she asks him to start with his 2006
estimate of FCFE, grow it at 30% per year for three years and then decrease the growth rate in FCFE in equal increments for
another three years until it hits the long-run growth rate of 3% in 2012. Eckhardt tells Carson that the returns to equity BurcarEckhardt would require are 20% until the completion of the high-growth phase, 15% during the three years of declining growth,
and 10 percent thereafter. Eckhardt wants to know what Burcar could afford to pay for a 15% stake in Overhaul in this highgrowth scenario.
Carson assembles a few spreadsheets and tells Eckhardt, "We could make a bid of just under $16 million for the stake in
Overhaul if the high-growth scenario plays out." Eckhardt worries, though, that the value of their bid is extremely sensitive to
the assumption for terminal growth, since in that scenario, the terminal value of the firm accounts for slightly more than twothirds of the total value.
Carson agrees, and proposes doing a valuation under a "sustained growth" scenario. His estimates show Overhaul growing
FCFE by the following amounts:
2007
2008
2009
2010
2011
Growth in FCFE 40.0% 15.7% 8.6%
9.1%
8.3%
In this scenario, he would project sustained growth of 6% per year in 2012 and beyond. With the more stable growth pattern in
cash flow, Eckhardt and Carson agree that the required return to equity could be cut to a more moderate 12%.
Carson also decides to try valuing the firm on Free Cash Flow to the Firm (FCFF) using this same 12% required return. Using
a single-stage model on the estimated 2006 figures presented in the financial statements above, he comes up with a valuation
of $1.08 billion.
Question #27 of 145
Question ID: 463300
Which of the following is one of the differences between FCFE and FCFF? FCFF does not deduct:
ᅞ A) working capital investment.
ᅞ B) operating expenses.
ᅚ C) interest payments to bondholders.
Explanation
FCFF includes the cash available to all of the firm's investors, including bondholders. Therefore, interest payments to
bondholders are not removed from revenues to derive FCFF. FCFE is FCFF minus interest payments to bondholders plus net
borrowings from bondholders. (Study Session 10, LOS 30.a)
Question #28 of 145
Question ID: 463301
Which of the following is the least likely reason for Carson's decision to use FCFE in valuing Overhaul rather than FCFF?
ᅞ A) Overhaul's capital structure is stable.
ᅞ B) FCFE is an easier and more straightforward calculation than FCFF.
ᅚ C) Overhaul's debt ratio is significantly higher than the industry average.
Explanation
The difference between FCFF and FCFE is related to capital structure and resulting interest expense. When the company's
capital structure is relatively stable, FCFE is easier and more straightforward to use. FCFF is generally the best choice when
FCFE is negative or the firm is highly leveraged. The fact that Overhaul's debt ratio is significantly higher than the industry
average would argue against the use of FCFE. Hence, this is the least likely reason to favor FCFE. (Study Session 10, LOS
30.a)
Question #29 of 145
Question ID: 463302
Assuming that Carson is using May 1, 2005 as his date of valuation, what is the estimated value of the firm's equity under the
scenario most suited to using the two-stage FCFE method?
ᅞ A) $129.5 million.
ᅞ B) $173.3 million.
ᅚ C) $125.2 million.
Explanation
The "sustained-growth" scenario is the only scenario suitable for using the two-stage method, in part because the "highgrowth" scenario uses three different required rates of return.
First, we need to calculate estimated FCFE in 2006. Since there were no sales of PPE, we can calculate FCInv as the change
in Gross PPE.
FCFE = NI + NCC − FCInv − WCInv + Net Borrowing
= 16.9 + 80 − (480 − 400) − [(55 − 70) − (50 − 50)] + (113.1 − 140)
= 16.9 + 80 − 80 + 15 − 26.9
= $5 million in 2006
Having calculated FCFE in 2006, we can calculate FCFE for 2007 through 2011 using the growth rates provided:
2007
Growth in FCFE
2008
2009 2010
2011
40.0% 15.7% 8.6% 9.1%
8.3%
Implied level of
FCFE
$7.0
$8.1
$8.8
$9.6
$10.4
(in millions)
Now that we know FCFE, we can discount future FCFE back to the present at the cost of equity.
In the first stage of the two-stage model, we determine the terminal value at the start of the constant growth period as follows:
Terminal Value = (10.4 × 1.06)/(0.12 − 0.06) = $183.733 million.
In the second stage, we discount FCFE for the first six years and the terminal value to the present.
Equity Value = [5.0 / (1.12)1] + [7.0 / (1.12)2] + [8.1 / (1.12)3] + [8.8 / (1.12)4] + [9.6 / (1.12)5] + [(10.4 + 183.7333) / (1.12)6]
Equity Value = 4.46 + 5.58 + 5.77 + 5.59 + 5.45 + 98.35
Equity Value = $125.20 million
(Study Session 12, LOS 36.j)
Question #30 of 145
Question ID: 463303
What is the expected growth rate in FCFF that Carson must have used to generate his valuation of $1.08 billion?
ᅞ A) 5%.
ᅚ B) 7%.
ᅞ C) 12%.
Explanation
Since Firm Value = FCFF 1 / (WACC − g), we first need to determine FCFF 1, which is FCFF in 2006: FCFF = NI + NCC + [Int ×
(1 − tax rate)] - FCInv − WCInv
= 16.9 + 80 + [34 × (1 − 0.35)] − (480 − 400) − [(55 − 70) − (50 − 50)]
= 16.9 + 80 + 22.1 − 80 − (−15) = 54
Firm Value = FCFF 1 / (WACC − g)
1080 = 54 / (0.12 − x)
[(1080)(0.12)] − 1080x = 54
129.6 − 1080x = 54
75.6 = 1080x
0.07 = x
The expected growth rate in FCFF that Carson must have used is 7%. (Study Session 12, LOS 36.j)
Question #31 of 145
Question ID: 463304
If Carson had estimated FCFE under the assumption that Overhaul Trucking maintains a target debt-to-asset ratio of 36
percent for new investments in fixed and working capital, what would be his forecast of 2006 FCFE?
ᅞ A) $9.6 million.
ᅚ B) $26.5 million.
ᅞ C) $16.9 million.
Explanation
FCFE = NI - [(1 − DR) × (FCInv − Dep)] − [(1 − DR) × WCInv]
Where: DR = target debt to asset ratio
FCFE = 16.9 − [(1 − 0.36) × (480 − 400 − 80)] − [(1 − 0.36) × ((55 − 70) − (50 − 50))]
= 16.9 − (0.64 × 0) − (0.64 × (−15))
= 16.9 + 0 + 9.6 = 26.5
(Study Session 12, LOS 36.j)
Question #32 of 145
Question ID: 463305
Regarding the statements made by Carson and Eckhardt about the value of Overhaul in the high-growth scenario:
ᅚ A) both are correct.
ᅞ B) only one is correct.
ᅞ C) both are incorrect.
Explanation
This is a complex problem. It would help to create a table:
2006
2007
(year 1) (year 2)
Growth in FCFE (given)
Forecast FCFE (calculated)
Required return to equity
(given)
Total discount factor
(calculated)
PV of FCFE
2008
2009
(year 3) (year 4)
2010
(year 5)
2011
(year 6)
2012
(year 7)
n/a
5.0
30%
6.50
30%
8.45
30%
10.99
21%
13.29
12%
14.89
3%
15.33
20%
20%
20%
20%
15%
15%
15%
1.20
(1.20)2
(1.20)3
(1.20)4
(1.20)4(1.15)
(1.20)4(1.15)2
(1.20)4(1.15)3
4.17
4.51
4.89
5.30
5.57
5.43
4.86
We begin with the forecast growth rates in FCFE in line 1. Since we have previously calculated that FCFE is $5 million in 2006,
we can use the growth rates from line 1 to forecast FCFE in each year on line 2.
Line 3, required return to equity, is given. Using that, we can calculate discount factors in line 4.
Notice that the total discount factor is simply each year's factor multiplied together. For example, the total discount factor for
year 4 is (1.20)4 so the total discount factor for year 5, when the year 5 required rate of return drops from 20% to 15%,
becomes (1.20)4(1.15).
Using the total discount factors from line 4, we can calculate the present value of each year's cash flow in line 5. For example,
the present value of year 2010 FCFE of $13.29 million will be $13.29 / [(1.20)4(1.15)] or $5.57 million.
Once we have the discounted cash flows for each year, we need to calculate the terminal value. Terminal value will be:
TV = (15.33)(1.03) / (0.10 − 0.03)
TV = 15.7899 / 0.07
TV = $225.57 million
Note that the required rate of return used for the terminal value is the rate for the steady-growth period, which is lower than
that used in the high-growth phase (stage) or the declining growth phase (stage two).
We now need to discount terminal value back using the total discount factor for 2012:
PV of terminal value = $225.57 million / [(1.20)4(1.15)3]
PV of terminal value = $71.53 million
Adding together the discounted cash flows for each year with the discounted terminal value, we have:
Equity value = 4.17 + 4.51 + 4.89 + 5.30 + 5.57 + 5.43 + 4.86 + 71.53 = $106.26 million
Since the equity value of the firm is $106.26 million, Burcar should be willing to pay up to $106.26 × 0.15 = $15.94 million for a
15% stake in the firm. Since this is slightly less than $16 million, Carson's statement is correct. The terminal value represents
($71.53 / $106.26) = 67.3% of the firm's present value, so Eckhardt's statement is also correct. (Study Session 12, LOS 36.j)
Question #33 of 145
Question ID: 463190
In computing free cash flow, the most significant non-cash expense is usually:
ᅚ A) depreciation.
ᅞ B) capital expenditures.
ᅞ C) deferred taxes.
Explanation
Depreciation is usually the largest non-cash expense.
Question #34 of 145
A firm has:
Free cash flow to the firm = $4.0 million.
Weighted average cost of capital = 10%.
Total debt = $30.0 million.
Long-term expected growth rate = 5%.
Value of the firm = $50.00 per share.
What will happen to the value of the firm if the weighted average cost of capital increases to 12%?
ᅞ A) The value will remain the same.
ᅞ B) The value will increase.
Question ID: 463307
ᅚ C) The value will decrease.
Explanation
Everything else being constant, an increase in the relevant required rate of return should decrease the value of the firm.
Question #35 of 145
Question ID: 463310
In five years, a firm is expected to be operating in a stage of its life cycle wherein its expected growth rate is 5%, indefinitely; its required
rate of return on equity is 11%; its weighted average cost of capital is 9%; and the free cash flow to equity in year 6 will be $5.25 per
share. What is its projected terminal value at the end of year 5?
ᅞ A) $131.25.
ᅞ B) $51.93.
ᅚ C) $87.50.
Explanation
Terminal value = FCFE / (k − g) = $5.25 / (0.11 − 0.05) = $87.50
Question #36 of 145
Question ID: 463202
In forecasting free cash flows it is common to assume that investment in working capital:
ᅞ A) is greater than fixed capital investment during a growth phase.
ᅚ B) will be financed using the target debt ratio.
ᅞ C) will equal fixed capital investment.
Explanation
It is usually assumed that the investment in working capital will be financed consistent with the target debt ratio.
Question #37 of 145
Question ID: 463311
Terminal value in multi-stage free cash flow valuation models is often calculated as the present value of:
ᅞ A) a two-stage valuation model's price.
ᅞ B) free cash flow divided by the growth rate.
ᅚ C) a constant growth model's price as of the beginning of the last stage.
Explanation
Terminal values are usually calculated as the present value of the price produced by a constant-growth model as of the beginning of the
last stage.
Questions #38-43 of 145
The following information was collected from the financial statements of Bankers Industrial Corp (BIC) for the year ended December 31,
2013.
Earnings before interest and taxes (EBIT) = $6.00 million.
Capital expenditures = $1.25 million.
Depreciation expense = $0.63 million.
Working capital additions = $0.59 million.
Cost of debt = 10.50%.
Cost of equity = 16.00%.
Stable growth rate for FCFF = 7.00%.
Stable growth rate for FCFE = 10.00%.
Market value of debt = $20.00 million.
Book value of debt = $22.50 million.
Outstanding shares = 500,000.
Interest expense = $2.00 million.
New Debt borrowing = $3.30 million.
Debt repayment = $2.85 million.
Growth rates for two-stage growth model for FCFE:
25.0% for Years 1-3.
6.0% for Years 4 and thereafter.
BIC is currently operating at their target debt ratio of 40.00%. The firm's tax rate is 40.00%.
Question #38 of 145
Question ID: 463260
The free cash flow to the firm (FCFF) for the current year is closest to:
ᅞ A) $3.57 million.
ᅚ B) $2.39 million.
ᅞ C) $2.31 million.
Explanation
The FCFF for the current year is [$6.00m × (1 − 0.40)] + $0.63m − $1.25m − $0.59m = $2.39m.
(LOS 36.d)
Question #39 of 145
The appropriate discount rate to apply in valuing BIC using FCFF is closest to:
Question ID: 463261
ᅚ A) 12.1%.
ᅞ B) 16.0%.
ᅞ C) 13.8%.
Explanation
The appropriate discount rate to use is the weighted average cost of capital (WACC), and this is WACC = (0.60 × 0.16) + [0.40 × 0.105 ×
(1 − 0.40)] = 12.12%.
(LOS 36.j)
Question #40 of 145
Question ID: 463262
The estimated value of the firm is closest to:
ᅞ A) $38 million.
ᅞ B) $47 million.
ᅚ C) $50 million.
Explanation
The value of BIC using a stable-growth FCFF model is $49.95 million, calculated as:
FCFF = [$6.00m × (1 − 0.40)] + $0.63m − $1.25m − $0.59m. = $2.39m
WACC = (0.60 × 0.16) + [0.40 × 0.105 × (1 × 0.40)] = 12.12%.
Estimated value = ($2.39m × 1.07) / (0.1212 − 0.07)= $49.95 million.
(LOS 36.j)
Question #41 of 145
Question ID: 463263
If the estimated value of the firm is $50.0 million, the value per share of BIC stock should be closest to:
ᅚ A) $60.
ᅞ B) $28.
ᅞ C) $30.
Explanation
Equity value = Firm value - market value of debt; $50 million - $20 million = $30 million:
$30,000,000/500,000 = $60.00 per share.
(LOS 36.j)
Question #42 of 145
Question ID: 463264
If the estimated value of the free cash to the firm (FCFF) for year 0 is $2.4 million, the value per share of BIC stock, based on
the stable growth model, is closest to:
ᅚ A) $61
ᅞ B) $55
ᅞ C) $39
Explanation
FCFE = FCFF - Interest expense × (1 − tax rate) + Net borrowing = $2.40 million - [$2.00 million × (1 − 0.40)] + $3.30 million −
$2.85 million = $1.65 million.
The value of equity is: [$1.65 million × (1+0.10) ] /(0.16 − 0.10) = $30.25 million.
On a per share basis: $30.25 million/500,000 = $60.50
(LOS 36.j)
Question #43 of 145
Question ID: 463265
The current market price of BIC is $62.50 per share, and the current year's FCFE is $1.75 million. Using a two-stage growth
model to find the estimated the firm's value, the current market price BIC is most accurately described as:
ᅚ A) overvalued.
ᅞ B) fairly valued.
ᅞ C) undervalued.
Explanation
FCFE = FCFF − Interest expense × (1 − T) + New borrowing.
Year
Growth rate
FCFE in
mil$
0
1
2
3
4
25.0% 25.0% 25.0% 6.0%
$1.750 $2.188 $2.734 $3.418 $3.623
The terminal value is $3,623/(0.16 - 0.06) = $36,230 million. The calculator inputs: CF0 = 0, CF1 = $2,188, CF2 = $2,734, CF3
= $3,418 + $36,230 = $39,648, I = 16, NPV = $29.319 million.
Per share price is $29,319,000/500,000 = $58.64. The stock appears to be overvalued at the current market price of $62.50
per share, as our estimated value of $58.64 suggests that the market price is too high.
(LOS 36.m)
Question #44 of 145
The difference between free cash flow to equity (FCFE) and free cash flow to the firm (FCFF) is:
ᅞ A) before-tax interest and net borrowing.
ᅞ B) earnings before interest and taxes (EBIT) less taxes.
ᅚ C) after-tax interest and net borrowing.
Explanation
Question ID: 463174
FCFE = FCFF - [interest expense] (1 - tax rate) + net borrowing.
Question #45 of 145
Question ID: 463222
The repurchase of 20% of a firm's outstanding common shares will cause free cash flow to the firm (FCFF) to:
ᅞ A) decrease.
ᅚ B) remain the same.
ᅞ C) increase.
Explanation
Share repurchases are a use of free cash flows, not a source. FCFF is cash flow that is available to all capital suppliers. Notice the
conspicuous absence of repurchases in the following: FCFF = CFO + Int (1 - tax rate) - FCInv.
Question #46 of 145
Question ID: 463230
Which of the following free cash flow to the firm (FCFF) models is most suited to analyze firms that are growing at a faster rate than the
overall economy?
ᅞ A) High growth FCFF model.
ᅞ B) No growth FCFF model.
ᅚ C) Two-stage FCFF model.
Explanation
The two-stage FCFF model is most suited for analyzing firms growing at a rate faster than the overall economy. The two-stage model
assumes a high rate of growth for an initial period, followed by an immediate jump to a constant, stable growth rate.
Question #47 of 145
Question ID: 463258
The value of stock under the two-stage FCFE model will be equal to:
ᅞ A) present value (PV) of FCFE during the extraordinary growth and transitional
periods plus the PV of terminal value.
ᅞ B) present value (PV) of FCFE during the extraordinary growth period plus the terminal
value.
ᅚ C) present value (PV) of FCFE during the extraordinary growth period plus the PV of
terminal value.
Explanation
The value of stock under the two-stage FCFE model will be equal to the present value of FCFE during the extraordinary
growth period plus the present value of the terminal value at the end of this period.
Question #48 of 145
Question ID: 463308
A firm has:
Free cash flow to equity = $4.0 million.
Cost of equity = 12%.
Long-term expected growth rate = 5%.
Value of equity per share = $57.14 per share.
What will happen to the value of the firm if free cash flow to equity decreases to $3.2 million?
ᅞ A) There is insufficient information to tell.
ᅚ B) The value will decrease.
ᅞ C) The value will increase.
Explanation
Everything else being constant, a decrease in free cash flow to equity should decrease the value of the firm.
Question #49 of 145
Question ID: 463236
Which of the following free cash flow to equity (FCFE) models is most suited to analyze firms in an industry with significant barriers to
entry?
ᅞ A) Stable Growth FCFE Model.
ᅚ B) Two-stage FCFE Model.
ᅞ C) FCFE Perpetuity Model.
Explanation
The two-stage FCFE model is most suited for analyzing firms in high growth that will maintain that growth for a specific period, such as
firms with patents or firms in an industry with significant barriers to entry.
Question #50 of 145
Question ID: 463193
Which of the following items is NOT subtracted from the net income to calculate free cash flow to equity (FCFE)?
ᅞ A) increase in accounts receivable.
ᅚ B) Interest payments to bondholders.
ᅞ C) Increase in fixed assets.
Explanation
Interest payments to bondholders are included in the income statement and are already subtracted to calculate net income.
Question #51 of 145
Question ID: 463200
On a per share basis for a firm:
Sales are $10.00.
Earnings per share (EPS) is $4.00.
Depreciation is $3.00.
After-tax interest is $2.40.
Investment in working capital is $1.50.
Investment in fixed capital is $2.00.
What is the firm's expected free cash flow to the firm (FCFF) per share?
ᅚ A) $5.90.
ᅞ B) $7.50.
ᅞ C) $2.90.
Explanation
FCFF = EPS + net non-cash charges + after-tax interest − FCInv − WCInv
FCFF= $4.00 + 3.00 +$2.40 − $2.00 −1.50 = $5.90
Question #52 of 145
Question ID: 463277
A firm's free cash flow to equity (FCFE) in the most recent year is $50M and is expected to grow at 5% per year forever. If its
shareholders require a return of 12%, the value of the firm's equity using the single-stage FCFE model is:
ᅞ A) $714M.
ᅞ B) $417M.
ᅚ C) $750M.
Explanation
The value of the firm's equity is: $50M × 1.05 / (0.12 − 0.05) = $750M
Question #53 of 145
Question ID: 463309
In the two-stage FCFE model, the required rate of return for calculating terminal value should be:
ᅚ A) lower than the required rate of return used for the high-growth phase.
ᅞ B) higher than the required rate of return used for the high-growth phase.
ᅞ C) equal to the average required rate of return for the industry.
Explanation
In most cases, the required rate of return used to calculate the terminal value should be lower than the required rate of return
used for initial high-growth phase. During the stable period the firm is less risky and the required rate of return is therefore
lower.
Questions #54-59 of 145
Beachwood Builders merged with Country Point Homes in December 31, 1992. Both companies were builders of mid-scale
and luxury homes in their respective markets. In 2004, because of tax considerations and the need to segment the businesses
between mid-scale and luxury homes, Beachwood decided to spin-off Country Point, its luxury home subsidiary, to its common
shareholders. Beachwood retained Bernheim Securities to value the spin-off of Country Point as of December 31, 2004.
When the books closed on 2004, Beachwood had $140 million in debt outstanding due in 2012 at a coupon rate of 8%, a
spread of 2% above the current risk free rate. Beachwood also had 5 million common shares outstanding. It pays no
dividends, has no preferred shareholders, and faces a tax rate of 30%. When valuing common stock, Bernhiem's valuation
models utilize a market risk premium of 11%.
The common equity allocated to Country Point for the spin-off was $55.6 million as of December 31, 2004. There was no longterm debt allocated from Beachwood.
The Managing Director in charge of Bernheim's construction group, Denzel Johnson, is prepping for the valuation presentation
for Beachwood's board with Cara Nguyen, one of the firm's associates. Nguyen tells Johnson that Bernheim estimated
Country Point's net income at $10 million in 2004, growing $5 million per year through 2008. Based on Nguyen's calculations,
Country Point will be worth $223.7 million in 2008. Nguyen decided to use a cost of equity for Country Point in the valuation
equal to its return on equity at the end of 2004 (rounded to the nearest percentage point).
Nguyen also gives Johnson the table she obtained from Beachwood projecting depreciation (the only non-cash charge) and
capital expenditures:
$(in millions)
2004 2005 2006 2007 2008
Depreciation
5
6
5
6
5
Capital Expenditures
7
8
9
10
12
Looking at the numbers, Johnson tells Nguyen, "Country Point's free cash flow (FCF) will be $25 million in 2006." Nguyen
adds, "That's FCF to the Firm (FCFF). FCF to Equity (FCFE) will be lower."
Question #54 of 145
Question ID: 463286
Regarding the statements by Johnson and Nguyen about FCF in 2006:
ᅞ A) only Nguyen is incorrect.
ᅚ B) both are incorrect.
ᅞ C) only Johnson is incorrect.
Explanation
To estimate FCF, we can construct the following table using the table given and the information about growth in net income:
$(in millions)
2004 2005 2006 2007 2008
Net Income
10
15
20
25
30
Plus: Depreciation
5
6
5
6
5
Less: Capital Expenditures
7
8
9
10
12