CFA 2018 smart summary, study session 03, reading 11 1
Bạn đang xem bản rút gọn của tài liệu. Xem và tải ngay bản đầy đủ của tài liệu tại đây (91.26 KB, 3 trang )
2017, Study Session # 3, Reading # 11
SE = Standard Error
= Rises
RV = Random Variable
CI = Class Interval
= Approaches to
df = Degrees Of Freedom
n = Sample Size
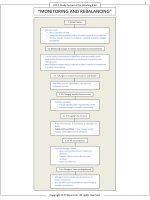
“SAMPLING & ESTIMATION”
Sample
Sampling error
Methods of Sampling
Sample – Corresponding
Statistic Population
Parameter.
A subgroup of
population.
Sample Statistic
It describes the
characteristic of
a sample.
Sample statistic
itself is a random
variable.
Simple Random
Sampling
Stratified Random
Sampling
Each item of the
population under
study has equal
probability of
being selected.
There is no
guarantee of
selection of
items from a
particular
category.
Uses a classification
system.
Separates the
population into strata
(small groups) based
on one or more
distinguishing
characteristics.
Take random sample
from each stratum.
It guarantees the
selection of items
from a particular
category.
Systematic
Sampling
th
Select every k
number.
Resulting sample
should be
approximately
random
Sampling Distribution
Probability distribution of all
possible sample statistics
computed from a set of
equal size samples
randomly drawn.
Standard Error (SE) of
Sample Mean
Standard deviation of
the distribution of
sample means.
σx =
σ
n
If σ is not known then;
Date
Time
Time series
Observations take
over equally spaced
time interval
Crosssectional
Data
Observational
Units
Characteristics
Longitudinal
Same
Multiple
Panel
Multiple
Same
sx =
s
n
As n ;
µ and
S.E .
x approaches
Single point estimate
Student’s T-Distribution
Bell shaped.
Shape is defined by df
df is based on ‘sample size’.
Symmetrical about it’s mean.
Less peaked than normal distribution.
Has fatter tails.
More probability in tails i.e., more observations are
away from the center of the distribution & more
outliers.
Copyright © FinQuiz.com. All rights reserved.
2017, Study Session # 3, Reading # 11
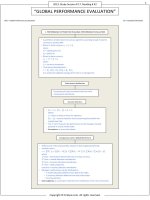
Central Limit Theorem (CLT)
Point Estimate (PE)
For a random sample of size ‘n’ with;
population mean µ,
finite variance (population
variance divided by sample size)
2
σ , the sampling distribution of
Single (sample) value
used to estimate
population parameter.
Σܺ
ഥ=
ܺ
݊
sample mean x approaches a
normal probability distribution
with mean ‘µ’ & variance as ‘n’
becomes large.
Confidence Interval (CI)
Estimates
Results in a range of values within
which actual parameter value will
fall.
PE ±(reliability factor × SE).
α= level of significance.
1- α= degree of confidence.
Estimator: Formula used
to compute PE.
Desirable properties of
an estimator
Properties of CLT
For n ≥ 30 ⇒ sampling distribution
of mean is approx. normal.
Mean of distribution of all possible
samples = population mean ‘µ’.
Unbiased
Expected value of
estimator equals
parameter e.g.,
E( = )ݔµ i.e,
sampling error is
zero.
Efficient
If var (ݔଵ ) < var (ݔଶ )
of the same
parameter then ݔ1 is
efficient
than ݔ2
CLT applies only when
sample is random.
Copyright © FinQuiz.com. All rights reserved.
Consistent
As n , value of
estimator
approaches
parameter &
sample error
approaches ‘0’
e.g., As n ∝
ݔµ &
SE 0
2017, Study Session # 3, Reading # 11
Distribution
Non
Normal
normal
Variance
Known
Unknown
Sample
Small
Large
(n<30)
(n≥30)
Test Statistic
t
Issues Regarding Selection
of Appropriate Sample Size
z
As n ; s.e. & hence C.I
becomes narrower.
Limitations of Large
Sample Size
*
*
*The z-statistic is theoretically acceptable here, but use of the t-statistic is more
conservative.
Large sample may
include
observations from
more than one
population.
Cost may
increase more
relative to an
increase in
precision.
Biases
Data Mining Bias
Sample Selection Bias
Statistical significance of
the pattern is
overestimated because
the results were found
through data mining.
Data Mining
Systematically excluding
some data from analysis.
It makes the sample
non-random.
Look –ahead Bias
Time-period Bias
Using sample data that
was not available on the
test date.
Time period over
which the data is
gathered is either
too short or too long.
Survivorship Bias
Using the same data to
find patterns until the one
that ‘works’ is discovered.
Most common form of
sample selection bias.
Excluding weak
performances.
Surviving sample is not
random.
Warning Signs of
Data Mining
Evidence of testing
many different, mostly
unreported variables.
Lack of economic
theory consistent
with empirical
results.
Copyright © FinQuiz.com. All rights reserved.