Cloud based demand driven supply chain business 9 pdf
Bạn đang xem bản rút gọn của tài liệu. Xem và tải ngay bản đầy đủ của tài liệu tại đây (8.83 MB, 318 trang )
The Cloud-Based
Demand-Driven
Supply Chain
Wiley & SAS Business
Series
The Wiley & SAS Business Series presents books that help senior-level
managers with their critical management decisions.
Titles in the Wiley & SAS Business Series include:
The Analytic Hospitality Executive by Kelly A. McGuire
Analytics: The Agile Way by Phil Simon
Analytics in a Big Data World: The Essential Guide to Data Science and Its
Applications by Bart Baesens
A Practical Guide to Analytics for Governments: Using Big Data for Good
by Marie Lowman
Bank Fraud: Using Technology to Combat Losses by Revathi
Subramanian
Big Data Analytics: Turning Big Data into Big Money by Frank Ohlhorst
Big Data, Big Innovation: Enabling Competitive Differentiation through
Business Analytics by Evan Stubbs
Business Analytics for Customer Intelligence by Gert Laursen
Business Intelligence Applied: Implementing an Effective Information and
Communications Technology Infrastructure by Michael Gendron
Business Intelligence and the Cloud: Strategic Implementation Guide by
Michael S. Gendron
Business Transformation: A Roadmap for Maximizing Organizational
Insights by Aiman Zeid
Connecting Organizational Silos: Taking Knowledge Flow Management to
the Next Level with Social Media by Frank Leistner
Data-Driven Healthcare: How Analytics and BI Are Transforming the
Industry by Laura Madsen
Delivering Business Analytics: Practical Guidelines for Best Practice by
Evan Stubbs
ii
Demand-Driven Forecasting: A Structured Approach to Forecasting, Second
Edition by Charles Chase
Demand-Driven Inventory Optimization and Replenishment: Creating a
More Efficient Supply Chain by Robert A. Davis
Developing Human Capital: Using Analytics to Plan and Optimize Your
Learning and Development Investments by Gene Pease, Barbara Beresford, and Lew Walker
Economic and Business Forecasting: Analyzing and Interpreting Econometric Results by John Silvia, Azhar Iqbal, Kaylyn Swankoski, Sarah
Watt, and Sam Bullard
Economic Modeling in the Post Great Recession Era: Incomplete Data,
Imperfect Markets by John Silvia, Azhar Iqbal, and Sarah Watt
House
Enhance Oil & Gas Exploration with Data Driven Geophysical and
Petrophysical Models by Keith Holdaway and Duncan Irving
The Executive’s Guide to Enterprise Social Media Strategy: How Social
Networks Are Radically Transforming Your Business by David Thomas
and Mike Barlow
Foreign Currency Financial Reporting from Euros to Yen to Yuan: A Guide
to Fundamental Concepts and Practical Applications by Robert Rowan
Harness Oil and Gas Big Data with Analytics: Optimize Exploration and
Production with Data Driven Models by Keith Holdaway
Health Analytics: Gaining the Insights to Transform Health Care by Jason
Burke
Heuristics in Analytics: A Practical Perspective of What Influences Our
Analytical World by Carlos Andre Reis Pinheiro and Fiona McNeill
Human Capital Analytics: How to Harness the Potential of Your Organization’s Greatest Asset by Gene Pease, Boyce Byerly, and Jac Fitz-enz
Implement, Improve and Expand Your Statewide Longitudinal Data
System: Creating a Culture of Data in Education by Jamie McQuiggan
and Armistead Sapp
Intelligent Credit Scoring: Building and Implementing Better Credit Risk
Scorecards, Second Edition by Naeem Siddiqi
JMP Connections by John Wubbel
Killer Analytics: Top 20 Metrics Missing from Your Balance Sheet by Mark
Brown
Machine Learning for Marketers: Hold the Math by Jim Sterne
On-Camera Coach: Tools and Techniques for Business Professionals in a
Video-Driven World by Karin Reed
Predictive Analytics for Human Resources by Jac Fitz-enz and John
Mattox II
Predictive Business Analytics: Forward-Looking Capabilities to Improve
Business Performance by Lawrence Maisel and Gary Cokins
Profit Driven Business Analytics: A Practitioner’s Guide to Transforming
Big Data into Added Value by Wouter Verbeke, Cristian Bravo, and
Bart Baesens
Retail Analytics: The Secret Weapon by Emmett Cox
Social Network Analysis in Telecommunications by Carlos Andre Reis
Pinheiro
Statistical Thinking: Improving Business Performance, Second Edition by
Roger W. Hoerl and Ronald D. Snee
Strategies in Biomedical Data Science: Driving Force for Innovation by Jay
Etchings
Style & Statistic: The Art of Retail Analytics by Brittany Bullard
Taming the Big Data Tidal Wave: Finding Opportunities in Huge Data
Streams with Advanced Analytics by Bill Franks
Too Big to Ignore: The Business Case for Big Data by Phil Simon
Using Big Data Analytics: Turning Big Data into Big Money by
Jared Dean
The Value of Business Analytics: Identifying the Path to Profitability by
Evan Stubbs
The Visual Organization: Data Visualization, Big Data, and the Quest for
Better Decisions by Phil Simon
Win with Advanced Business Analytics: Creating Business Value from Your
Data by Jean Paul Isson and Jesse Harriott
For more information on any of the above titles, please visit
www.wiley.com.
The Cloud-Based
Demand-Driven
Supply Chain
Vinit Sharma
Copyright © 2019 by John Wiley & Sons, Inc. All rights reserved.
Published by John Wiley & Sons, Inc., Hoboken, New Jersey.
Published simultaneously in Canada.
No part of this publication may be reproduced, stored in a retrieval system, or
transmitted in any form or by any means, electronic, mechanical, photocopying,
recording, scanning, or otherwise, except as permitted under Section 107 or 108 of the
1976 United States Copyright Act, without either the prior written permission of the
Publisher, or authorization through payment of the appropriate per-copy fee to the
Copyright Clearance Center, Inc., 222 Rosewood Drive, Danvers, MA 01923, (978)
750-8400, fax (978) 646-8600, or on the Web at www.copyright.com. Requests to the
Publisher for permission should be addressed to the Permissions Department, John
Wiley & Sons, Inc., 111 River Street, Hoboken, NJ 07030, (201) 748-6011, fax (201)
748-6008, or online at www.wiley.com/go/permissions.
Limit of Liability/Disclaimer of Warranty: While the publisher and author have used
their best efforts in preparing this book, they make no representations or warranties
with respect to the accuracy or completeness of the contents of this book and
specifically disclaim any implied warranties of merchantability or fitness for a particular
purpose. No warranty may be created or extended by sales representatives or written
sales materials. The advice and strategies contained herein may not be suitable for your
situation. You should consult with a professional where appropriate. Neither the
publisher nor author shall be liable for any loss of profit or any other commercial
damages, including but not limited to special, incidental, consequential, or other
damages.
For general information on our other products and services or for technical support,
please contact our Customer Care Department within the United States at (800)
762-2974, outside the United States at (317) 572-3993, or fax (317) 572-4002.
Wiley publishes in a variety of print and electronic formats and by print-on-demand.
Some material included with standard print versions of this book may not be included
in e-books or in print-on-demand. If this book refers to media such as a CD or DVD
that is not included in the version you purchased, you may download this material at
. For more information about Wiley products, visit
www.wiley.com.
Library of Congress Cataloging-in-Publication Data:
Names: Sharma, Vinit, 1974- author.
Title: The cloud-based demand-driven supply chain / Vinit Sharma.
Description: Hoboken, New Jersey : John Wiley & Sons, 2019. | Series: Wiley &
SAS business series | Includes index. |
Identifiers: LCCN 2018029740 (print) | LCCN 2018041782 (ebook) | ISBN
9781119477808 (Adobe PDF) | ISBN 9781119477815 (ePub) | ISBN 9781119477334
(hardcover)
Subjects: LCSH: Business logistics. | Supply and demand—Management. | Cloud
computing—Industrial applications.
Classification: LCC HD38.5 (ebook) | LCC HD38.5 .S544 2019 (print) | DDC
658.70285/46782—dc23
LC record available at />Cover Design: Wiley
Cover Image: © Fly_Studio/Shutterstock
Printed in the United States of America
10 9 8 7 6 5 4 3 2 1
To my parents and grandparents
for their lifelong love and support
Contents
List of Figures xi
List of Tables xv
Preface xvii
Acknowledgments xix
Chapter 1
Demand-Driven Forecasting in the Supply Chain
Chapter 2
Introduction to Cloud Computing 43
Chapter 3
Migrating to the Cloud
Chapter 4
Amazon Web Services and Microsoft Azure
Chapter 5
Case Studies of Demand-Driven Forecasting
in AWS 221
Chapter 6
Summary 237
Glossary 253
References 255
About the Author 291
Index 293
ix
91
117
1
List of Figures
Figure 1
Figure 2
Figure 3
Push and Pull—Sales and Operations Process
Digital Supply Chain—Interconnected
Supply Chain Control Tower
Figure 4
Figure 5
MHI 2018 Survey Results: Company Challenges
Example: Product Dimension Hierarchy
8
10
Figure 6
Figure 7
Example: Star Schema - Forecast Dimensions
Traditional Data Flow—Supply Chain Analytics
12
12
Figure 8
Figure 9
Data Lake - Data for Demand Forecasting
High-level Lambda Architecture Design
17
18
Figure 10 Hybrid Modern Data Flow—Supply Chain Analytics
Figure 11 DDPP Model—Types and Maturity of Analytics
Figure 12 Microsoft AI Example—High Level
20
22
24
Figure 13 Microsoft AI Services Example
Figure 14 Demand-Driven Forecasting and IoT
25
28
Figure 15 Demand Shaping—Personalized Recommendations
Figure 16 DDSC Benefits All Participants—BCG, 2012
29
30
Figure 17 Databerg and Dark Data
Figure 18 Random Walk Forecast Example
Figure 19 Sales and Seasonal Random Walk Forecast Example
32
34
35
Figure 20 SAS Demand-Driven Planning and Optimization
Example
Figure 21 Combining Cloud + Data + Advanced Analytics
37
39
Figure 22 Benefits of Demand-Driven Supply Chain
Figure 23 Time Line for Cloud Computing—Part 1
Figure 24 Time Line for Cloud Computing—Part 2
40
45
46
Figure 25 Traditional Server and Server Virtualization
Figure 26 Data Center Virtualization—Transformation
48
49
Figure 27 Virtual Machines Compared to Containers
Figure 28 Data Stored in Data Centers, 2016–2021, Cisco GCI
50
53
xi
4
5
7
xii
LIST OF FIGURES
Figure 29 IT Systems to Benefit from Big Data
54
Figure 30 Big Data—Open Source Ecosystem
55
Figure 31 Cloud Computing—Five Characteristics
62
Figure 32 Black Friday—Traditional and Cloud
66
Figure 33 Cloud Price Index—451 Research Group
70
Figure 34 The Three Cloud Service Models
71
Figure 35 AWS Shared Responsibility Model
72
Figure 36 Microsoft Azure Portal Screenshot—IaaS Example
73
Figure 37 Microsoft Azure Portal Screenshot—PaaS
74
Figure 38 Cloud Service Model Growth 2016–2021
75
Figure 39 Enterprise SaaS Growth and Market Leaders,
Q2 2017
76
Figure 40 Four Cloud Deployment Models
77
Figure 41 Cisco Global Cloud Index 2016–2021
78
Figure 42 Public versus Private Cloud
80
Figure 43 Cisco Global Cloud Index—Private versus Public
Cloud
80
Figure 44 Top IaaS Platforms—Public Cloud
81
Figure 45 Importance of Cloud Benefits
82
Figure 46 Cloud Benefits 2017 versus 2016
83
Figure 47 Cloud Challenges 2017 versus 2016
85
Figure 48 Challenges Decrease with Cloud Maturity
87
Figure 49 IT Benefits of Cloud Computing
87
Figure 50 Costs and Benefits to Cloud Users
89
Figure 51 Five Steps to the Cloud
93
Figure 52 Factors Preventing Enterprises’ Use of Cloud
95
Figure 53 Economic impact of Cloud Computing in Europe
95
Figure 54 ISG Cloud Readiness Results Example
98
Figure 55 Example R Framework Migrating to Cloud
100
Figure 56 AWS Cloud Migration—6Rs
102
Figure 57 Considerations for Cloud Migration Examples
106
Figure 58 Cloud Migration Factory Approach
108
Figure 59 Cloud Vendor Benchmark 2016—Germany
112
Figure 60 The Race for Public Cloud Leadership
112
LIST OF FIGURES
xiii
Figure 61 Cloud Migration Factory Methodology
Figure 62 AWS Cloud Portfolio Categories
114
119
Figure 63 AWS EC2 On-Demand Pricing Examples
Figure 64 AWS Global Regions for Public Cloud
121
125
Figure 65 Industrial Internet Economic Potential
Figure 66 AWS Cloud Service Portfolio
156
159
Figure 67 Microsoft Azure Cloud Portfolio Categories
Figure 68 Column Family Data Model Example
Figure 69 Data Flow Example
161
189
195
Figure 70 Industrial Internet Data Loop
Figure 71 Microsoft Demand Forecasting Example
204
217
Figure 72 Example Methodology—Solution Assessment for
Cloud
226
Figure 73 Supply Chain Optimization Solution Suite
Figure 74 Case Study—Deployment Example
232
233
Figure 75 Connected Supply Chain Management
Figure 76 Demand-Driven Supply Chain—Integration and
Technologies
Figure 77 Modern Supply Chain and Technologies
243
245
250
Figure 78 Road to Modern Supply Chain Management
251
List of Tables
Table 1
Table 2
Table 3
Table 4
Table 5
Table 6
AWS Cost Calculation Example
Percentage of Companies Adopting at Least One
Cloud Solution by Industry Sector 2013–2015
Revenue Growth Attributed to Cloud Adoption
69
85
88
Cloud Readiness Check Example (ISG)
AWS Cloud Adoption Framework
Respondents’ Views on Which Cloud Services Gave
the Best Economic Return
97
103
Table 7
Table 8
Preferred Choice of Cloud Services Provider
Main Choice Factor for Cloud Service Provider
110
111
Table 9
Market Comparison of Top 25 to 100 Vendors
by Origin
111
Table 10 Estimated EU Market Shares of Top 25 Public
Cloud Service Providers
113
Table 11 Key-Value Data Store Example
Table 12 Document Data Model Example
188
190
xv
109
Preface
It’s time to get your head in the cloud!
In today’s business environment, more and more people are
requesting cloud-based solutions to help solve their business
challenges. So how can you not only anticipate your clients’ needs
but also keep ahead of the curve to ensure their goals stay on track?
With the help of this accessible book, you’ll get a clear sense of
cloud computing and understand how to communicate the benefits,
drawbacks, and options to your clients so they can make the best
choices for their unique needs. Plus, case studies give you the opportunity to relate real-life examples of how the latest technologies are
giving organizations worldwide the chance to thrive as supply chain
solutions in the cloud.
What this book does:
◾ Demonstrates how improvements in forecasting, collaboration,
and inventory optimization can lead to cost savings.
◾ Explores why cloud computing is becoming increasingly
important.
◾ Takes a close look at the types of cloud computing.
◾ Makes sense of demand-driven forecasting using Amazon’s
cloud or Microsoft’s cloud, Azure.
Whether you work in management, business, or information technology (IT), this will be the dog-eared reference you’ll want to keep
close by as you continue making sense of the cloud.
xvii
Acknowledgments
This book would not have been possible without the help and support
from various colleagues, friends, and organizations. I would like to
take this opportunity to thank Jack Zhang (SAS), Blanche Shelton
(SAS), Bob Davis (SAS), and Stacey Hamilton (SAS) for supporting
the idea and helping with moving it forward. A special thank you
to Emily Paul (Wiley), Shek Cho (Wiley), Mike Henton (Wiley), and
Lauree Shepard (SAS) for their help with turning the book into
reality. Research from various organizations has been vital to the
success of this book, and I would like to especially thank Carol Miller
(MHI), Amy Sarosiek (GE), Emily Neuman (AWS), Frank Simorj
(Microsoft), Heather Gallo (Synergy Research), Juergen Brettel (ISG
Research), Kim Weins (RightScale), Michael Mentzel (Heise Medien),
Owen Rogers (451 Research), and Suellen Bergman (BCG) for their
help in including such content. Last, but not least, I would like to
express a very special thank you to esteemed colleagues, supply chain
gurus, and good friends Charles Chase (SAS) and Christoph Hartmann
(SAS) for their expert help with this book.
A special thank you to the following organizations for their help:
451 Research, AWS, Boston Consulting Group, Cisco, European
Commission, European Union, Experton Group, Gartner, GE, Heise
Medien, IBF, ISG Research, McAfee, MHI, Microsoft, RightScale, SAS,
Skyhigh, Supply Chain Insights, and Synergy Research.
xix
The Cloud-Based
Demand-Driven
Supply Chain
C H A P T E R
1
Demand-Driven
Forecasting in the
Supply Chain
1
The Cloud-Based Demand-Driven Supply Chain, First Edition. Vinit Sharma.
© 2019 John Wiley & Sons, Inc. Published 2019 by John Wiley & Sons, Inc.
T
he world is changing at an increasing pace. Consumers are
becoming more demanding, and they expect products and services of high quality, value for their money, and timely availability.
Organizations and industries across the globe are under pressure to
produce products or provide services at the right time, quantity,
price, and location. As global competition has increased, those organizations that fail to be proactive with information and business
insights gained risk loss of sales and lower market share. Supply chain
optimization—from forecasting and planning to execution point of
view—is critical to success for organizations across industries and the
world. The focus of this book is on demand-driven forecasting (using
data as evidence to forecast demand for sales units) and how cloud
computing can assist with computing and Big Data challenges faced by
organizations today. From a demand-driven forecasting perspective,
the context will be a business focus rather than a statistical point of
view. For the purpose of this book, the emphasis will be on forecasting
sales units, highlighting possible benefits of improved forecasts, and
supply chain optimization.
Advancements in information technology (IT) and decreasing costs
(e.g., data storage, computational resources) can provide opportunities
for organizations needing to analyze lots of data. It is becoming easier and more cost-effective to capture, store, and gain insights from
data. Organizations can then respond better and at a quicker pace,
producing those products that are in high demand or providing the
best value to the organization. Business insights can help organizations understand the sales demand for their products, the sentiment
(e.g., like or dislike products) that customers have about their products, and which locations have the highest consumption. The business
intelligence gained can help organizations understand what price sensitivity exists, whether there is effectiveness of events and promotions
(e.g., influencing demand), what product attributes make the most
consumer impact, and much more. IT can help organizations increase
digitalization of their supply chains, and cloud computing can provide a scalable and cost-effective platform for organizations to capture,
store, analyze, and consume (view and consequently act upon) large
amounts of data.
2
DEMAND-DRIVEN FORECASTING IN THE SUPPLY CHAIN
3
This chapter aims to provide a brief context of demand-driven forecasting from a business perspective and sets the scene for subsequent
chapters that focus on cloud computing and how the cloud as a platform can assist with demand-driven forecasting and related challenges.
Personal experiences (drawing upon consultative supply chain projects
at SAS) are interspersed throughout the chapters, though they have
been anonymized to protect organizations worldwide. Viewpoints from
several vendors are included to provide a broad and diverse vision of
demand-driven forecasting and supply chain optimization, as well as
cloud computing.
Forecasting of sales is generally used to help organizations predict
the number of products to produce, ship, store, distribute, and ultimately sell to end consumers. There has been a shift away from a push
philosophy (also known as inside-out approach) where organizations
are sales driven and push products to end consumers. This philosophy has often resulted in overproduction, overstocks in all locations
in the supply chain network, and incorrect understanding of consumer
demand. Stores often have had to reduce prices to help lower inventory,
and this has had a further impact on the profitability of organizations.
Sales can be defined as shipments or sales orders. Demand can include
point of sales (POS) data, syndicated scanner data, online or mobile
sales, or demand data from a connected device (e.g., vending machine,
retail stock shelves). A new demand-pull (also known as an outside-in
approach) philosophy has gained momentum where organizations are
learning to sense demand (also known as demand-sensing) of end consumers and to shift their supply chains to operate more effectively.
Organizations that are changing their sales and operations planning
(S&OP) process and moving to a demand-pull philosophy are said to
be creating a demand-driven supply network (DDSN). (See Figure 1.)
The Boston Consulting Group (BCG) defines a demand-driven
supply chain (DDSC) as a system of coordinated technologies and
processes that senses and reacts to real-time demand signals across
a network of customers, suppliers, and employees (Budd, Knizek,
and Tevelson 2012, 3). For an organization to be genuinely demanddriven, it should aim for an advanced supply chain (i.e., supply
chain 2.0) that seamlessly integrates customer expectations into
4
THE CLOUD-BASED DEMAND-DRIVEN SUPPLY CHAIN
Driven by Sales Forecast
Supplier
Factory
PUSH
Warehouse
Logistics
Driven by Demand
Distribution
Center
Consumer
PULL
Figure 1 Push and Pull—Sales and Operations Process
its fulfillment model (Joss et al. 2016, 19). Demand-driven supply
chain management focuses on the stability of individual value chain
activities, as well as the agility to autonomously respond to changing
demands immediately without prior thought or preparation (Eagle
2017, 22). Organizations that transition to a demand-driven supply
chain are adopting the demand-pull philosophy mentioned earlier. In
today’s fast-moving world, the supply chain is moving away from an
analog and linear model to a digital and multidimensional model—an
interconnected neural model (many connected nodes in a mesh, as
shown in Figure 2). Information between nodes is of various types,
and flows at different times, volumes, and velocities. Organizations
must be able to ingest, sense (analyze), and proactively act upon
insights promptly to be successful. According to an MHI survey that
was published (Batty et al. 2017, 3), 80 percent of respondents believe
a digital supply chain will prevail by the year 2022. The amount
of adoption of a digital supply chain transformation varies across
organizations, industries, and countries.
It has become generally accepted that those organizations that use
business intelligence and data-driven insights outperform those organizations that do not. Top-performing organizations realize the value of
leveraging data (Curran et al. 2015, 2–21). Using business intelligence
(BI) with analytics built upon quality data (relevant and complete data)
allows organizations to sense demand, spot trends, and be more proactive. The spectrum of data is also changing with the digitalization of the
supply chain. Recent enhancements in technologies and economies of
DEMAND-DRIVEN FORECASTING IN THE SUPPLY CHAIN
5
Traditional Supply Chain
Supplier
Factory
Warehouse
Logistics
Distribution
Center
Consumer
Digital Supply Chain
Figure 2
Digital Supply Chain—Interconnected
scale have made it possible to capture data from countless sources and
at faster rates (e.g., near real time or regular ingress intervals) than previously possible. Data no longer must be limited to sales demand only,
and can include other sources such as weather, economic events and
trends, social media data (e.g., useful for product sentiment analysis),
traffic data, and more.
Capturing data faster (e.g., near real time via connected devices)
and capturing larger volumes of data (e.g., several years of historical
data of many variables) have now become more accessible and more
affordable than ever before. One of the main philosophies of Big Data
is to capture and store all types of data now and worry about figuring out the questions to ask of the data later. There are opportunities
for organizations to leverage technologies in computing, analytics, data
6
THE CLOUD-BASED DEMAND-DRIVEN SUPPLY CHAIN
capture and storage, and the Internet of Things (IoT) to transform their
business to a digital supply chain (a well-connected supply chain).
Such data and analytics can lead to improved insights and visibility of
an entire supply chain network. The end-to-end supply chain visibility
of information and material flow enables organizations to make holistic
data-driven decisions optimal for their businesses (Muthukrishnan and
Sullivan 2012, 2). Organizations wishing to optimize their supply chain
management are moving toward an intelligent and integrated supply
management model that has high supply network visibility and high
integration of systems, processes, and people of the entire supply chain
network internal and external to the organization (Muthukrishnan
and Sullivan 2012, 2–5).
The holistic and real-time data coupled with advanced analytics can
help organizations make optimal decisions, streamline operations, and
minimize risk through a comprehensive risk management program
(Muthukrishnan and Sullivan 2012, 5). The value of data is maximized
when it is acted upon at the right time (Barlow 2015, 22). The benefits
of the increased visibility and transparency include improved supplier
performance, reduced operational costs, improved sales and operations
planning (S&OP) outcomes, and increased supply chain responsiveness
(Muthukrishnan and Sullivan 2012, 6). Implementing a supply chain
with high visibility and integration provides benefits such as increased
sales through faster responses and decision making, reduced inventory
across the supply chain, reduced logistic and procurement costs, and
improved service levels (Muthukrishnan and Sullivan 2012, 11).
The increasing needs for supply chain visibility are leading to the
adoption of supply chain control towers (SCCTs), depicted in Figure 3.
An organization could use an SCCT as a central hub to centralize and
integrate required technologies, organizations (intranet and extranet
supply chain network members), and processes to capture, analyze,
and use the information to make holistic and data-driven decisions
(Bhosle et al. 2011, 4). Using an SCCT can help with strategic, tactical,
and operational-level control of a supply chain. Having a holistic view
through an SCCT helps an organization and its supply chain network
to become more agile (e.g., ability to change supply chain processes,
partners, or facilities). It also helps increase resilience against unexpected events outside of the control of the supply chain network.
DEMAND-DRIVEN FORECASTING IN THE SUPPLY CHAIN
00101
Other
Data
Supply
Chain
Control
Tower
l
na
er
Inte
r
Insights
Decisions
Execution
Ex
t
Secured
l
na
Data
Tracking
Alerts
KPIs
Connected
0101
1010
0010
Advanced
Analytics
7
Demand, Sales, Orders
Cloud
Supply
Chain
organization
Supply
Chain
organization
0101
1010
0010
Data
Big/Small
Hot/Cold
Transport, Logistics,
Supply Network
Track Costs
Throughout
Supply Chain
Material, Production, Inventory
Figure 3
Supply Chain Control Tower
Reliability and supply chain effectiveness can be improved by meeting
service levels, cost controls, availability, and quality targets (Bhosle
et al. 2011, 4–6).
An SCCT can also help a supply chain network become more
responsive to changes in demand, capacity, and other factors that
could influence business (Bhosle et al. 2011, 6). There are three
phases of maturity for implementing and executing such a supply
chain control tower. The first phase typically focuses on operational
visibility such as shipment and inventory status. Phase 2 is where
the information flowing to the supply chain control tower is used to
monitor the progress of shipments through the various network nodes
of a supply chain and alert decision makers of any potential issues
8
THE CLOUD-BASED DEMAND-DRIVEN SUPPLY CHAIN
or events. In the third and most mature phase, data and artificial
intelligence are used to predict the potential problems or bottlenecks
(Bhosle et al. 2011, 5–8). The data captured and processed by the
SCCT can provide the supply chain visibility and insights necessary to
make appropriate decisions and to operate a customer-focused supply
chain (Bhosle et al. 2011, 9).
Benefits of a supply chain control tower include lower costs,
enriched decision-making capabilities, improved demand forecasts,
optimized inventory levels, reduced buffer inventory, reduced cycle
times, better scheduling and planning, improved transport and
logistics, and higher service levels (Bhosle et al. 2011, 11).
One of the main challenges of the digital supply chain is
demand-driven forecasting, and it is generally a top priority of
organizations wishing to improve their business. Forecasting and
Personalization were ranked as the top two needed analytical capabilities (Microsoft 2015, 14). The forecasting function was rated as
either very challenging or somewhat challenging (39 and 36 percent,
respectively) in an MHI Annual Industry Report (Batty et al. 2017, 9),
and in a 2018 survey more than 50 percent of respondents noted the
forecasting function as very challenging (see Figure 4).
There are distinct phases of maturity for forecasting, and such
maturity levels vary significantly across organizations, industries, and
countries. Unscientific forecasting and planning (e.g., using personal
Customer demands on the supply chain
Hiring qualified workers
Forecasting
Increasing competitive intensity, raising customer expectations
Insight into customer behavior and product usage
Synchronization of the supply chain
Insight into supply and demand
Omni-channel fulfillment
Out-of-stock situations
Implementing sustainability programs
Visibility of inbound and outbound shipments
Very Challenging
Not Challenging
100%
90%
80%
70%
60%
50%
30%
Somewhat Challenging
Figure 4 MHI 2018 Survey Results: Company Challenges
Source: MHI Annual Industry Report, 2018, 8.
40%
20%
0%
Extremely Challenging
10%
Food safety, spoilage, and contamination
DEMAND-DRIVEN FORECASTING IN THE SUPPLY CHAIN
9
judgment versus statistical evidence) are still prevalent in many
sectors, as shown in a survey by Blue Yonder (2016) in the grocery
retail sector. The Blue Yonder report highlights the finding that 48
percent of those surveyed are still using manual processes and gut
feeling to make choices, instead of using data-driven actions (Blue
Yonder 2016, 25). There are many benefits of making a transition
to a demand-driven supply chain. Research by BCG highlights that
some companies carry 33 percent less inventory and improve delivery
performance by 20 percent (Budd, Knizek, and Tevelson 2012, 3).
A strategy for improved forecasting needs to be holistic and to
focus on multiple dimensions to be most effective. The journey toward
improvement should include three key pillars:
1. Data
2. Analytics
3. Collaboration—people and processes using a collaborative
approach
1. DATA
As mentioned earlier, data is the foundation for analytics, business
intelligence, and insights to be gained. The famous “garbage in, garbage
out” concept equally applies to today’s challenges. Organizations must
be able to capture and analyze data that is relevant to forecasts and
supply chain optimizations. Having access to holistic data (e.g., historical demand data, data from other influencing factors) allows organizations to apply advanced analytics to help sense the demand for
their products. Insights gained from analytics allows organizations to
detect and shape demand—for example, the most demanded products
at the right location, at the right time, at the right price, and with the
right attributes. Leveraging data and advanced analytics allows organizations to understand correlations and the effect that influencing
factors such as price, events, promotions, and the like have on the
demand of sales units. As Marcos Borges of the Nestlé organization
noted (SAS Institute press release, October 12, 2017), a differentiating
benefit of advanced forecasting is the ability to analyze holistic data
(multiple data variables) and identify factors influencing demand for
10
THE CLOUD-BASED DEMAND-DRIVEN SUPPLY CHAIN
each product throughout a product hierarchy. This process should be
automated, and be able to handle large volumes (e.g., many transactions across many dimensions) with depth of data (e.g., a hierarchy of
a product dimension).
Quality of data is an essential but often overlooked aspect of analytics. Generally, for a forecast to be meaningful, there should be access
to at least two years of historical data at the granularity level of the
required forecast (e.g., daily or weekly data for weekly forecasts). This
data should be available for all hierarchy levels of the unit or metric of
the time series. For example, a consumer packaged goods (CPG) company wishing to predict demand for chocolates would have a product
dimension in its data mart for forecasting. This dimension would have
a hierarchy with various categories and subcategories. Individual products are called leaf member nodes, and they belong to one hierarchy
chain. Those products therefore have a direct and single relationship
link rolling upward through the hierarchy. A leaf member can just roll
up through one subcategory and category (see Figure 5). Ideally, data
should be available for all relevant dimensions. Granular data for the
levels of all dimensions should also be available. The combination of
product dimension data in this example and time-series data (e.g., sales
transactions) that is complete (e.g., sales transaction data across all levels of product hierarchy for at least two years) increases the accuracy
of the forecast.
If data is available across all levels of the hierarchy of the dimension, then forecast reconciliation techniques (performed by software
solutions) such as top-down, bottom-up, and middle-out forecasting
Acme CPG company
Category
Subcategory
Packet size
Flavor type
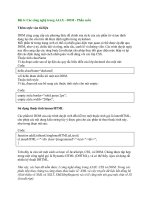
Product (Leaf node—lowest level)
Figure 5 Example: Product Dimension Hierarchy