Big data now 2014 edition
Bạn đang xem bản rút gọn của tài liệu. Xem và tải ngay bản đầy đủ của tài liệu tại đây (4.41 MB, 164 trang )
Big Data Now: 2014 Edition
2014 Edition
O’Reilly Media, Inc.
Big Data Now: 2014 Edition
by O’Reilly Media, Inc.
Copyright © 2015 O’Reilly Media, Inc. All rights reserved.
Printed in the United States of America.
Published by O’Reilly Media, Inc., 1005 Gravenstein Highway North,
Sebastopol, CA 95472.
O’Reilly books may be purchased for educational, business, or sales
promotional use. Online editions are also available for most titles
(). For more information, contact our
corporate/institutional sales department: 800-998-9938 or
Editor: Tim McGovern
Production Editor: Kristen Brown
Cover Designer: Ellie Volckhausen
Illustrator: Rebecca Demarest
January 2015: First Edition
Revision History for the First Edition
2015-01-09: First Release
See for release
details.
While the publisher and the author(s) have used good faith efforts to ensure
that the information and instructions contained in this work are accurate, the
publisher and the author(s) disclaim all responsibility for errors or omissions,
including without limitation responsibility for damages resulting from the use
of or reliance on this work. Use of the information and instructions contained
in this work is at your own risk. If any code samples or other technology this
work contains or describes is subject to open source licenses or the
intellectual property rights of others, it is your responsibility to ensure that
your use thereof complies with such licenses and/or rights.
978-1-491-91736-7
[LSI]
Introduction: Big Data’s Big
Ideas
The big data space is maturing in dog years, seven years of maturity for each
turn of the calendar. In the four years we have been producing our annual Big
Data Now, the field has grown from infancy (or, if you prefer the canine
imagery, an enthusiastic puppyhood) full of potential (but occasionally still
making messes in the house), through adolescence, sometimes awkward as it
figures out its place in the world, into young adulthood. Now in its late
twenties, big data is now not just a productive member of society, it’s a
leader in some fields, a driver of innovation in others, and in still others it
provides the analysis that makes it possible to leverage domain knowledge
into scalable solutions.
Looking back at the evolution of our Strata events, and the data space in
general, we marvel at the impressive data applications and tools now being
employed by companies in many industries. Data is having an impact on
business models and profitability. It’s hard to find a non-trivial application
that doesn’t use data in a significant manner. Companies who use data and
analytics to drive decision-making continue to outperform their peers.
Up until recently, access to big data tools and techniques required significant
expertise. But tools have improved and communities have formed to share
best practices. We’re particularly excited about solutions that target new data
sets and data types. In an era when the requisite data skill sets cut across
traditional disciplines, companies have also started to emphasize the
importance of processes, culture, and people.
As we look into the future, here are the main topics that guide our current
thinking about the data landscape. We’ve organized this book around these
themes:
Cognitive Augmentation
The combination of big data, algorithms, and efficient user interfaces can
be seen in consumer applications such as Waze or Google Now. Our
interest in this topic stems from the many tools that democratize analytics
and, in the process, empower domain experts and business analysts. In
particular, novel visual interfaces are opening up new data sources and
data types.
Intelligence Matters
Bring up the topic of algorithms and a discussion on recent developments
in artificial intelligence (AI) is sure to follow. AI is the subject of an
ongoing series of posts on O’Reilly Radar. The “unreasonable
effectiveness of data” notwithstanding, algorithms remain an important
area of innovation. We’re excited about the broadening adoption of
algorithms like deep learning, and topics like feature
engineering, gradient boosting, and active learning. As intelligent systems
become common, security and privacy become critical. We’re interested
in efforts to make machine learning secure in adversarial environments.
The Convergence of Cheap Sensors, Fast Networks, and Distributed
Computing
The Internet of Things (IoT) will require systems that can process and
unlock massive amounts of event data. These systems will draw from
analytic platforms developed for monitoring IT operations. Beyond data
management, we’re following recent developments in streaming analytics
and the analysis of large numbers of time series.
Data (Science) Pipelines
Analytic projects involve a series of steps that often require different
tools. There are a growing number of companies and open source projects
that integrate a variety of analytic tools into coherent user interfaces and
packages. Many of these integrated tools enable replication,
collaboration, and deployment. This remains an active area, as specialized
tools rush to broaden their coverage of analytic pipelines.
The Evolving, Maturing Marketplace of Big Data Components
Many popular components in the big data ecosystem are open source. As
such, many companies build their data infrastructure and products by
assembling components like Spark, Kafka, Cassandra, and ElasticSearch,
among others. Contrast that to a few years ago when many of these
components weren’t ready (or didn’t exist) and companies built similar
technologies from scratch. But companies are interested in applications
and analytic platforms, not individual components. To that end, demand
is high for data engineers and architects who are skilled in maintaining
robust data flows, data storage, and assembling these components.
Design and Social Science
To be clear, data analysts have always drawn from social science (e.g.,
surveys, psychometrics) and design. We are, however, noticing that many
more data scientists are expanding their collaborations with product
designers and social scientists.
Building a Data Culture
“Data-driven” organizations excel at using data to improve decisionmaking. It all starts with instrumentation. “If you can’t measure it, you
can’t fix it,” says DJ Patil, VP of product at RelateIQ. In addition,
developments in distributed computing over the past decade have given
rise to a group of (mostly technology) companies that excel in building
data products. In many instances, data products evolve in stages (starting
with a “minimum viable product”) and are built by cross-functional teams
that embrace alternative analysis techniques.
The Perils of Big Data
Every few months, there seems to be an article criticizing the hype
surrounding big data. Dig deeper and you find that many of the criticisms
point to poor analysis and highlight issues known to experienced data
analysts. Our perspective is that issues such as privacy and the cultural
impact of models are much more significant.
Chapter 1. Cognitive
Augmentation
We address the theme of cognitive augmentation first because this is where
the rubber hits the road: we build machines to make our lives better, to bring
us capacities that we don’t otherwise have—or that only some of us would.
This chapter opens with Beau Cronin’s thoughtful essay on predictive APIs,
things that deliver the right functionality and content at the right time, for the
right person. The API is the interface that tackles the challenge that Alistair
Croll defined as “Designing for Interruption.” Ben Lorica then discusses
graph analysis, an increasingly prevalent way for humans to gather
information from data. Graph analysis is one of the many building blocks of
cognitive augmentation; the way that tools interact with each other—and with
us—is a rapidly developing field with huge potential.
Challenges Facing Predictive APIs
Solutions to a number of problems must be found to
unlock PAPI value
by Beau Cronin
In November, the first International Conference on Predictive APIs and Apps
will take place in Barcelona, just ahead of Strata Barcelona. This event will
bring together those who are building intelligent web services (sometimes
called Machine Learning as a Service) with those who would like to use these
services to build predictive apps, which, as defined by Forrester, deliver “the
right functionality and content at the right time, for the right person, by
continuously learning about them and predicting what they’ll need.”
This is a very exciting area. Machine learning of various sorts is
revolutionizing many areas of business, and predictive services like the ones
at the center of predictive APIs (PAPIs) have the potential to bring these
capabilities to an even wider range of applications. I co-founded one of the
first companies in this space (acquired by Salesforce in 2012), and I remain
optimistic about the future of these efforts. But the field as a whole faces a
number of challenges, for which the answers are neither easy nor obvious,
that must be addressed before this value can be unlocked.
In the remainder of this post, I’ll enumerate what I see as the most pressing
issues. I hope that the speakers and attendees at PAPIs will keep these in
mind as they map out the road ahead.
Data Gravity
It’s widely recognized now that for truly large data sets, it makes a lot more
sense to move compute to the data rather than the other way around—which
conflicts with the basic architecture of cloud-based analytics services such as
predictive APIs. It’s worth noting, though, that after transformation and
cleaning, many machine learning data sets are actually quite small—not
much larger than a hefty spreadsheet. This is certainly an issue for the truly
big data needed to train, say, deep learning models.
Workflow
The data gravity problem is just the most basic example of a number of issues
that arise from the development process for data science and data products.
The Strata conferences right now are flooded with proposals from data
science leaders who stress the iterative and collaborative nature of this work.
And it’s now widely appreciated that the preparatory (data preparation,
cleaning, transformation) and communication (visualization, presentation,
storytelling) phases usually consume far more time and energy than model
building itself. The most valuable toolsets will directly support (or at least not
disrupt) the whole process, with machine learning and model building closely
integrated into the overall flow. So, it’s not enough for a predictive API to
have solid client libraries and/or a slick web interface: instead, these services
will need to become upstanding, fully assimilated citizens of the existing data
science stacks.
Crossing the Development/Production Divide
Executing a data science project is one thing; delivering a robust and scalable
data product entails a whole new set of requirements. In a nutshell, projectbased work thrives on flexible data munging, tight iteration loops, and
lightweight visualization; productization emphasizes reliability, efficient
resource utilization, logging and monitoring, and solid integration with other
pieces of distributed architecture. A predictive API that supports one of these
endeavors won’t necessarily shine in the other setting. These limitations
might be fine if expectations are set correctly; it’s fine for a tool to support,
say, exploratory work, with the understanding that production use will
require re-implementation and hardening. But I do think the reality does
conflict with some of the marketing in the space.
Users and Skill Sets
Sometimes it can be hard to tell at whom, exactly, a predictive service is
aimed. Sophisticated and competent data scientists—those familiar with the
ins and outs of statistical modeling and machine learning methods—are
typically drawn to high-quality open source libraries, like scikit-learn, which
deliver a potent combination of control and ease of use. For these folks,
predictive APIs are likely to be viewed as opaque (if the methods aren’t
transparent and flexible) or of questionable value (if the same results could be
achieved using a free alternative). Data analysts, skilled in data
transformation and manipulation but often with limited coding ability, might
be better served by a more integrated “workbench” (such as those provided
by legacy vendors like SAS and SPSS). In this case, the emphasis is on the
overall experience rather than the API. Finally, application developers
probably just want to add predictive capabilities to their products, and need a
service that doesn’t force them to become de facto (and probably subpar) data
scientists along the way.
These different needs are conflicting, and clear thinking is needed to design
products for the different personas. But even that’s not enough: the real
challenge arises from the fact that developing a single data product or
predictive app will often require all three kinds of effort. Even a service that
perfectly addresses one set of needs is therefore at risk of being marginalized.
Horizontal versus Vertical
In a sense, all of these challenges come down to the question of value. What
aspects of the total value chain does a predictive service address? Does it
support ideation, experimentation and exploration, core development,
production deployment, or the final user experience? Many of the developers
of predictive services that I’ve spoken with gravitate naturally toward the
horizontal aspect of their services. No surprise there: as computer scientists,
they are at home with abstraction, and they are intellectually drawn to—even
entranced by—the underlying similarities between predictive problems in
fields as diverse as finance, health care, marketing, and e-commerce. But this
perspective is misleading if the goal is to deliver a solution that carries more
value than free libraries and frameworks. Seemingly trivial distinctions in
language, as well as more fundamental issues such as appetite for risk, loom
ever larger.
As a result, predictive API providers will face increasing pressure to
specialize in one or a few verticals. At this point, elegant and general APIs
become not only irrelevant, but a potential liability, as industry- and domainspecific feature engineering increases in importance and it becomes crucial to
present results in the right parlance. Sadly, these activities are not thin
adapters that can be slapped on at the end, but instead are ravenous time
beasts that largely determine the perceived value of a predictive API. No
single customer cares about the generality and wide applicability of a
platform; each is looking for the best solution to the problem as he conceives
it.
As I said, I am hopeful that these issues can be addressed—if they are
confronted squarely and honestly. The world is badly in need of more
accessible predictive capabilities, but I think we need to enlarge the problem
before we can truly solve it.
There Are Many Use Cases for Graph
Databases and Analytics
Business users are becoming more comfortable with
graph analytics
by Ben Lorica
The rise of sensors and connected devices will lead to applications that draw
from network/graph data management and analytics. As the number of
devices surpasses the number of people—Cisco estimates 50 billion
connected devices by 2020—one can imagine applications that depend on
data stored in graphs with many more nodes and edges than the ones
currently maintained by social media companies.
This means that researchers and companies will need to produce real-time
tools and techniques that scale to much larger graphs (measured in terms of
nodes and edges). I previously listed tools for tapping into graph data, and I
continue to track improvements in accessibility, scalability, and performance.
For example, at the just-concluded Spark Summit, it was apparent that
GraphX remains a high-priority project within the Spark1 ecosystem.
Another reason to be optimistic is that tools for graph data are getting tested
in many different settings. It’s true that social media applications remain
natural users of graph databases and analytics. But there are a growing
number of applications outside the “social” realm. In his recent Strata Santa
Clara talk and book, Neo Technology’s founder and CEO Emil Eifrem listed
other uses cases for graph databases and analytics:
Network impact analysis (including root cause analysis in data centers)
Route finding (going from point A to point B)
Recommendations
Logistics
Authorization and access control
Fraud detection
Investment management and finance (including securities and debt)
The widening number of applications means that business users are becoming
more comfortable with graph analytics. In some domains network science
dashboards are beginning to appear. More recently, analytic tools like
GraphLab Create make it easier to unlock and build applications with graph2
data. Various applications that build upon graph search/traversal are
becoming common, and users are beginning to be comfortable with notions
like “centrality” and “community structure”.
A quick way to immerse yourself in the graph analysis space is to attend the
third GraphLab conference in San Francisco—a showcase of the best tools3
for graph data management, visualization, and analytics, as well as interesting
use cases. For instance, MusicGraph will be on hand to give an overview of
their massive graph database from the music industry, Ravel Law will
demonstrate how they leverage graph tools and analytics to improve search
for the legal profession, and Lumiata is assembling a database to help
improve medical science using evidence-based tools powered by graph
analytics.
Figure 1-1. Interactive analyzer of Uber trips across San Francisco’s micro-communities
Network Science Dashboards
Network graphs can be used as primary visual objects
with conventional charts used to supply detailed views
by Ben Lorica
With Network Science well on its way to being an established academic
discipline, we’re beginning to see tools that leverage it.4 Applications that
draw heavily from this discipline make heavy use of visual representations
and come with interfaces aimed at business users. For business analysts used
to consuming bar and line charts, network visualizations take some getting
used. But with enough practice, and for the right set of problems, they are an
effective visualization model.
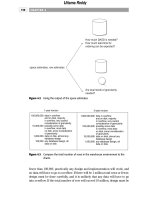
In many domains, networks graphs can be the primary visual objects with
conventional charts used to supply detailed views. I recently got a preview of
some dashboards built using Financial Network Analytics (FNA). In the
example below, the primary visualization represents correlations among
assets across different asset classes5 (the accompanying charts are used to
provide detailed information for individual nodes):
Using the network graph as the center piece of a dashboard works well in this
instance. And with FNA’s tools already being used by a variety of
organizations and companies in the financial sector, I think “Network Science
dashboards” will become more commonplace in financial services.
Network Science dashboards only work to the extent that network graphs are
effective (networks graphs tend get harder to navigate and interpret when the
number of nodes and edges get large6). One workaround is to aggregate nodes
and visualize communities rather than individual objects. New ideas may also
come to the rescue: the rise of networks and graphs is leading to better
techniques for visualizing large networks.
This fits one of the themes we’re seeing in Strata: cognitive augmentation.
The right combination of data/algorithm(s)/interface allows analysts to make
smarter decisions much more efficiently. While much of the focus has been
on data and algorithms, it’s good to see more emphasis paid to effective
interfaces and visualizations.
1
Full disclosure: I am an advisor to Databricks—a startup commercializing
Apache Spark.
2
As I noted in a previous post, GraphLab has been extended to handle
general machine learning problems (not just graphs).
3
Exhibitors at the GraphLab conference will include creators of several
major graph databases, visualization tools, and Python tools for data
scientists.
4
This post is based on a recent conversation with Kimmo Soramäki, founder
of Financial Network Analytics.
5
Kimmo is an experienced researcher and policy-maker who has consulted
and worked for several central banks. Thus FNA’s first applications are
aimed at financial services.
6
Traditional visual representations of large networks are pejoratively referred
to as “hairballs.”
Chapter 2. Intelligence Matters
Artificial intelligence has been “just around the corner” for decades. But it’s
more accurate to say that our ideas of what we can expect from AI have been
sharpening and diversifying since the invention of the computer. Beau Cronin
starts off this chapter with consideration of AI’s ‘dueling definitions'—and
then resolves the “duel” by considering both artificial and human intelligence
as part of a system of knowledge; both parts are vital and new capacities for
both human and machine intelligence are coming.
Pete Warden then takes us through deep learning—one form of machine
intelligence whose performance has been astounding over the past few years,
blasting away expectations particularly in the field of image recognition.
Mike Loukides then brings us back to the big picture: what makes human
intelligence is not power, but the desire for betterment.
AI’s Dueling Definitions
Why my understanding of AI is different from yours
by Beau Cronin
Let me start with a secret: I feel self-conscious when I use the terms “AI” and
“artificial intelligence.” Sometimes, I’m downright embarrassed by them.
Before I get into why, though, answer this question: what pops into your head
when you hear the phrase artificial intelligence?
Figure 2-1. SoftBank’s Pepper, a humanoid robot that takes its surroundings into consideration.
For the layperson, AI might still conjure HAL’s unblinking red eye, and all
the misfortune that ensued when he became so tragically confused. Others
jump to the replicants of Blade Runner or more recent movie robots. Those
who have been around the field for some time, though, might instead
remember the “old days” of AI—whether with nostalgia or a shudder—when
intelligence was thought to primarily involve logical reasoning, and truly
intelligent machines seemed just a summer’s work away. And for those
steeped in today’s big-data-obsessed tech industry, “AI” can seem like
nothing more than a high-falutin’ synonym for the machine-learning and
predictive-analytics algorithms that are already hard at work optimizing and
personalizing the ads we see and the offers we get—it’s the term that gets
trotted out when we want to put a high sheen on things.
Like the Internet of Things, Web 2.0, and big data, AI is discussed and
debated in many different contexts by people with all sorts of motives and
backgrounds: academics, business types, journalists, and technologists. As
with these other nebulous technologies, it’s no wonder the meaning of AI can
be hard to pin down; everyone sees what they want to see. But AI also has
serious historical baggage, layers of meaning and connotation that have
accreted over generations of university and industrial research, media hype,
fictional accounts, and funding cycles. It’s turned into a real problem: without
a lot of context, it’s impossible to know what someone is talking about when
they talk about AI.
Let’s look at one example. In his 2004 book On Intelligence, Jeff Hawkins
confidently and categorically states that AI failed decades ago. Meanwhile,
the data scientist John Foreman can casually discuss the “AI models” being
deployed every day by data scientists, and Marc Andreessen can claim that
enterprise software products have already achieved AI. It’s such an
overloaded term that all of these viewpoints are valid; they’re just starting
from different definitions.
Which gets back to the embarrassment factor: I know what I mean when I
talk about AI, at least I think I do, but I’m also painfully aware of all these
other interpretations and associations the term evokes. And I’ve learned over
the years that the picture in my head is almost always radically different from
that of the person I’m talking to. That is, what drives all this confusion is the
fact that different people rely on different primal archetypes of AI.
Let’s explore these archetypes, in the hope that making them explicit might
provide the foundation for a more productive set of conversations in the
future.