Impacts of food safety regulations on vietnam seafood export
Bạn đang xem bản rút gọn của tài liệu. Xem và tải ngay bản đầy đủ của tài liệu tại đây (666.88 KB, 58 trang )
UNIVERSITY OF ECONOMICS
INSTITUTE OF SOCIAL STUDIES
HO CHI MINH CITY
THE HAGUE
VIETNAM
THE NETHERLANDS
VIETNAM - NETHERLANDS
PROGRAMME FOR M.A IN DEVELOPMENT ECONOMICS
IMPACTS OF FOOD SAFETY
REGULATIONS ON VIETNAM
SEAFOOD EXPORT
BY
DANG THI LY LY
MASTER OF ARTS IN DEVELOPMENT ECONOMICS
HO CHI MINH CITY, February 2016
UNIVERSITY OF ECONOMICS
INSTITUTE OF SOCIAL STUDIES
HO CHI MINH CITY
THE HAGUE
VIETNAM
THE NETHERLANDS
VIETNAM - NETHERLANDS
PROGRAMME FOR M.A IN DEVELOPMENT ECONOMICS
IMPACTS OF FOOD SAFETY
REGULATIONS ON VIETNAM
SEAFOOD EXPORT
A thesis submitted in partial fulfilment of the requirements for the degree of
MASTER OF ARTS IN DEVELOPMENT ECONOMICS
By
DANG THI LY LY
Academic Supervisor:
Dr. NGUYEN HOANG BAO
HO CHI MINH CITY, February 2016
ABSTRACT
This paper employs gravity model to analyze the bilateral seafood trade
between Vietnam and 17 countries from 1997 to 2012. The panel data is taken from
Vietnam General Statistics Organization, International Monetary Fund, World Bank
and Centre d'Etudes Prospectives et d'Informations Internationales. The Hausman Test
indicates that fixed effects model is suitable for estimating the regression. The
estimation results show that food safety regulations and exchange rate significantly
affect seafood export. On the other hands, importing GDP and distance is statistically
insignificant. Also the trade potential result reveals that Vietnam has many
opportunities to develop trade with Europe partners.
Key words: Gravity Model, seafood export, Vietnam
iii
ACKNOWLEDGEMENT
I have made great efforts to finish this thesis; nevertheless, it would have not
been finished without support of many individual and organizations.
I highly
appreciate their full support during this hard time.
Iwould like toespecially thank all of my academic supervisors, the Scientific
Committee, and staff of Vietnam- Netherlands Program for their guidance and support
with this thesis.
Finally,I would like to express my special appreciation to my whole family and
classmates for helping me complete this thesis.
iv
TABLE OF CONTENTS
ABSTRACT .............................................................................................................. iii
ACKNOWLEDGEMENT .........................................................................................iv
LIST OF FIGURES................................................................................................. viii
LIST OF TABLES .................................................................................................. viii
LIST OF APPENDICES ......................................................................................... viii
ABBREVIATIONS....................................................................................................ix
CHAPTER 1. INTRODUCTION ...............................................................................1
1.1.
Problem statement .........................................................................................1
1.2.
Significance of study .......................................................................................3
1.3.
Research objective .........................................................................................3
1.4.
Research question ..........................................................................................3
1.5.
Scope of study ...............................................................................................3
1.6.
Structure of thesis ..........................................................................................3
CHAPTER 2. FOOD SAFETY AND VIETNAM SEAFOOD EXPORT ................5
2.1.
Food safety and policy context .....................................................................5
2.1.1.
Food safety .............................................................................................5
2.1.2.
Hazard Analysis and Critical Control Points (HACCP) .........................5
2.1.3.
European laws .........................................................................................6
2.1.4.
Japan laws ...............................................................................................7
2.2.
Overview of vietnam seafood sector in vietnam ...........................................7
2.3. Evidence of food safety standards (sps agreement and technical barrier) impact
on vietnam exports ...................................................................................................9
CHAPTER 3.LITERATURE REVIEW ...................................................................12
3.1.
Theoretical review of gravity model ...........................................................12
3.2.
Different origin of a product........................................................................13
3.3.
Trade and monopolistic competition ...........................................................13
v
3.4.
Trade and differing factor endowments ......................................................14
3.5.
Trade and differences in production technologies ......................................14
3.6.
Empirical literature ......................................................................................15
CHAPTER 4.RESEARCH METHODOLOGY AND DATA..................................18
4.1.
Data collection .............................................................................................18
4.2.
Methodology ................................................................................................24
4.2.1.
Model specification...............................................................................25
• Theoretical gravity model with importer fixed effects …………………...26
• Theoretical gravity model with time and importer fixed effects…………....26
• Theoretical gravity model with random effects……………………………..26
4.2.2.
Dependent variables ..............................................................................26
4.2.3.
Independent variables ...........................................................................26
• Vietnam’s output of seafood ...................................................................26
• Population ................................................................................................27
• Exchange rate ..........................................................................................27
• Food safety regulations between importing and exporting country........27
• Importing country’s GDP ........................................................................27
• Distance ...................................................................................................28
4.2.4.
Estimation method ................................................................................29
CHAPTER 5. EMPIRICAL RESULTS....................................................................30
5.1.
Results of Breusch-Pagan Lagrange Multiplier test, the Huasman Test, and
checking of Heteroskedasticity. .............................................................................30
5.2.
Gravity model’s estimation result ...............................................................31
5.3.
Trade potential .............................................................................................33
5.3.1.
Vietnam trade potential evaluation .......................................................34
CHAPTER 6. CONCLUSION ..................................................................................36
6.1.
Findings .......................................................................................................36
vi
6.2.
Policy implications ......................................................................................37
6.3.
Limitations and recommendations for future research ................................37
REFERENCES ..........................................................................................................39
LIST OF APPENDICES ...........................................................................................45
vii
LIST OF FIGURES
Figure1.1: Vietnam seafood export (1997-2012)....................................................... 1
Figure 2.1: Total Vietnam aquaculture export (1999-2011) ....................................... 8
Figure 4.1: Average Vietnam seafood export volume (1997-2012) ......................... 18
Figure 4.2: Relationship between Vietnam seafood export and output. .................. 19
Figure 4.3: Relationship between Vietnam seafood export and importing countries’
GDP ........................................................................................................................... 20
Figure 4.4: Relationship between Vietnam seafood export and Japan’s GDP ......... 21
Figure 4.5: Relationship between Vietnam seafood export and USA’s GDP .......... 21
Figure 4.6: Relationship between Vietnam seafood export and EU15’s GDP ......... 22
Figure 4.7: Relationship between Vietnam seafood export and distance ................. 23
LIST OF TABLES
Table 2.1: Violations of seafood hygiene standards by Vietnamese Exports, 2002-2007
..................................................................................................................................... 9
Table 3.1: Summary of Empirical Studies ............................................................... 16
Table 4.1: Descriptive statistics of variable in the model ........................................ 24
Table 4.2: Definition and measurements of all variables in this study ..................... 28
Table 5.1: Estimation results of gravity model (aggregate seafood) ....................... 31
Table 5.2: Trade potential between Vietnam and USA, Japan and EC-15 ............... 34
Table 5.3: Time of convergence .............................................................................. 35
LIST OF APPENDICES
Appendix 1: List of 15 European countries .............................................................. 45
Appendix 2: Regression Results .............................................................................. 46
viii
ABBREVIATIONS
CEPII
Centre d'Etudes Prospectives et d'Informations Internationales
EU
European Union
FAO
Food and Agriculture Organization of the United Nations
FDA
Food and Drug Administration
HACCP
Hazard Analysis and Critical Control Point Certification System
MOIT
Ministry of Industry and Trade
NAVIQAFED
National Fisheries Quality Assurance and Veterinary Directorate
SPS
Sanitary and Phytosanitory Standard
TPP
Trans Pacific Partnership Agreement
TQM
Total Quality Management
VASEP
The Vietnamese Association of Seafood Exporters and Producers
WTO
World Trade Organization
ix
CHAPTER 1. INTRODUCTION
1.1.
Problem statement
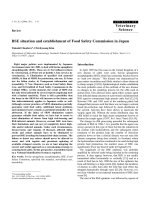
Since 1984 the record of world seafood export has increased remarkably and
achieved USD 102.5 billion in 2010 (FAO, 2012). The top three largest markets have
been EU, Japan and United States. 49 percent of world exportvalue has been from
many developing countries such as Vietnam, China, Africa, etc., (FAO, 2012).
8.538e+08
Japan
U.S.A
export_USD
8e+08
6e+08
4e+08
2e+08
EU-15
0
1995
2000
2005
year
2010
2015
Source: GSO (2015)
Figure 1.1: Vietnam seafood export (1997-2012)
The value of seafood export has recently had a great contribution to Vietnam
GDP, about 4-5%. Its aquatic product export has become one of four major export
products in terms of value. In 2014, export value of seafood was USD 7.84 million,
16.5% higher than 2013 (FAO, 2012). According to Vietnam Association of Seafood
Exporters and Processors (VASEP), in 2014 Vietnam exceeded the target of USD 7
1
million. However, problems of food safety in Vietnam still exist. For instance, (i)
illegal food additives are widely sold; (ii) residue of antibiotics and prohibited
chemicals remain in processed food; (iii) there is less understanding of SPS standards
due to no linkage between government agencies and private firms; (iv) current SPS
legislation is not as equivalent as the international standard. Awareness of seafood
quality and safety has risen tremendously over the last decade. Many countries have
established food-safety-policy agenda and regulatory bodies that monitor the standard
of imported and exported food which producers have to comply (Kim, 2009) .
The new food safety standards such as the Agreement on the Application of
Sanitary and Measures (SPS Agreement), USA Hazard Analysis and Critical Control
Points regulation (1997), EU zero tolerance for residues (2001-2002), Russia, Ukraine
restricted import control (2010-2013), Japan’sstringent uniform limit (0,01ppm
Ethoxyquin, 0,001ppm for Trifluralin in shrimp) in 2010-2013 etc. has become a major
issue for Vietnam in the global market. For example, in order to meet EU zero
tolerance of imported seafood requirement, Vietnam must apply for (i) Good
agriculture practice (GAP), (ii) authorized antibiotics, (iii) analysis competence and
harmonization (Phung, 2015).The strict standard of food safety, sanitary and
environmental standards of EU, Japan, the United States and other countries makes
Vietnam face many difficulties to comply with.If Vietnam continues to produce frozen
seafood regardless of its quality and food safety regulations imposed by importers, it
will lose the market share sooner or later. Especially, Vietnam is preparing to join
Trans Pacific Partnership Agreement (TPP), requirements of sanitary and phytosanitary
standards become higher and higher. Because of 18,000 different kinds of tax cut, TPP
ensures that all of their partners better protect health and food safety through a sciencebased regulation which mirrors U.S food and agriculture safety policy. In addition to
TPP requirements, the more free trade, the more non-tariff methods are applied to
protect local manufacturers, farmers, ranchers in other countries. Therefore, Vietnam
2
should better control its supply chain, upgrade its food safety and quality assurance
systems, learn the best practices from other countries,and have a good development
strategy for seafood field. This paper aims to study the impacts of food safety
regulations on Vietnam seafood export. In particular, it will look at the Vietnam export
situation from 1997 to 2012 to see how the food safety regulations of importing
countries affect the seafood export and how Vietnam can overcome this barrier. The
export markets to be observed are U.S.A, E.U 15 and Japan.
1.2.
Significance of study
The results of this paper might be helpful for Vietnamese Government in
identifying which factors affect Vietnamese seafood export significantly. Based on
this, they can adjust the policy to enhance future export activities. In particular,
exporter companies will enjoy the most benefit of this paper because they can follow
changes in food safety regulations and other determinants.
1.3.
Research objective
This paper aims to investigate the effect of food safety regulations on Vietnam
seafood export with contribution of other aspects including distance, economic size and
exchange rate.
1.4.
Research question
How do food safety regulations affect Vietnam seafood export?
1.5.
Scope of study
Vietnam export seafood to more than 60 countries around the world; however,
the focus of this study will be the United States, Japan, EU-15 due to data limitation.
Despiteof limited size of sample, these countries typically represent the seafood
exports of Vietnam because they are the three biggest markets. The data includes 237
observations of Vietnam seafood export from 1997 to 2012.
1.6.
Structure of thesis
This thesis is divided into six chapters with structure as below:
3
After the first introduction chapter, chapter two will deal with the concept of
food safety and several food safety law imposed by importing countries to see how
seafood export is affected. Also, a brief review of Vietnam seafood export situation is
discussed. Chapter three will present literature review of gravity model. It will start
from the traditional gravity model to the theoretical one with different assumption
ranging from product origin, trade and monopolistic competition, factor endowment to
technologies. Chapter four will describe how gravity model is relevant to this study.
Five hypothesis and testing methods will be mentioned in details in this chapter.
Chapter five presents the empirical results of regression. Based on the empirical
evidence, the effects of food safety regulations, economics size, population, exchange
and distance will be discussed. The trade potential of Vietnam seafood export is also
discussed. Chapter six will conclude main findings from chapter five and provide
policy recommendations. It also draws out limitation of thesis and gives
recommendation for future research.
4
CHAPTER 2. FOOD SAFETY REGULATIONS AND VIETNAM
SEAFOOD EXPORTS
This chapter attempts to define the concept of food safety and present the main
regulations in the United States, Japan and Europe. The overview of Vietnam seafood
sector will be described, especially, several Vietnam violation cases and their effect.
2.1.
Food safety and policy context
2.1.1.
Food safety
Food safety has attracted attention of both consumers and producers and led to
the establishment of new regulation in the last few decades. Consumers considered
food is safe if it is not contaminated with any bacteria or harmful additives. Hartman
(2005) defined it as being free from pesticide residues, growth hormones, antibiotics
and artificial ingredients. This perspective might have negative influence on the food
supply chain. As a result, producers and marketers have faced critical problem of
managing safe food production chain and cost of restoring consumer confidence.
Food safety hazards include biological pathogens such as bacteria, viruses, fungi
and e-coli. They relate to chemical substances such as pesticides, food additives,
antibiotics, heavy metals and cleaners. It can also come from foreign objects in food
such as timber, glass, dirt, dust, bones, etc.
2.1.2. Hazard Analysis & Critical Control Points (HACCP)
Because about 15% of an estimate 76 million case of foodborne illness
occurring every year are related to seafood products (Anders & Caswell, 2006), in
1997, United States set up a preventive system to control biological, chemical and
physical hazards in food from early production stage to end users which call Hazard
Analysis Critical Control Point (HACCP). This is a new approach of controlling
quality of imported seafood. Different from the Quality Circles (1970),Total Quality
5
Management (TQM 1980) and ISO 9000 (1980s), HACCP requires all stakeholders to
take responsibility of seafood quality including farmers, fishers, food processors,
transport operators, distributors, importers and governments (Ababouch et al., 2005).
All the processors who comply with HACCP have to design their quality management
system of the entire food chain to meet five fundamental principles including risk
analysis-assessment, management and communication; traceability; harmonization of
safety and quality standards; equivalence in food safety systems; and ‘risk avoidance or
prevention at source’ (Ababouch et al., 2005). All the imported goods into USA are
controlled by approved antibiotics list in Federal Regulation 21 Food and Drugs, or
antibiotic residues. According to FAO, only six pathogens are permitted, the rest is
banned by default (Le & Pham, 2010)
2.1.3. European laws
European countries have a very comprehensive standards and regulations of
food safety to ensure food is traded properly. They are applied for both domesticand
imported goods. Especially for imported seafood, chloramphenicol and nitrofuran
antibiotics are banned by default. No maximum residue limits (MRL) and/or
acceptable daily intake (ADI) is granted. The minimum required performance limit
(MRPL) is ‘a specified minimum concentration of a detectable residue’ (Nguyen &
Wilson, 2009). In 2002, Commission Decision 2003/181/EC to set out MRPL for
substances in food of animal origins was passed. According to this Decision, for
poultry and aquaculture products, limit of chloramphenicol is 0.3 micrograms/kg and
one of nitrofuran metabolites is 13 micrograms/kg (EC, 2003). In addition, under the
EU Regulation 178/2008 (“General Principles to Guarantee Food Safety for
Consumers) and Regulation 8522004 (“Special Principles for Products Originated from
Animals), all imported goods have to be tested for antibiotics or chemical residues. Ten
antibiotics were banned and another ten antibiotics were put the limitation under EU’
Food Law (Le & Pham, 2010).
6
2.1.4. Japan laws
Similar to USA, too many foodborne illness cases related to seafood product
made Japanese Government more aware of consumer health. In 2003, Japanese
Government passed the Law on Food Sanitation and Safety, Law on Disease Control
and Trade Law. Under these laws, only foods which are totally harmless to users can
be imported. A Commission with many scientific experts was established to evaluate
toxicological residues in food stuff. In 2006, new regulations on using antibiotics in
aquaculture and processing were passed. Fifteen substances are banned and another
sixty one substances are regulated with maximum residue level (Le & Pham, 2010).
2.2.
Overview of seafood sector in Vietnam
Vietnam possesses abundant natural resources including Red River Delta,
Mekong Delta, and the 1650 km coastlines. It has a great potential to develop the
seafood industry. In 2010, Decision No. 332/QD-TT stated the Fisheries Development
Strategy toward 2020 was issued by Prime Minister Nguyen Tan Dung. Its main
content can be summarized as below. By 2020, seafood industry will contribute to 3035% of the agro-forestry-fisheries sectors’ GDP, with a growth rate of 8-10% annually.
Total fisheries output amounts will reach 6.5- 7 MT and aquaculture production will
account for 70-75% of it. Seafood industry will create more than 5 million jobs and the
income will be three times higher than the current one. 40% of labor will be trained
and resident communities along coastlines will be developed with high intensively
spiritual identities. The four major targeted sections will be (1) fishing and fisheries
resources protection, (2) aquaculture, (3) seafood processing and trading, (4)
shipbuilding and fisheries logistic services
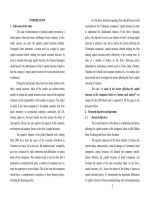
Based on Decision No. 332, seafood industry plays a very important role in
Vietnam economy. According to FAO (2012), the aquaculture products in Vietnam
increases over time (Figure 2.1); however, the amount of seafood export only
accompanies 15% of total production volume. Currently, the seafood sector creates
7
about 5 million jobs for the labor market and about 8 million people earn income from
fisheries sector.
7E+09
6E+09
Unit: USD
5E+09
4E+09
3E+09
2E+09
1E+09
2011
2010
2009
2008
2007
2006
2005
2004
2003
2002
2001
2000
1999
0
Source: FAO (2012)
Figure 2.1: Total Vietnam Aquaculture Export (1999-2011)
Recently there are 534 firms having been licensed to export seafood (VASEP,
2012). Among of them, there are 400 freezing company with a daily capacity of 7,500
tones. Most of these companies are state-owned and joined-stock. A few private
companies has risen recently such as Binh An, Hung Ca, etc. (Dujin, Arie Pieter van,
Beukers, Rik, & Pijl, Wilem van der, 2012).
Vietnam exports seafood to 105 markets around the world including US, EU,
Japan, China, Korea, China, Asean, etc. The three major markets are US, EU, Japan
from which earnings accounts for 70% of total value fisheries export (Phuong & Minh,
2005). The peak of seafood export to US was from 2001-2003 after a bilateral contract
with U.S was signed. After that the exporting amount has dropped due to dumping
dispute (Nguyen, 2004). The export volume to EU and Japan has been fluctuated due
to impact of sanitary and safety standards.
8
2.3.
Evidence of food safety standards (SPS Agreement and technical barrier)
impact on Vietnam exports
Vietnam aquatic product exports have been burdened by SPS Agreement and
other technicaltrade barrier issued by importing countries. Exporters have struggled to
meet up the requirement of imported foods; for example, re-installation the production
line, investing in research and development, inability to catch up with day-to-day
changes of importer’s requirement. Among top three markets in the world, Vietnam
exporters find EU the toughest market due to its strict requirements of food product.
All foods exported to EU have to go through of antibiotic and chemical residues testing
to ensurethey are free of 10 specified antibiotics and residue, because these drugs are
harmful to health and environment. From 2001 to 2003, Vietnam exporters
encountered problems of antibiotics detected in EU due to low technical barriers. After
being discovered to violate the antibiotic residue regulations, 76 shipments were
destroyed at a loss of USD 15 million (Le & Pham, 2010).
Table 2.1: Violations of seafood hygiene standards by Vietnamese Exports,
2002-2007
Market
Japan
United States
Canada
EU
Number of cases by year
2002 2003 2004 2005
49
10
24
46
10
9
15
39
1
0
6
17
18
41
25
29
7
1
15
54
23
16
17
12
49
8
10
32
Contaminant
Antibiotics
Microorganism
Antibiotics
Microorganism
Antibiotics
Microorganism
Antibiotics
Microorganism
2007
94
Sources: NAVIQAFED (2006); MOIT (2008)
Similarly to EU, all Vietnam aquatic product shipments have to be tested
antibiotic residues when importing under FDA’s regulations. Due to repeating
violations, the import and consumption of Vietnamese fish was banned in Alabama,
9
Louisiana and Mississippi. Vietnamese exporters bore a loss of USD 300,000 in 2005
(Duong, 2005)
In Japan market, Vietnamese exporters were warned to stop export seafood if
continuing to violate antibiotic residue regulations as in 2007. Potential loss is USD 1
millions in export revenue if Vietnam aquatic products were banned (Le & Pham,
2010).
Table 2.1 is a number of violation cases in the main market of Vietnam. In
summary, the U.S.A, EU-15 and Japan put strict requirement on the content of
antibiotic and chemical residues of imported food. Among of them, EU-15 is the
toughest market for Vietnam exporters.
Especially, Vietnam is under negotiation of joining Trans-Pacific Partnership
which has a strong effect on Vietnam economy. It will bring Vietnam more and more
opportunities to expand export markets, increase FDI, and ease import restriction
measures imposed by importing countries. Top trading commodities are garment,
footwear, seafood, and agricultural products because they enjoy the most tax reduction.
However, Vietnam also faces many challenges in preparing for participation in TPP
including more competitors, high requirement of SPS and TPT standard etc. Chapter 7
of TPP is designed for Sanitary and Phytosanitary Measure. All TPP partners are
required to apply modern science-based food safety regulation which mirrors U.S food
policy. This aims to create a fair play market for U.S farmers and ranchers and other
TPP partners, and also ensure the most health and safety food (United States Trade
Representative, 2015). In addition to TPP, in 2015 free trade agreements between
Vietnam and Europe are effective. This is a dream market of Vietnam because of 501
million consumers and USD 17,000 billion of GDP. Currently, Vietnam export only
accounts for 0.75% of the bloc’s total import (VCCI, 2015). The elimination of nearly
all tariffs is the key to boost export; however, Vietnam still faces with many barriers.
For instance, seafood must satisfy the Sanitary and Phytosanitary requirements to
10
protect human and animal health. Textile and footwear must prove the origin of
commodities. Wooden products must meet the requirements of Forest Enforcement
Law. Since seafood will be focused on this paper, below are several general conditions
which imported seafood must comply with. (1) Rules on food hygiene and official food
control- Regulation (EC) No 178/2002; (2) rules on residues, pesticides and
contaminants on food; (3) marketing and labeling requirement (“European
Commission : Trade : Export Helpdesk : Sanitary and phytosanitary requirements,”
n.d.). In short, Vietnam should better control its supply chain, upgrade the food safety
and quality assurance systems, learn the best practices from other countries and have a
good development strategy for seafood field in order to match the requirements of
imported countries as well asto boost export.
11
CHAPTER 3. LITERATURE REVIEW
This chapter will provide concept of Gravity Model and different study
approaches to it. It will start from the traditional gravity model to the theoretical one
with different assumption ranging from product origin, trade and monopolistic
competition, factor endowment to technologies.
3.1.
Gravity model:
Based on the law of gravity invented by Isaac Newton in 1687, gravity model in
international economics is developed (Tinbergen, 1962). Trade between country i and
country j is considered as Xij, economics masses are Yiand Yj. Then trade flows can be
expressed as below:
X
A
(3.1)
where Xij is defined as the export volume from country i to country j. Yi, Yj is
interpreted as GDP of each country. Dij is distance between the two countries ‘capital
cities (Keith, 2003). A is a constant. Because of its explanatory power of trade flows,
many scientists have applied this model in their study regardless of its shortage of
theoretical foundation. Tinbergen (1962) first applied this model to study international
trade flows. In the paper “Shaping the World Economy—Suggestions for an
International Economic Policy”, he assumed the GDP of each country and distance has
the elasticity due to unnecessary implication of direct proportionality between
explanatory variables.
(3.2)
Taking the logarithm of equation and adding error term, the linear relationship can be
obtained to interpret coefficients as elasticity as below:
ln(Xij) = lnA +α ln(Yi) + βln(Yj) – γln(Dij) + εij
12
(3.3)
He concluded that the income of trading countries can positively affect the export of
goods and distance can have negative effect on export.
3.2.
Different origin of a product
In 1970s, scientist stated that the classic gravity model lacked of economic
theory foundation. Anderson (1979) first developed a theoretical foundation of gravity
model by Armington assumption where products were differentiated not only by their
kind but also by their place of origin (Armington, 1969). In other words, product
differentiates by its supplier’s residence. In the gravity model, he added kinds of goods,
number of tradable goods and distance to consider all the possible trade flows between
two countries. Therefore, the gravity model does not reflect the absolute construction
of bilateral trade any more. It describes the comparative analysis between two
countries under multiple trade flows. In the model of Anderson (1979) trade is
explained by the economic distance.
3.3.
Trade and monopolistic competition:
Helpman and Krugman (1985) approached an assumption of increasing returns
to scale and monopolistic competition between firms. In their study, they focused on
intra-industry trade. In this study, after doing cross country analysis, they found out
that the share of bilateral intra-industry trade and dispersion of per capita income were
negatively correlated with each other. In another word, when different countries had
similar factor compositions, they tended to share the larger intra-industry trade with
each other than the one who did not have similar ones. The finding of Helpmand and
Krugman confirmed the hypothesis of Lindner (1961) which was countries with similar
factors tended to concentrate on the same industries.
To understand how this idea is linked to gravity model, we look into the study
of Bergstrand (1989). His model considered both factor endowments and constant
elasticity of substitution which referred to Lindner’s assumption. The exporter’s
income changes could be linked with the capital-labor ratio of each country. The
13
importing countries’ income could be linked with consumer’s expenses which reflected
consumer’s taste preference changes. It implied the Helpmand and Krugman model.
Bergstrand (1989) concluded that firms produced differentiated products on the stage
of increasing returns to scale.
3.4.
Trade and differing factor endowments:
Heckscher-Ohlin model describes trade as a result of factor endowments
including labor and capital between two countries. It is assumed that trade countries
differentiate because of different factor endowments. Deardorff (1982) made proof of
the validity of Heckcher-Ohlin theorem; however, in 1998, he refuted it and assumed
model under frictionless trade and trade with impediments to develop a theoretically
founded gravity equation. In his study, he referred to the multilateral terms which is
gravity equation not only takes into account of geographical distance but also
incorporate prices. In this case, gravity equation can be influenced by either elasticity
of substitution or transportation cost. It means that the higher elasticity of substitution,
the more trade among countries which are close to each other. Similarly, a reduction in
transportation costs lead to higher trade between distant countries while close trading
partners lose their proximity advantage
3.5.
Trade and differences in production technologies
Eaton and Kortum (2002) developed a Ricardian model with approach of
production technology differences. They consider the absolute advantage which is state
of technology, comparative advantage which is heterogeneity technology and
geographical barrier.
In this case, labor factor was assumed to not mobile
internationally. People tended to purchase the worldwide cheapest good and
maximized a constant elasticity of substitution function. In his model, price reflects the
comparative advantage, cost of production and transportation cost.
In short, theoretical gravity model is not accredited to one theory. It’s
approached by multiple assumptions. Whereas Anderson (1979) explained trade
14
differences due to economic distance, Deardorff (1998) and Eaton and Kortum (2002)
accounted for price levels due to a CES preference. Recently, motivated by border
puzzle, Anderson and van Wincoop (2003) continue to study gravity model with
multilateral resistance terms(Anderson & van Wincoop, 2003).
3.6.
Empirical Literature
Because gravity model is the most common tool of analyzing trade, many
empirical studies has been conducted to measure the effect of food safety standards.
Otsuki, Wilson, & Sewadeh(2001)studied therelationship between agricultural exports
and EU standards. Using data of 15 EU countries and 31 importing countries from
1989 to 1998 and applying gravity model with fixed effects, they found thatagricultural
export was negatively affected by EU standard. Disdier, Fontagné, & Mimouni
(2008)used cross-sectional data in 2004 to examine the effect of sanitary and
phytosanitary (SPS) and technical barriers to trade (TBT) on agricultural trade. Result
showed that SPS and TBT standard was negative on trading commodity, especially
from developing countries.With the same view of food safety regulation issue on
seafood trade, Nguyen and Wilson (2009) examined whether foodsafety regulations
weighed export down. Estimating gravity model with fixed effects and using data of 75
exporting countries and 17 importing countries from 1992 to 2005, they made a
conclusion that food safety regulation in the US, EU and Japan resulted in the negative
effects on the world trade flow of seafood.The study also showed that different
regulations had different effects on different products and varied over time.
Furthermore, Anders and Caswell (2009) investigated the effects of HACCP on
seafood import of top 33 countries and concluded that mandatory HACCP made the
value of import seafood drop about 0.05%. These results supported the argument of
food safety regulations’ standard hindering international trade. In addition, regression
results also presented that effects of HACCP varied from one country to another due to
15
its different development status. Developed countries less suffered from food safety
regulations than developing countries. Nevertheless, after analyzing trade in the
individual country level, they found thatHACCP effects were positive to large seafood
exporters and negative to small ones regardless of its development status. Its findings
supported the view that technical issue was not only barriers but also catalysts. As long
as exporters could enhance their food safety and quality systems, they could generate
more sales. Summary of these empirical studies is presented in Table 3.1. De Frahan
and Vancauteren (2006) applied gravity model to measure theeffect of harmonization
of EU food regulations on intra – EU in the period 1990 – 2001. They concluded that
stricter EU harmonization of food safety regulations has positive effect on intra-EU
trade. In common, most of researchers used data of a pair of exporting and importing
countries to study the effects of food safety standard. In this paper, the data will be a
little bit different. Vietnam is the only one exporting country and importing countries
will be variable. The results of regresion might be different from other papers.
On the other hand, there were several papers studying the impacts of food safety
standards on food export. Mangelsdorf et al. (2012) came up with result which was
standard having positive impacts on export performance because it signaled to
customers that products had reached certain quality standard. Not only mandatory
standard, but also voluntary standard was used in this paper. This was a different point
from other paper. Morevover, researchers did not apply gravity model in this paper, but
used Heckman two-steps and threshold Tobit to measure the effects. Interesting results
was that export performance experienced a positive effect from food safety standard.
Inspired by these empirical studies, this paper will employ gravity model to
study the effect of food safety regulations on Vietnam seafood export.
Table 3.1: Summary of Empirical Studies
Empirical
Methodology
Studies
16
Results