Chapter 14 Assessing the SMEs’ Competitive Strategies on the Impact of Environmental Factors: A Quantitative SWOT Analysis Application
Bạn đang xem bản rút gọn của tài liệu. Xem và tải ngay bản đầy đủ của tài liệu tại đây (272.7 KB, 13 trang )
14
Assessing the SMEs’ Competitive Strategies
on the Impact of Environmental Factors:
A Quantitative SWOT Analysis Application
Hui-Lin Hai
Department of Information Management, Shih Chien University, Kaohsiung Campus
Taiwan, R.O.C.
1. Introduction
In today’s highly competitive environment, strategic management has been widely used by
all enterprises to withstand fierce competition. Environmental management has quickly
emerged as an essential strategic factor in many industries. Environmental considerations
are clearly becoming increasingly important and will be considered as one of the key factors
in most companies’ success stories. For example, recently there are many firms in Asia that
had already received ISO 14001 certification and adopted these Environmental Management
Systems (EMS) standards as their state policy. No doubt that many firms have recognized
the compatibility between environmental performance and profitability, as it witnessed by
increasing interest in recycling programs and green marketing, in part due to realizing that
the futility of running from such pressures.
Melnyk et al. (2003) apply a survey of North American managers to demonstrate that firms
having gone through EMS certification experience a greater impact on performance than do
firms that have not certified their EMS. Pan (2003) applies questionnaires to the
organizations within Taiwan, Japan, Hong Kong and Korea on regards of ISO9000 and
ISO14000 issues. He uses statistical analysis results of the survey data to gain eight common
points for ISO9000 and ISO14000 certified firm within these four countries. Tan et al. (2003)
develop an e-commerce structure for sorting, selecting and utilizing information for the
effect of ISO9000 system. The related studies of environmental issues will be listed in
Environment Management (Ahsen and Funck, 2001; Rao et al., 2006; Gernuks et al., 2007),
Environmental Management Accounting (Jasch, 2003), ISO14001 Certification (Fryxell and
Szteo, 2002; Mbohwa and Fukada, 2002; Rennings et al., 2006) and Life Cycle Assessment for
EMS (Zobel, 2002).
In a country’s endeavor to implement EMS in both manufacturing and service sectors, the
significance of Small and Medium Enterprises (SMEs) deserves special attention. In Taiwan,
a SME is set under either two conditions. First, it is defined by the number of employees that
they often refer to those with less than 200 employees involved in manufacturing, building
and mining industries. Second, it is defined by its capital volume that is less than 80 million
Taiwan dollars. The SMEs are typically much smaller in operation compared to the global
and multinational enterprises, whereas most of the SEMs in Taiwan are positioned in the
ending-role of the supply chain. Most EMSs in Taiwanese SMEs are implemented in
www.intechopen.com
286
Environmental Management in Practice
accordance to specification in ISO 14001 or QC080000 standards, in which contain
requirements that have to be fulfilled before third-party certification and /or registration
can be achieved.
Strength, Weakness, Opportunity and Threat (SWOT) analysis is an important support tool
for decision-making, and is commonly used as a means to systematically analyze an
organization’s internal management capability and its external environment. The purpose of
the analysis on internal strengths and weaknesses is to assess how an enterprise carries out
its internal work, such as R&D, day to day business operation, etc. On the other hand, the
purpose of the analysis on the external opportunities and threats is to assess whether or not
an enterprise can seize opportunities and avoid threats, whilst facing an uncontrollable
external environment, such as fluctuating prices, political destabilization, etc. SWOT
analysis has been successfully applied in EMS fields, such as the environmental impact
assessment in India (Paliwal, 2006), the development of an environmental management
system (Lozano and Vallés, 2007) and regional energy planning for renewable development
(Terrados et al., 2007).
For a quantitative SWOT, Kuttila et al. (2000) develop a hybrid method, the Analysis
Hierarchy Process (AHP) in the SWOT analysis, to eliminate the weakness in the
measurement and evaluation steps of the SWOT analysis. Examples in literature of studies
that follow the method of Kuttila et al. include those by Kajanus et al. (2004), Leskinen et al.
(2006) and Chang and Huang (2006). Yüksel and Dağdeviren (2007) demonstrate a process
for quantitative SWOT analysis that can be performed even when there is dependence
among strategic factors. They use the Analytic Network Process (ANP) that allows
measurement of the dependency among the strategic factors as well as its AHP, which is
based on independence between the factors. ANP is a more general form of its predecessor,
the AHP, for ranking alternatives based on some set of criteria. Unlike AHP however, ANP
is capable of handling feedbacks and interdependencies, which exist, in complex systems
like a manufacturing system. ANP problem formulation starts by modeling the problem that
depicts the dependence and influences of the factors involved to the goal or higher-level
performance objectives. Dependence among the SWOT factors is observed to effect the
strategic and sub-factor weights, as well as to change the strategy priorities. Dyson (2004)
provides an SWOT and TOWS analysis to create strategy formation and its incorporation
into the strategic development process at University of Warwick by scoring SWOT factors.
A variation of SWOT analysis is the TOWS matrix. In the TOWS matrix the various factors
are identified and these are then paired e.g. an opportunity with a strength, with the
intention of stimulating a new strategic initiatives (Table 1).
A “top-down” way of thinking could be used to guide the formulation of decision
hierarchy. In this paper, a new quantitative SWOT analysis is provided that allows
measurement of the strategic factors as well as its vote-ranking method. The first task is to
invite eighteen certificated ISO9000 and ISO14000 auditors (or lead auditors) to organize a
“Task Force (TF)”. The TF will discuss SWOT of Taiwanese SMEs within their EMS issues
and assess the competitive strategies. The second task is to apply the internal competitive
strengths to find external market opportunities. As a result, the strategy combination for
max {strengths, opportunities} and min {weaknesses, threats} will be provided. The third
task is to regard these SWOT indexes and their sub-criteria as the candidates voted by the
task force. In conclusion, the different results of ranking will expose different weights
among the votes of the candidates.
This paper discusses the environmental issues of the SMEs not only by drawing insights
from research conducted in different countries, but also look into the use of environmental
www.intechopen.com
Assessing the SMEs’ Competitive Strategies on the Impact
of Environmental Factors:A Quantitative SWOT Analysis Application
287
factors of SWOT through their development, their context and adaptability to enhance the
environment performance of SMEs. As for the medium, the vote-ranking method will be
used to rank the different competitive strategies and priorities. This specific method
provides a new quantitative SWOT methodology that will be extended to decision-making
issues. The rest of this paper is organized as follows: Section 2 illustrates the vote-ranking
method and the conceptual approach. Section 3 discloses the use of vote-ranking method to
provide a quantitative SWOT method for assessing the SMEs’ competitive strategies in EMS
by six-step procedure. Section 4 discusses the results of different strategies and suggestions.
Section 5 highlights some conclusions and offers directions for further researches.
2. Vote-ranking methodology
Data Envelopment Analysis (DEA) is an analytical procedure developed by Charnes et al.
(1978) for measuring the relative efficiency of decision-making units (DMUs) that perform
the same types of functions and have identical goals and objectives. The weights used for
each DMU are those which maximize the ratio between the weighted output and weighted
input. DEA is a mathematical programming technique that calculates the relative efficiencies
of multiple DMUs, based on multiple inputs and outputs. A well-known method for
ranking candidates in a ranked voting system is to compare the weighted sum of their votes
after determining suitable weights. Cook and Kress (1990, 1992) present an approach to the
problem of ranking candidates in a preferential election. They consider an alternative
method which does not specify the sequence of weights by applying DEA. One would
imagine that any reasonable person, voter, candidate or poll manager would agree that the
first place votes should weigh at least as much as second place votes, and so on. They
provide the following DEA model to obtain the total score for each candidate:
Zrr max urs xrs
S
s 1
S
s.t.
Zrq urs xqs 1, q 1, 2,..., R ;
s 1
urs ur ( s 1) d s , , s 1, 2,..., S 1;
(1)
urS d s , .
Where,
s: the number of places, s =1, … , S.
r: the number of candidates, r =1, … , R.
urs: the weights of the sth place with respect to the rth candidate.
xrs: the total votes of the rth candidate for the sth place.
d(s, ε): the given difference in weights between sth place with (s+1)th place; d(., ε), called the
discrimination intensity function, is nonnegative and non-decreasing in ε. Parameter ε is
nonnegative.
The Cook and Kress’s ranked voting model (1) is assumed that in a voting system, each
voter selects R candidates and ranks them from the 1st to the Sth places, S≤ R. The d(s, ε) is
to ensure that first place votes are valued at least as highly as second place votes which are
valued at least as highly as third place votes etc. The Zrq is the cross-efficiency which can be
thought of here as candidate r’s evaluation of candidate q’s desirability. The constraints Zrq
www.intechopen.com
288
Environmental Management in Practice
are the usual DEA constraints i.e. that no candidate q should have a desirability greater than
1 under r’s weights. The Zrr has been used in the objective function to emphasize the
candidate r’s evaluation of his/her own desirability. The rth candidate wishes to be
assigned the weight urs so as to maximize the weighted sum of votes to candidate r, that is
when the score Zrr becomes the largest. Notionally, each candidate was permitted to choose
the most favorable weights to be applied to his/her standings in the normal DEA manner,
with the additional ‘assurance region’ restriction, in which the weight for a sth place vote
should be greater than the one for a (s+1)th place vote by some amount. Hashimoto and
Ishikawa (1993) consider the candidates in ranked voting systems as the DMUs in DEA, and
each is considered to have many outputs and only one input with unity. He also deems that
it is fair to evaluate each candidate in terms of the weights optimal to himself/ herself.
Green et al. (1996) further develop this model by setting certain constraints to the weights.
They point out that the form of d(s, ε) affects the ranking results and does not allow DMUs
to choose their own weights unreservedly. Therefore, they present an alternative procedure
that involved using each candidate’s rating of him/herself along with each candidate’s
rating of all the other candidates. They utilize the cross-efficiency model to DEA to obtain
the best candidate. On the other hand, Hashimoto (1997) proposes a method to determine a
total ordering of candidates specifying nothing arbitrary, but only assuming the condition of
decreasing and convex sequence of weights. They incorporate the condition of decreasing
and convex sequence of weights into DEA as the assurance region. Green et al. and
Hashimoto proposes these methods, whereabouts the existence of low preference candidates
may change the ranks and DEA exclusion model, which seems to be unstable with respect to
the inefficient candidates. Obata and Ishii (2003) consider that, the instability is caused by
the fact mentioned above and that the inefficient candidates should not be used to
discriminate efficient candidates. They also use this information only on efficient candidate
while discriminating and realizing that the order of efficient candidates never changes even
though the inefficient candidates are added or removed. Foroughi and Tamiz (2005)
simplify the model of Obata and Ishii and extend it to rank the inefficient candidates as well
as the efficient one.
Noguchi et al. (2002) revise the application of Green’s method and show that different
weights among objects gave rise to different ranking results. If one wants to set particular
constraints to a weight can be employed, which is characterized by the following
constraints: (a) ur1 2 ur23 ur3 … S urS , (b) urs 1/[(1+2+…+S)*n] =2/(n* S(S+1)), where n
is the number of voters. In this multiple criteria case, the vote-ranking model is defined as
follows:
Zrr max urs xrs
S
s 1
S
s.t.
Zrq urs xqs 1
s1
surs (s 1)ur ( s 1) ,
q 1, 2,..., R ;
s 1,...,(S 1);
1
2
.
urS
1 2 ... S n n * S 1 S
Where, these variables are the identical as model (1).
www.intechopen.com
(2)
Assessing the SMEs’ Competitive Strategies on the Impact
of Environmental Factors:A Quantitative SWOT Analysis Application
289
As for ranking of alternatives, one of the most popular methods compares the weighted sum
of votes after determining suitable weights for each alternative. The different weights
among objects resulted in different ranking results and propose a new method of ordering
in order to solve the problem of weights ranking. As a final point, the module solver
imbedded in EXCEL of Microsoft Office [2003] will be applied to solve the above linear
programming problems (Liu and Hai, 2005).
3. The competitive strategies of the Taiwanese SMEs for EMS
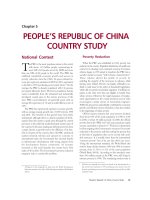
This study proposes six-step procedure for selecting the competitive strategies of the
Taiwanese SMEs. They are obtained from TF which will fall into four subjective criteria that
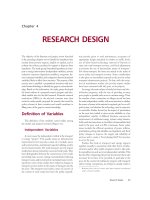
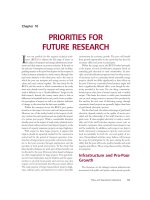
discuss and analyze SWOT of Taiwan’s SMEs in the EMS. The first step is structuring the
problem into a SWOT hierarchy. On the top level is the overall goal of selection competitive
strategies. On the second level are the four SWOT criteria that contribute to the overall goal.
The criteria (sub-criteria) for strengths (S1, S2, S3), opportunities (O1, O2, O3), weaknesses
(W1, W2, W3) and threats (T1, T2, T3) are individually presented into Level 2 and 3. On the
second level is that four criteria are decomposed into twelve sub-criteria under SWOT;
additionally on the bottom (or fourth) level, there are five alternative competitive strategies
that are to be evaluated in terms of the sub-criteria listed on the third level. These
competitive strategies (OS-1, OS-2, OW-1, TS-1 and TW-1) are assessed in Level 4 and
illustrated in Fig.1.
Strategies Selection
Level-1
Level-2
Level-3
Strengths
Weaknesses
Opportunities
Threats
S1, S2, S3
W1, W2, W3
O1, O2, O3
T1, T2, T3
Level-4
The competitive strategies: OS-1, OS-2, OW-1, TS-1, TW-1
Fig. 1. A SWOT hierarchy for selecting the competitive strategies
3.1 Step 1: SWOT analysis
First of all, the author invites the eighteen certificated ISO9000 or ISO14000 auditors (or lead
auditors), consists of 14 part-time and 4 full-time auditors, to organize a TF in this particular
study. They are first briefed about the overall objective of the study, then specifically on the
SWOT and vote-ranking methodologies. The questionnaires are used for interviewing
purposes; however they mainly use a board or group decision method to determine the
criteria and sub-criteria for selecting the competitive strategies. The study is to apply the
internal competitive strengths to find external market opportunities. This is followed by the
analysis on the organization’s external competitive environment and internal operating
environment. Consequently, the internal analysis is followed by the selection and
www.intechopen.com
290
Environmental Management in Practice
implementation of strategies. Due to highly global nature of the “Green House”, the
requirements of EMS are also applicable for other countries in the European Union. For
selecting the competitive strategies of SMEs for EMS, the TF has been mainly on the
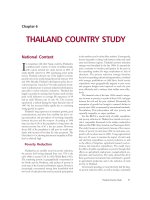
discussion of the SWOT method and problem defining after a series of revision. The strategy
combination of EMS for max {strengths, opportunities} and min {weaknesses, threats}, OS-1,
OS-2, OW-1, TS-1 and TW-1, is provided in Table 1.
Weaknesses:
-W1: SMEs respond slowly and
difficultly for external customer
requirements
-W2: Some suppliers or
manufacturers are unwilling to
face higher environmental
regulation required and seek other
markets with lower quality
consciousness
-W3: The government’s
regulations of environmental
protection are too loose
Maxi-maxi (O-S) Strategies
Maxi-mini (O-W) Strategies
OS-1: Extend EMS Certification
OW-1:Change directly in
effects to create high value-added manufacture preferences to create
products of high environmental
markets
OS-2: Involve in improving
requirement standard
environment issues and promote
company image and profits
Strengths:
+S1: Capability to execute and
develop EMS certification
+S2: Synergy with commerce,
environmental protection and
education units
+S3: Possessing high level of
environmental education
Opportunities:
+O1: Change in customers’
preferences (increase in market
demand for EMS or QMS
certification)
+O2: Increase value-added of
product
+O3: Improvement in Green
House and in environment
Threats:
Mini-maxi (T-S) Strategies
Mini-mini (T-W) Strategies
-T1: Diminishing specific market TS-1: Increase strictly government TW-1: Government impel
or industry environmental regular environmental education and
demand and profitability
-T2: Government or industry
assistance for SMEs
restrictive practices
-T3: Negative corporation image if
EMS certification is abandoned
Table 1. SWOT and TOWS matrixes for EMS
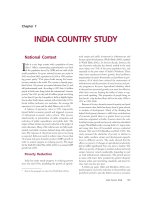
3.2 Step 2: priority votes of criteria and sub- criteria in SWOT
The second task is to regard these SWOT indexes as candidates that are voted by TF. The
four criteria are the strength, weakness, opportunity and threat indexes and the twelve subcriteria are S1-3, W1-3, O1-3 and T1-3 alternatively, within the SWOT. They are regarded as
the selected items and expected to receive votes with respect to the related elements within
the model, as shown in Table 1.
The TF illustrate the order for the four criteria and the votes for each which are shown in
Table 2. Every members will vote from 1 to S, (SR), where R is the number of criteria or
sub-criteria. They are regarded as candidates whom are to be voted by different places.
Afterward, TF will list its priority votes of sub-criteria in fixed first criterion within Table 3.
They were only asked to determine the order of the criteria or sub-criteria, however not the
weight of each criterion or sub-criterion.
www.intechopen.com
Assessing the SMEs’ Competitive Strategies on the Impact
of Environmental Factors:A Quantitative SWOT Analysis Application
Criteria
Strengths
Opportunities
Weaknesses
Threats
291
1st
4
7
2
2nd
8
4
0
3rd
4
7
7
4th
2
0
9
Weights
0.264
0.299
0.174
5
6
0
7
0.263
* The weights are normalized and totally equal to one.
Table 2. Priority votes of four criteria
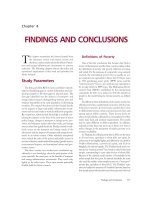
3.3 Step 3: calculate the weights of criteria and sub- criteria in SWOT
The votes on Table 2 are used to calculate the weights of the four criteria by model (2), R=4,
1
S=4, n=18 and the lowest weights of the fourth place are
(ur4 2/ [n*S(S+1)] =2/ [18*4(5)
180
=0.0056]). The weights for strength, weakness, opportunity and threat at the second level are
0.884, 1.000, 0.581 and 0.882, respectively. After normalizing these data, the weights of
outcome are 0.264, 0.299, 0.174 and 0.263, as it is illustrated in column 6 of Table 2, respectively.
For “Strengths” in the Table 3, there are variables R=3, S=3, n=18 and the lowest weights of the
third place are 1/108 (ur3 2/ [n*S(S+1)] =2/ [18*3(4) =0.0093]). Similarly, the votes within
Table 3 are using the same procedure in order to determine the weights of the sub-criteria. The
results of the weight of sub-criteria are listed in columns 5 and 10 of Table 3.
Criteria
Strengths
S1
S2
S3
Total
Weaknesses
W1
W2
W3
Total
Votes
Weights
1st 2nd 3rd
Votes
Weights
1st 2nd 3rd
13
0
5
18
4
9
5
18
1
9
8
18
0.465
0.227
0.308
11
3
4
18
7
3
8
18
0
12
6
18
0.439
0.258
0.303
Opportunities
O1
O2
O3
Total
Threats
T1
T2
T3
Total
15
0
3
18
2
15
1
18
1
3
14
18
0.495
0.258
0.247
5
5
8
18
5
9
4
18
8
4
6
18
0.304
0.336
0.360
* The weights are normalized and totally equal to one.
Table 3. Priority votes and weights of twelve sub-criteria
3.4 Step 4: scores of competitive strategies in SWOT
The competitive strategies, OS-1, OS-2, OW-1, TS-1 and TW-1 are subjective indices that
could be translated into numerical ratings using different methods, such as questionnaire,
AHP or vote-ranking and so much more. TF may ask their colleagues to answer these
questionnaires in order to rate the competitive strategies of sub-criteria of each SWOT. A
major problem was thus, to ensure the consistency between managers and to avoid any bias
creeping in. A set of standard guidelines was placed after discussions with the TF (voters). It
is mainly agreed that all performance scores would be based on a nine points grade scale.
www.intechopen.com
292
Environmental Management in Practice
Each grade would have an adjective descriptor and an associated point score or range of
point scores. The TF makes their judgment on the qualitative scale of adjectival descriptors.
Table 4 lists the example for rating the strength and opportunity indices, where the lower and
upper scores are predetermined from 1-9. The strength and opportunity indices should be
maximized, the least-favorable candidate is assigned the smallest value and the most-favorable
candidate is assigned the largest value. On the other hand, the weakness and threat indices
need to be minimized, where the least-favorable candidate is assigned the largest value and
the most-favorable candidate is assigned the smallest value. The overcoming range of
subjective indices is set between 1 and 9 illustrated in Table 5. Therefore, each of the
competitive strategy can be awarded a ‘score’ from 1 to 9 on each sub-criterion.
Scores Rules
Greatly conforming to market and sub-criteria of requirement, successful
9
probability more than 90%
Better conforming to market and sub-criteria of requirement, successful probability
7
about 70%
Conforming to market and sub-criteria of requirement, successful probability about
5
50%
Slightly conforming to market and sub-criteria of requirement, successful
3
probability about 30%
Not conforming to market and sub-criteria of requirement, successful probability
1
about 10%
Table 4. Grading different strategy scores in strength and opportunity indexes
Scores
9
7
5
3
1
Rules
Greatly overcoming sub-criteria requirement, successful probability more than
90%
Better overcoming sub-criteria requirement, successful probability about 70%
Exactly overcoming sub-criteria requirement, successful probability about 50%
Slightly overcoming sub-criteria requirement, successful probability about 30%
Not overcoming sub-criteria requirement, successful probability about 10%
Table 5. Grading different strategy scores in weakness and threat indexes
The five competitive strategies, OS-1, OS-2, OW-1, TS-1 and TW-1, by means of the highest
rating were regarded as the best competitive strategies, with the rest being ranked
accordingly. The competitive strategies will earn the average scores of questionnaires within
Table 4 and Table 5 by TF. The average of collected scores is listed in the columns 5-9 of
Table 6.
3.5 Step 5: total weighted scores of competitive strategies
This step requires the TF to assess the performance of all the competitive strategies within the
twelve sub-criteria of SWOT identified as important for competitive strategies rating. Simple
score sheets were provided to assist the manager to record the scores for each strategy on each
of the twelve sub-criteria. An example of this strategy is shown in Table 6. In the first row of
Table 6, the number 0.123 is equal to the product of the “Strength” criterion score 0.264
multiply with the S1 given value of “0.465”. Moreover, the same method is applied to obtain
www.intechopen.com
Assessing the SMEs’ Competitive Strategies on the Impact
of Environmental Factors:A Quantitative SWOT Analysis Application
293
other results. Once the weights for sub-criteria have been determined, it is relatively easy to
calculate the resulting competitive strategies rating scores.
Mathematically, the rating is equivalent to the sum of the product of each sub-criterion
weight and the competitive strategy performance score. The rating value of competitive
strategies is obtained by summing the products of the respective elements. The competitive
strategies rating value for strategy OS-1 is obtained by summing up the products of the
respective elements in columns 4 and 5 for each row; given in the final column 10, the over
all total weighted scores of the row is “6.859”. The rating method used in strategy OS-1, can
be used to find the total scores of the other four strategies stated in columns 11-14 of Table 6.
The rating value for each competitive strategy is obtained by summing the products of the
respective elements in the matrix; given in the final score, the values of over all competitive
strategies of OS-1, OS-2, OW-1, TS-1 and TW-1 respectively is, 6.859, 8.357, 7.532, 7.298 and 8.274
stated within the last row of Table 6. This gave a rating score for each competitive strategy,
whereas the higher the rating, the better the overall performance for competitive strategy.
3.6 Step 6: assessment of competitive strategies
In the last row of Table 6, the rating value for each strategy is obtained; the final score and
the ranking of competitive strategies for OS-2, TW-1, OW-1, TS-1 and OS-1 is first, second,
third, fourth and fifth respectively. Even though the score of OS-2 is only higher by 0.083
than TW-1 and the score of OW-1 is higher by 0.234 than TS-1, however for both of the
competitive strategies, the difference of scores will definitely change the overall final rank.
These results will be regarded as sensitivity analysis for five competitive strategies.
Criteria
(A)
Strengths
0.264
Grade Strategies Scores
Weighted Strategies Scores
Sub-criteria Weights
(B)
(C= A×B) OS-1 OS-2 OW-1 TS-1 TW-1 OS-1 OS-2 OW-1 TS-1 TW-1
6.833 8.889 8.056 6.944 8.722 0.839 1.091 0.989 0.853 1.071
S1 0.465
0.123
0.060
6.944 8.944 7.611 7.278 8.500 0.416 0.536 0.456 0.436 0.509
S2 0.227
0.081
7.056 8.833 7.556 8.611 8.611 0.574 0.718 0.614 0.700 0.700
S3 0.308
Opportunities O1 0.495
0.299
O2 0.258
O3 0.247
0.148
0.077
0.074
6.833 7.778 7.389 7.278 8.167 1.011 1.151 1.094 1.077 1.209
6.944 8.000 7.611 7.389 8.000 0.536 0.617 0.587 0.570 0.617
6.778 8.111 7.778 7.500 7.944 0.501 0.599 0.574 0.554 0.587
W1 0.439
W2 0.258
W3 0.303
0.076
0.045
0.053
6.611 7.778 7.222 6.944 7.833 0.505 0.594 0.552 0.530 0.598
6.500 7.833 7.278 7.056 7.778 0.292 0.352 0.327 0.317 0.349
6.667 7.944 7.500 7.278 7.722 0.351 0.419 0.395 0.384 0.407
Weaknesses
0.174
0.080
T1 0.304
0.088
T2 0.336
0.095
T3 0.360
Total Weighted Scores
Threats
0.263
7.056 8.611 7.278 7.000 8.444 0.564 0.688
7.111 8.722 7.556 7.167 8.389 0.628 0.771
6.778 8.667 7.333 7.222 8.556 0.642 0.821
6.859 8.357
0.582
0.668
0.694
7.532
0.560
0.633
0.684
7.298
0.675
0.741
0.810
8.274
Table 6. The SWOT analysis of different strategies
4. Discussion
First of all, considering that the strategy OS-1 has the lowest score within the strategy
analysis, most of the SMEs supposed that this strategy is quite acceptable even though there
www.intechopen.com
294
Environmental Management in Practice
are still have some doubts present, especially on whether or not by obtaining the EMS
related international standard authentication, such as ISO14000, it will certainly create a
high value-added market. From a present market condition which is quite unfeasible to
reflect the practical demand, frequently as a final result it is invested in fund or
modification. Even though most of the customers are quite optimistic and agreed to this way
of doing, however when everything is fully involved within EMS in the future, it will
certainly has some affect on its capital or product selling price. Which means that at the
present moment, the demand on this particular product is lacking, furthermore, it might
resulted in the incapability to agree on these certain analysis by some SMEs.
Moreover, from the strategy analysis OW-1and TS-1 point of view, direct changes in
manufacture preferences to create products of high environmental requirement standard
has a bigger risk toward the SMEs in term of direct investment. Generally, average
companies do not have certain investment planning until it has reached a deal, order
placement or customer’s promise in advance. Additionally, an increasingly strict
government or industry environmental in carrying out this phase is facing difficulty, where
presently the government mostly is using counseling method or fund assistance to
encourage and urge the industry to increase its EMS ability in order to reach the low price
product strategy and high level of product diversification.
Lastly, the strategy OS-2 imposes a similar way of thinking with strategy TW-1. Taiwanese
SMEs apperceive the significance of EMS and also recognize the importance to survive
within the diversified competing market environment, whereas they need to build up its
environmental management that has to suit the EMS specification and attention. However,
the investment within environmental protection for its resources and facilities requires a
great amount of expenditures. Under this major investment, if the expected outcomes are
unpredictable, therefore the willingness on investing within the environmental management
will suffer an enormous drawback. These SMEs certainly would hope that government will
work together with country resources, providing some assistance in procuring EMS needed
facilities and equipments or even any related training within the environmental
management scope, moreover guidance or counselling in obtaining different kinds of ISO
authentic certificate will also be valuable resource.
Obviously, most people are familiar with the conflicts between environmental protection
and economic development. Those who are convinced of the consequences of global
warming will remain convinced, while those suspicious will remain suspicious. After all,
economic development means bread, while the mankind cannot immediately appreciate the
deep implications of its damage to the great nature. Therefore, politicians should be aware
of the environmental implications of legal provisions and regulations. Likewise, the
industry authorities, when developing new products, should consider the intangible social
cost of pollution as a part of the overall cost and deal with the issue of pollution as a part of
life cycle management, so that such considerations and practices will benefit our earth. In
EMS, this will further our understanding of the potential poisonous substances to be
produced in production, deployment and replacement stages, and will help us minimize
pollution and thus contribute to environmental protection.
5. Conclusions
With the continuing development of human civilization and technology, the life cycle of any
products, from production, consumption to final waste, it is involving more and more
external adverse factors which bring about direct or indirect impact on the environment.
www.intechopen.com
Assessing the SMEs’ Competitive Strategies on the Impact
of Environmental Factors:A Quantitative SWOT Analysis Application
295
Economists said that we should stop aggravation of global warming now; and there is only
one earth; therefore, be environmentally friendly.
Lastly, the competitive strategies OS-2 and TW-1 will be provided to Taiwanese SME
department and industry union. The main contributions of this study are as follows:
1. The selection procedure of competitive strategies in SWOT can assist the audience to
think in a very comprehensive and detailed manner, while allowing them to categorize
various issues.
2. In this field, many researchers have sought to improve the different capabilities of
quantitative SWOT, such as AHP, ANP or fully rank decision-making units. In this case,
the vote-ranking methodology incorporated with SWOT is applied and as a result, it
became the easiest and most convenient method compared to others.
The vote-ranking is presented as an approach to the problem of ranking candidates in a
preferential election. The future researches had suggested that the cross-evaluation method
is better off to be applied to assess candidates through peer-group, whereas one can attain a
more balanced view of the weight-setting. The cross evaluation can be used to overcome the
problem of maverick decision-makers. The proposed methodology can be utilized to issues
of SWOT, such as AHP or ANP within this study.
6. References
Ahsen, A.V. ; Funck, D. (2001). Integrated management systems - opportunities and risks for
corporate environmental protection. Corporate Environmental Strategy 8(2), pp. 165176.
Chang, H.H. ; Huang, W.C. (2006). Application of a quantification SWOT analytical method.
Mathematical and Computer Modelling 43, pp. 158-169.
Charnes, A. ; Cooper, W.W. & Rhodes, E. (1978). Measuring the efficiency of decisionmaking units. European Journal of Operational Research 2, pp. 429-444.
Cook, W.D. ; Kress, M. (1990). A data envelopment model for aggregating preference
rankings. Management Science 36(11), pp. 1302-1310.
Cook, W.D. ; Kress, M. (1992). Ordinal information and preference structure: decision models and
applications. Prentice Hall, New Jersey.
Dyson, R.G. (2004). Strategic development and SWOT analysis at University of Warwick.
European Journal of Operational Research 152, pp. 631-640.
Foroughi, A.A. & Tamiz, T. (2005). An effective total ranking model for a ranked voting
system. OMEGA 33, pp. 491-496.
Fryxell, G.E. & Szteo, A. (2002). The influence of motivations for seeking ISO 14001
certification an empirical study of ISO 14001 certified facilities in Hong Kong.
Journal of Environmental Management 65, pp. 223-238.
Gernuks, M. ; Buchgeister, J. & Schebek, L. (2007). Assessment of environmental aspects and
determination of environmental targets within environmental management
systems (EMS) – development of a procedure for Volkswagen. Journal of Cleaner
Production 15, pp. 1063-1075.
Green, R.H. ; Doyle, J.R. & Cook, W.D. (1996). Preference voting and project ranking using
DEA and cross-evaluation. European Journal of Operational Research 90, pp. 461-472.
Hashimoto, A. (1997). A ranked voting system using a DEA/ AR exclusion model: a note.
Journal of the Operational Research 97, 600-604.
Hashimoto, A. & Ishikawa,H. (1993). Using DEA to evaluate the state of society as measured
by multiple social indicators. Socio-Economic Planning Sciences 27(4), pp. 257-268.
www.intechopen.com
296
Environmental Management in Practice
Jasch, C. (2003). The use of environment management accounting (EMA) for identifying
environmental costs. Journal of Cleaner Production 11, pp. 667-676.
Kajanus, M. ; Kangas, M. & Kuttila, M., (2004). The use of value focused thinking and the
A’WOT hybrid method in tourism management. Tourism Management 25, pp. 499-506.
Kuttila, M. ; Pesonen, M. ; Kangas, J. & Kajanus, M. (2000). Utilizing the analysis hierarchy
process (AHP) in SWOT analysis – a hybrid method and its application to a forestcertification case. Forest Policy and Economics 1, pp. 41-45.
Leskinen, L.A. ; Leskinen, P. ; Kuttila, M. ; Kangas, M. & Kajanus, M. (2006). Adapting
modern strategic decision support tools in the participatory strategy process- a case
study of a forest research station. Forest Policy and Economics 8, pp. 206-216.
Liu, F.H.F. & Hai, H.L. (2005). The voting analytic hierarchy process method for selecting
suppliers. The International Journal of Production Economics 97, pp. 308-317.
Lozano, M. & Vallés, J. (2007). An analysis of the implementation of an environmental
management system in a local public administration. Journal of Environmental
Management 82, 495-511.
Mbohwa, C. & Fukada, S. (2002). ISO 14001 certification in Zimbabwe experiences, problems
and prospects. Corporate Environmental Strategy 9(4), pp. 427-436.
Melnyk, S.A. ; Sroufe, R.P. & Calantone, R. (2003). Assessing the impact of environmental
management systems on corporate and environmental performance. Journal of
Operations Management 21, pp. 329-351.
Noguchi, H. ; Ogawa, M. & Ishii, H. (2002). The appropriate total ranking method using
DEA for multiple categorized purposes. Journal of Computational and Applied
Mathematics 146, pp. 155-166.
Obata, T. & Ishii, H. (2003). A method for discriminating efficient candidates with ranked
voting data. European Journal of Operational Research 151, pp. 233-237.
Paliwal, R. (2006). EIA practice in India and its evaluation using SWOT analysis.
Environmental Impact Assessment Review 26, pp. 492-510.
Pan, J.N. (2003). A comparative study on motivation for and experience with ISO9000 and
ISO14000 certification among Far Eastern countries. Industrial Management & Data
Systems 103(8), 564-578.
Rao, P. ; Casttillo, O. ; Intal Tr, P.S. & Sajid, A. (2006). Environmental indicators for small
and medium enterprises in the Philippines: An empirical research. Journal of Cleaner
Production 14, pp. 505-515.
Rennings, K. ; Ziegler, A. ; Ankele, K. & Hoffmann, E. (2006). The influence of different
characteristics of the EU environmental management and auditing scheme on technical
environmental innovations and economic performance. Ecological Economics 57, pp. 45-59.
Tan, B. ; Lin, C. & Hung, H.C. (2003). An ISO 9001: 2000 quality information system in ecommerce environment. Industrial Management & Data Systems 103(9), pp. 666-676.
Terrados, J. ; Almonacid, G. & Hontoria, L. (2007). Regional energy planning through SWOT
analysis and strategic planning tools: impact on renewable development. Renewable
& Sustainable Energy Reviews 11, pp. 1275-1287.
Yüksel, Ì. & Dağdeviren, M. (2007). Using the analytic network process (ANP) in a SWOT
analysis – a case study for a textile firm. Information Sciences 177, pp. 3364-3382.
Zobel, T. ; Almroth, C. ; Bresky, J. & Burman, J-O. (2002). Identification and assessment of
environmental aspects in an EMS context an approach to a new reproducible
method based on LCA methodology. Journal of Cleaner Production 10, pp. 381-396.
www.intechopen.com
Environmental Management in Practice
Edited by Dr. Elzbieta Broniewicz
ISBN 978-953-307-358-3
Hard cover, 448 pages
Publisher InTech
Published online 21, June, 2011
Published in print edition June, 2011
In recent years the topic of environmental management has become very common. In sustainable
development conditions, central and local governments much more often notice the need of acting in ways that
diminish negative impact on environment. Environmental management may take place on many different
levels - starting from global level, e.g. climate changes, through national and regional level (environmental
policy) and ending on micro level. This publication shows many examples of environmental management. The
diversity of presented aspects within environmental management and approaching the subject from the
perspective of various countries contributes greatly to the development of environmental management field of
research.
How to reference
In order to correctly reference this scholarly work, feel free to copy and paste the following:
Hui-Lin Hai (2011). Assessing the SMEs’ Competitive Strategies on the Impact of Environmental Factors: A
Quantitative SWOT Analysis Application, Environmental Management in Practice, Dr. Elzbieta Broniewicz (Ed.),
ISBN: 978-953-307-358-3, InTech, Available from: />
InTech Europe
University Campus STeP Ri
Slavka Krautzeka 83/A
51000 Rijeka, Croatia
Phone: +385 (51) 770 447
Fax: +385 (51) 686 166
www.intechopen.com
InTech China
Unit 405, Office Block, Hotel Equatorial Shanghai
No.65, Yan An Road (West), Shanghai, 200040, China
Phone: +86-21-62489820
Fax: +86-21-62489821