Chapter 3 Labor Productivity and Comparative Advantage: The Ricardian Model
Bạn đang xem bản rút gọn của tài liệu. Xem và tải ngay bản đầy đủ của tài liệu tại đây (1023.48 KB, 75 trang )
Chapter 3
Labor Productivity
and Comparative
Advantage: The
Ricardian Model
Slides prepared by Thomas Bishop
Preview
•
•
•
•
•
•
•
•
Opportunity costs and comparative advantage
A one factor Ricardian model
Production possibilities
Gains from trade
Wages and trade
Misconceptions about comparative advantage
Transportation costs and non-traded goods
Empirical evidence
Copyright © 2006 Pearson Addison-Wesley. All rights reserved.
3-2
Introduction
• Theories of why trade occurs can be grouped into
three categories:
• Market size and distance between markets determine
how much countries buy and sell. These transactions
benefit both buyers and sellers.
• Differences in labor, physical capital, natural
resources and technology create productive
advantages for countries.
• Economies of scale (larger is more efficient) create
productive advantages for countries.
Copyright © 2006 Pearson Addison-Wesley. All rights reserved.
3-3
Introduction (cont.)
• The Ricardian model (chapter 3) says differences in
productivity of labor between countries cause
productive differences, leading to gains from trade.
Differences in productivity are usually explained by
differences in technology.
• The Heckscher-Ohlin model (chapter 4) says
differences in labor, labor skills, physical capital and
land between countries cause productive differences,
leading to gains from trade.
Copyright © 2006 Pearson Addison-Wesley. All rights reserved.
3-4
Comparative Advantage
and Opportunity Cost
• The Ricardian model uses the concepts of
opportunity cost and comparative advantage.
• The opportunity cost of producing something
measures the cost of not being able to
produce something else.
Copyright © 2006 Pearson Addison-Wesley. All rights reserved.
3-5
Comparative Advantage
and Opportunity Cost (cont.)
• A country faces opportunity costs when it employs
resources to produce goods and services.
• For example, a limited number of workers could be
employed to produce either roses or computers.
The opportunity cost of producing computers is the amount
of roses not produced.
The opportunity cost of producing roses is the amount of
computers not produced.
A country faces a trade off: how many computers or roses
should it produce with the limited resources that it has?
Copyright © 2006 Pearson Addison-Wesley. All rights reserved.
3-6
Comparative Advantage
and Opportunity Cost (cont.)
• Suppose that in the US 10 million roses
can be produced with the same resources that could
produce 100,000 computers.
• Suppose that in Ecuador 10 million roses
can be produced with the same resources that could
produce 30,000 computers.
• Workers in Ecuador would be less productive than
those in the US in manufacturing computers.
• Quick quiz: what is the opportunity cost for Ecuador
if it decides to produce roses?
Copyright © 2006 Pearson Addison-Wesley. All rights reserved.
3-7
Comparative Advantage
and Opportunity Cost (cont.)
• Ecuador has a lower opportunity cost of
producing roses.
Ecuador can produce 10 million roses, compared
to 30,000 computers that it could otherwise
produce.
The US can produce 10 million roses, compared to
100,000 computers that it could otherwise
produce.
Copyright © 2006 Pearson Addison-Wesley. All rights reserved.
3-8
Comparative Advantage
and Opportunity Cost (cont.)
• The US has a lower opportunity cost in
producing computers.
Ecuador can produce 30,000 computers,
compared to 10 million roses that it could
otherwise produce.
The US can produce 100,000 computers,
compared to 10 million roses that it could
otherwise produce.
The US can produce 30,000 computers, compared
to 3.3 million roses that it could otherwise produce.
Copyright © 2006 Pearson Addison-Wesley. All rights reserved.
3-9
Comparative Advantage
and Opportunity Cost (cont.)
• A country has a comparative advantage in
producing a good if the opportunity cost of
producing that good is lower in the country
than it is in other countries.
• A country with a comparative advantage in
producing a good uses its resources most
efficiently when it produces that good
compared to producing other goods.
Copyright © 2006 Pearson Addison-Wesley. All rights reserved.
3-10
Comparative Advantage
and Opportunity Cost (cont.)
• The US has a comparative advantage in computer
production: it uses its resources more efficiently in
producing computers compared to other uses.
• Ecuador has a comparative advantage in rose
production: it uses its resources more efficiently in
producing roses compared to other uses.
• Suppose initially that Ecuador produces computers
and the US produces roses, and that both countries
want to consume computers and roses.
• Can both countries be made better off?
Copyright © 2006 Pearson Addison-Wesley. All rights reserved.
3-11
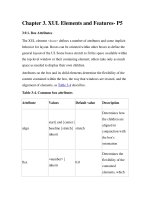
Comparative Advantage and Trade
Millions of
Roses
Thousands of
Computers
U.S.
-10
+100
Ecuador
+10
-30
0
+70
Total
Copyright © 2006 Pearson Addison-Wesley. All rights reserved.
3-12
Comparative Advantage and Trade (cont.)
• In this simple example, we see that when countries
specialize in production in which they have a
comparative advantage, more goods and services
can be produced and consumed.
Initially both countries could only consume 10 million roses
and 30 thousand computers.
When they produced goods in which they had a comparative
advantage, they could still consume 10 million roses, but
could consume 100,000 – 30,000 = 70,000 more computers.
Copyright © 2006 Pearson Addison-Wesley. All rights reserved.
3-13
A One Factor Ricardian Model
• The simple example with roses and
computers explains the intuition behind the
Ricardian model.
• We formalize these ideas by constructing a
slightly more complex one factor Ricardian
model using the following simplifying
assumptions:
Copyright © 2006 Pearson Addison-Wesley. All rights reserved.
3-14
A One Factor Ricardian Model (cont.)
1.
Labor is the only resource important for production.
2.
Labor productivity varies across countries, usually due to
differences in technology, but labor productivity in each
country is constant across time.
3.
The supply of labor in each country is constant.
4.
Only two goods are important for production and
consumption: wine and cheese.
5.
Competition allows laborers to be paid a ―competitive‖
wage, a function of their productivity and the price of the
good that they can sell, and allows laborers to work in the
industry that pays the highest wage.
6.
Only two countries are modeled: domestic and foreign.
Copyright © 2006 Pearson Addison-Wesley. All rights reserved.
3-15
A One Factor Ricardian Model (cont.)
• Because labor productivity is constant, define a unit
labor requirement as the constant number of hours
of labor required to produce one unit of output.
aLW is the unit labor requirement for wine in the domestic
country. For example, if aLW = 2, then it takes 2 hours of
labor to produce one liter of wine in the domestic country.
aLC is the unit labor requirement for cheese in the domestic
country. For example, if aLC = 1, then it takes 1 hour of labor
to produce one kg of cheese in the domestic country.
A high unit labor requirement means low labor productivity.
Copyright © 2006 Pearson Addison-Wesley. All rights reserved.
3-16
A One Factor Ricardian Model (cont.)
• Because the supply of labor is constant,
denote the total number of labor hours
worked in the domestic country as a constant
number L.
Copyright © 2006 Pearson Addison-Wesley. All rights reserved.
3-17
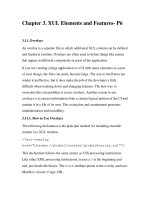
Production Possibilities
• The production possibility frontier (PPF) of an economy
shows the maximum amount of a goods that can be produced for
a fixed amount of resources.
• If QC represents the quantity of cheese produced and QW
represents the quantity of wine produced, then the production
possibility frontier of the domestic economy has the equation:
aLCQC + aLWQW = L
Labor required for
each unit of
cheese production
Total units
of cheese
production
Copyright © 2006 Pearson Addison-Wesley. All rights reserved.
Labor required for
each unit of wine
production
Total amount of
labor resources
Total units
of wine
production
3-18
Production Possibilities (cont.)
Copyright © 2006 Pearson Addison-Wesley. All rights reserved.
3-19
Production Possibilities (cont.)
aLCQC + aLWQW = L
• QC = L/aLC when QW = 0
• QW = L/aLW when QC = 0
• QW = L/aLW – (aLC /aLW )QC: the equation for the PPF, with a slope
equal to – (aLC /aLW )
• When the economy uses all of its resources, the opportunity cost
of cheese production is the quantity of wine that is given up
(reduced) as QC increases: (aLC /aLW )
• When the economy uses all of its resources, the opportunity cost
is equal to the absolute value of the slope of the PPF, and it is
constant when the PPF is a straight line.
Copyright © 2006 Pearson Addison-Wesley. All rights reserved.
3-20
Production Possibilities (cont.)
• To produce an additional kg of cheese requires aLC hours
of work.
• Each hour devoted to cheese production could have been used
to produce a certain amount of wine instead, equal to
1 hour/(aLW hours/liter of wine)
= (1/aLW) liter of wine
• For example, if 1 hour is moved to cheese production, that
additional hour of labor could have produced 1 hour/(2 hours/liter
of wine) = 1/2 liter of wine.
• The trade-off is the increased amount of cheese relative to the
decreased amount of wine: aLC /aLW.
Copyright © 2006 Pearson Addison-Wesley. All rights reserved.
3-21
Production Possibilities (cont.)
• In general, the amount of the domestic
economy’s production is defined by
aLCQC + aLWQW ≤ L
• This describes what an economy can
produce, but to determine what the economy
does produce, we must determine the prices
of goods.
Copyright © 2006 Pearson Addison-Wesley. All rights reserved.
3-22
Production, Prices and Wages
• Let PC be the price of cheese and PW be the price
of wine.
• Because of competition,
hourly wages of cheese makers are equal to the market
value of the cheese produced in an hour: Pc /aLC
hourly wages of wine makers are equal to the market value of
the wine produced in an hour: PW /aLW
• Because workers like high wages, they will work in
the industry that pays a higher hourly wage.
Copyright © 2006 Pearson Addison-Wesley. All rights reserved.
3-23
Production, Prices and Wages (cont.)
• If PC /aLC > PW/aLW workers will make only cheese.
If PC /PW > aLC /aLW workers will only make cheese.
The economy will specialize in cheese production if the
price of cheese relative to the price of wine exceeds the
opportunity cost of producing cheese.
• If PC /aLC < PW /aLW workers will make only wine.
If PC /PW < aLC /aLW workers will only make wine.
If PW /PC > aLW /aLC workers will only make wine.
The economy will specialize in wine production if the price of
wine relative to the price of cheese exceeds the opportunity
cost of producing wine.
Copyright © 2006 Pearson Addison-Wesley. All rights reserved.
3-24
Production, Prices and Wages (cont.)
• If the domestic country wants to consume both wine
and cheese (in the absence of international trade),
relative prices must adjust so that wages are equal in
the wine and cheese industries.
If PC /aLC = PW /aLW workers will have no incentive to flock to
either the cheese industry or the wine industry, thereby
maintaining a positive amount of production of both goods.
PC /PW = aLC /aLW
Production (and consumption) of both goods occurs when
relative price of a good equals the opportunity cost of
producing that good.
Copyright © 2006 Pearson Addison-Wesley. All rights reserved.
3-25