Map based gene cloning of arabidopsis thaliana gametophytic mutant
Bạn đang xem bản rút gọn của tài liệu. Xem và tải ngay bản đầy đủ của tài liệu tại đây (802.62 KB, 35 trang )
THAI NGUYEN UNIVERSITY
UNIVERSITY OF AGRICULTURE AND FORESTRY
HA THI LIEU
MAP-BASED GENE CLONING OF ARABIDOPSIS THALIANA
GAMETOPHYTIC MUTANT
BACHELOR THESIS
Study mode :
Full time
Major
:
Biotechnology
Faculty
:
Biotechnology and Food Technology
Batch
:
2013 – 2017
Supervisor :
Professor Park Soon Ki
Doctor Pham Bang Phuong
Thai Nguyen – 2017
ABSTRACT
Thai Nguyen University of Agriculture and Forestry
Major
Biotechnology
Student
name
Ha Thi Lieu
Student ID
DTN1353150045
Thesis title
Map-based gene cloning of Arabidopsis thaliana gametophytic mutant.
Professor Park Soon Ki
Supervisor(s)
Doctor Pham Bang Phuong
Arabidopsis thaliana has recently became the organism of choice for a
wide range of studies in plant sciences. Map-based cloning is the
method of identifying a mutation gene by looking for linkage to
markers that physical location in Arabidopsis genome. To find mutation
gene, mutant line, named AP -29 – 38 of Landsberg erecta (Ler) was
out – crossed with Columbia (Col) wild type plant. The F generation
was allowed to do self – pollination and seeds were collected.
Abstract
Individual F are planted and performed phenotype and genotype
analysis. DNA genome was extracted from leaves of F
population.
PCR analysis was conducted using 10 Simple Sequence Length
Polymorphisms (SSLPs) markers to define the chromosome 1 is the
region where mutation located. For fine mapping of mutant gene on
chromosome 1, known or self-made markers were used to narrow
genetic interval down. Candidate genes were sequenced to identify the
mutant gene.
Keywords
Arabidopsis thaliana, map-based cloning, AP-29-38
Number of
pages
28
ACKNOWLEDGEMENT
To accomplish this thesis, first and foremost, I would like to express my sincere
gratitude to the Professor Park Soon Ki and Doctor Oh Sung Aeong, who gave me
helpful advice and guidance during the whole period.
I am thankful to Saima Akhter for her contributions and helpful discussions during the
course.
I would like to thank the members of Sexual Plant Reproduction Laboratory for their
help.
I would also like to extend my heartfelt thanks to Doctor Pham Bang Phuong, who
helped me with useful advice during my internship.
I am grateful to the members of the faculty of Biotechnology and Food Technology for
their support.
Finally, I am especially gratitude to my family and my friends for their
encouragement, generous support and understanding during all of this long campaign
Ha Thi Lieu
CONTENTS
LIST OF FIGURES ..................................................................................................i
LIST OF TABLES.................................................................................................. ii
LIST OF ABBREVIATIONS ................................................................................ iii
PART I. INTRODUCTION ..................................................................................... 1
PART II. MATERIALS AND METHODS ............................................................. 6
2.1.Materials and equipment ................................................................................. 6
2.1.1.Plant material for map-base cloning and growth conditions ..................... 6
2.1.2.Equipment ................................................................................................ 6
2.2.Methods.......................................................................................................... 6
2.1.1.Create 2 population .................................................................................. 6
2.2.2.DNA extraction......................................................................................... 8
2.2.3.Genetic analysis using SSLP markers ....................................................... 9
2.2.4.Electrophoresis ...................................................................................... 11
2.2.5.DNA purification .................................................................................... 12
PART III. RESULTS AND DISCUSSION ........................................................... 13
3.1.DNA genomic extraction .............................................................................. 13
3.2.Genetic analysis using SSLP markers ........................................................... 13
3.2.1.Identify chromosomes containing mutation region.................................. 13
3.2.2.Narrow mutation region down on chromosome 1 ................................... 14
REFERENCES ...................................................................................................... 18
RESULT PAPERS ................................................................................................ 18
WEBSITE ............................................................................................................. 19
Appendices 1. Result of PCR-based analysis using SSLP markers in chromosome 1.. ......... ....20
LIST OF FIGURES
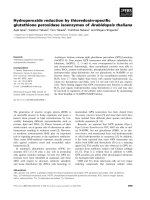
Figure 1. Arabidopsis thaliana ..................................................................................... 5
Figure 2. Process of create F population. .................................................................... 7
Figure 3. Procedure of AP – 29 -38 map –based cloning .............................................. 7
Figure 4. Process of DNA extraction (CTAB method) ................................................. 9
Figure 5. Location of 10 SSLP markers in each chromosome ...................................... 9
Figure 6. Location of 3 markers in chromosome 1 ..................................................... 10
Figure 7. Principle of SSLP mapping ......................................................................... 11
Figure 8. Process of DNA purification ....................................................................... 12
Figure 9. Examples of electrophoresis with wild type plant in mapping line (AP-29-38)
for linkage analysis .................................................................................................... 15
Figure 10. A schematic diagram of the positional cloning ......................................... 16
i
LIST OF TABLES
No. of
tables
Title
Page
Table 1
List of primers and sequences used in this 10
study
Table 2
Result of PCR-based analysis using SSLP
14
markers in each chromosome.
ii
LIST OF ABBREVIATIONS
ADW
Autoclaved distilled water
Col
Columbia
CTAB
Cetyltriethy-ammonium bromide
DNA
Deoxyribonucleic acid
EDTA
Ethylenediaminetetraacetic acid
IAA
Isoamyl Alcolhol
Ler
Landsberg erecta
PCR
Polymerase Chain Reaction
SSLP
Simple Sequence Length Polymorphism
TAE
Tris-acetate-EDTA
dNTPs
Deoxynucleotide triphosphates
WB
Washing buffer
iii
PART I. INTRODUCTION
Arabidopsis thaliana is a small flowering, double leaf plant, native to Eurasia.
Arabidopsis thaliana is considered a weed; it is found by roadsides and in disturbed
land [8]. Arabidopsis thaliana is an annual (rarely biennial) plant, usually growing to
20–25 cm tall [12]. The leaves form a rosette at the base of the plant, with a few leaves
also on the flowering stem. The basal leaves are green to slightly purplish in color,
1.5–5 cm long and 2–10 mm broad, with an entire to coarsely serrated margin; the
stem leaves are smaller and unstalked, usually with an entire margin. Leaves are
covered with small, unicellular hairs (called trichomes) [7]. The flowers are 3mm in
diameter, arranged in a corymb; their structure is that of the typical Brassicaceae.
The fruit is a siliqua 5–20 mm long, containing 20–30 seeds. Roots are simple in
structure, with a single primary root that grows vertically downward, later producing
smaller lateral roots. Arabidopsis thaliana can complete its entire life cycle in 6-8
weeks [18]. The central stem that produces flowers grows after about three weeks, and
the flowers naturally self-pollinate. In the lab, Arabidopsis thaliana may be grown in
petri plates, pots, or hydroponics, under fluorescent lights or in a green house. The
Arabidopsis thaliana genome was sequenced in 2000 by the Arabidopsis Genome
Initiative (AGI). The genome has five chromosomes and a total size of approximately
135-megabases. Physical maps of all chromosomes completed in 1997. The biggest is
chromosome 1 and the smallest is chromosome 4 [19].
The first mutant in A. thaliana was documented in 1873 by Alexander Braun,
describing a double flower phenotype (the mutated gene was likely Agamous, cloned
and characterized in 1990) [3]. However, not until 1943 did Friedrich Laibach (who
had published the chromosome number in 1907) propose A. thaliana as a model
organism. In the 1980s, A. thaliana started to become widely used in plant research
laboratories around the world. It was one of several candidates that included maize ,
petunia, and tobacco [3]. The first gene sequences were published in 1986, and TDNA- mediated transformation of Arabidopsis was also first established in 1986. This
was followed by the first restriction fragment-length polymorphism map in 1988, T1
DNA insertional cloning, map-based cloning, and the extremely efficient vacuum
infiltration method of transformation. Each method was developed to solve specific
biological problems, and each added to the reasons to use Arabidopsis in laboratory
[3].
The fowering plant Arabidopsis thaliana is an important model system for
identifying genes and determining their functions. The developing flower has four
basic organs: sepals, petals, stamens, and carpels (which go on to form pistils).
Observations of homeotic mutations led to the formulation of the ABC model of
flower development by E. Coen and E. Meyerowitz [4]. According to this model,
floral organ identity genes are divided into three classes: class A genes (which affect
sepals and petals), class B genes (which affect petals and stamens), and class C genes
(which affect stamens and carpels). These genes code for transcription factors that
combine to cause tissue specification in their respective regions during development.
Although developed through study of A. thaliana flowers, this model is generally
applicable to other flowering plants. Gametophytic mutants affecting various aspects
of pollen development and function in Arabidopsis thaliana have been identified
through genetic screens for segregation distortion [11].
Mutant analysis represents one of the most reliable approaches to identifying
genes involved in plant development [1]. In flowering plants, development of the
haploid male gametophytes (pollen grains) takes place in a specialized structure called
the anther. Successful pollen development, and thus reproduction, requires high
secretory activity in both anther tissues and pollen. The life cycle of flowering plants
alternates between a haploid organism, the gametophyte, and a diploid organism, the
sporophyte. Plants have male and female gametophytes, both of which are
multicellular. The male gametophyte, the pollen grain, is, at the mature stage, a threecell organism consisting of a vegetative cell and two sperm cells. Pollen development
starts inside the anther, which is a specialized structure of the flower, with the meiotic
divisions of the microsporocytes to form a tetrad of haploid spores [10]. Although
pollen-specific genes have been studied extensively in most cases it remains unclear
what roles these genes play. We have used a mutational approach to identify genes
involved in the control of pollen development [14].
2
The gametophyte is a sexual stage in the life cycle of plants and algae
undergoes generational changes. A mature sporophyte produces spores by meiosis, a
process which reduces the number of chromosomes to half, from 2n to n. The haploid
spores germinate and grow into a haploid gametophyte. At maturity, the gametophyte
produces gametes by mitosis, which does not alter the number of chromosomes. Two
gametes (originating from different organisms of the same species or from the same
organism) fuse to produce a zygote, which develops into a diploid sporophyte. This
cycle, from gametophyte to gametophyte (or equally from sporophyte to sporophyte),
is the way in which all land plants and many algae undergo sexual reproduction [15].
Mutations that arise during the gametocyte degeneration, which occur in certain
genital cells through fertilization, enter the zygote. Change the molecular structure of
the gene can lead to structural changes of the type of protein that it encodes, eventually
could lead to changes in the phenotype. Identification of a gametophyte mutant gene is
important because this gene might affect on reproduction process. In this study, I
performed a population consisting of 852 plants in Arabidopsis used map-based
cloning method to identify a gene involved gametophytic in Arabidopsis, the mutant
line called AP-29-38.
Arabidopsis was chosen as the model plant by many advantages: small and easy
to grow, a short life cycle (see a complete plant life cycle in 6-8 weeks), known full
sequence, easily mutated, not consuming plantings but create many seeds, selfpollination and relationship closeness with edible plants, adapted to live in many
different environments [2]. It has been introduced and naturalized worldwide.
Arabidopsis genome possesses almost the smallest of the higher plant with about
125MB contains approximately 26,000 genes distributed on five chromosomes; The
genome is 7.5 times smaller than the tomato genome, 19 times corn, and 128 times
more wheat [6].
Characterized accessions and mutant lines of A. thaliana serve as experimental
material in laboratory studies. Various strategies for the identification of plant genes
have been used. Analyzing DNA using molecular markers was very fast and accurate
strategy and map-based cloning was used to identify the mutated gene in this study.
Map-based cloning (or positional cloning) is the process of identifying the genetic
3
basic of a mutant phenotype by looking for linkage to markers whose physical location
in the genome is known [5]. With completion and public accessibility of the
Arabidopsis genome, map-based cloning process has been greatly eased since a large
number of molecular markers developed and accumulated [9].
Many types of molecular markers were developed over the decades and more
than 50,000 molecular markers are available for genetic screen in Arabidopsis.
Classical markers such as amplified fragment length polymorphism (AFLP) and
restriction fragment length polymorphism (RFLP) or PCR-based markers such as
cleaved amplified polymorphic sequences (CAPS), derived cleaved amplified
polymorphic sequences (dCAPS) and simple sequence length polymorphism (SSLP).
Among all the molecular markers developed so far, simple sequence length
polymorphism (SSLP) is the most widely use in the laboratory, because it is simple
based on the sequence length difference and can be analyzed on agarose gels, which
make them easy to use and inexpensive [9]. Simple Sequence Length Polymorphisms
(SSLPs) are used as genetic markers with Polymerase Chain Reaction (PCR). An
SSLP is a type of polymorphism: a difference in DNA sequence amongst individuals.
SSLPs are repeated sequences over varying base lengths in intergenic regions of
deoxyribonucleic acid (DNA). In SSLP, variations in microsatellite sequences can be
used for DNA mapping. PCR primers are designed for the unique flanking sequences
and their length can thus be determined in the PCR products. Variance in the length of
SSLPs can be used to understand genetic variation between two individuals in a
certain species.
In process of map-based cloning, one starts with a mutant and eventually
identifies the gene responsible for the altered phenotype, allowing the plant to tell you
what genes are important in the physiological process of interest. At first, the mutant
plant was out-crossed with other ecotype plant. F seeds are planted and performed
phenotype and genotype analysis. F seeds were collected from self-pollinated plants.
PCR analysis was carried out using Simple Sequence Length Polymorphic (SSLP)
markers and DNA which were prepared from the leaves of plants. Recombinant
samples were separated from PCR analysis and mutation region was narrowed down in
4
an interval of markers. Final step of mapping is sequencing analysis of candidate
genes. In this study, we used SSLP markers to indentify gene involved gametophyte
development of mutant line, name as AP-29-38. To find a mutant gene, mapping
population was conducted and analyzed phenotypic analysis of F plants. Genomic
DNA of F plants were prepared from leaves of 852 plants to define chromosomal
region based on PCR analysis using SSLP markers which showed polymorphism
between Ler-0 and Col-0.
Figure 1. Arabidopsis thaliana
5
PART II. MATERIALS AND METHODS
2.1.
Materials and equipment
2.1.1. Plant material for map-base cloning and growth conditions
Mutant plant with genetic background of Landsberg erecta (Ler-0) was out –
crossed with Columbia (Col-0) wild-type plant. In F
generation, plants were
segregated wild type plants and heterozygote mutant used for mapping.
Seeds were sown in soil (soil and vermiculate mixed at ratio of 1:1) and coldtreated at 4°C for 2-3 days in the dark for dormancy breaking. After 2-3 days, seeds
were transferred to growth room under the condition of 16 hours light at 23°C and 8
hours dark in 21°C. After 2 weeks from seed germination seedlings were transplanted
to 50 hole pot.
2.1.2. Equipment
Centrifugal machine HM-150IV (Hanil science industrial), molecular imager
ChemiDoc XRS (BIO RAD), tissue lyser machine (QIAGEN), PCR machine T100
Thermal Cycler (BIO RAD), Vortex-genie 2 (Scientific industries), agarose (Vivantis),
pipet, microwave (Samsung), incubate bath (LABTECH), analytical balance
(Sartorius), breaker (Japan),…
2.2.
Methods
population
2.1.1. Create
To find mutation gene, mutant line, named AP -29 – 38 of Landsberg erecta
(Ler) was mutated and was screened mutant plant with mutant phenotype in pollen
grain. The collected mutant plants was out – crossed with Columbia (Col) wild type
plant. The F generation was allowed to do self – pollination and seeds were collected.
Individual F are planted and performed phenotype and genotype analysis. Figure 2
shows the process to create F2 population.
6
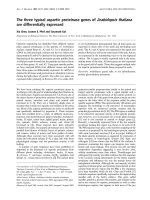
Figure 2. Process of create
population.
After create F population, the mapping process was conducted to find the
mutation region containing mutant gene using SSLP marker (Figure 3).
Figure 3. Procedure of AP – 29 -38 map –based cloning
7
2.2.2. DNA extraction
DNA, or deoxyribonucleic acid, is the hereditary material in humans and almost
all other organisms. Most DNA is located in the cell nucleus (where it is called nuclear
DNA), but a small amount of DNA can also be found in the mitochondria (where it is
called mitochondrial DNA or mtDNA). DNA extraction is a routine procedure used to
isolate DNA from the nucleus of cells. Most DNA extraction protocols consist of two
parts: breaking cells open to release the DNA by and separating DNA from proteins
and other cellular debris [17].
In this study, genomic DNA was extracted for the preparation of DNA for
mapping. The genomic DNA was extracted from fresh leaves of F individual plants
using cetyltriethy-ammonium bromide (CTAB) method with some modifications
following below steps:
1. Put a metal bead into 2ml tube and collect 1 to 2 young leaf material
2. Frezze tube with leaf samples in liquid nitrogen and grinding using Tissue
Lyser machine
3. Immediately, add 250µl CTAB buffer and vortex in room temperature for 15
minutes.
4. Add an equal volume 250µl of chloroform /IAA (24:1) and mix well.
5. Centrifuge for 12 minutes at 12,000rpm
6. Transfer aqueous layer to fresh tube (1,7ml tube). Then, add 140mµL Isopropyl
alcolhol
7. Mix slightly and centrifuge for 6 minutes at 12,000rpm and discard supernatant
8. Wash pellet with 1ml 70% ethanol and centrifuge for 5 minutes at 12,000rpm
9. Pour of ethanol; remove remainder with pipette and dry pellet in clean bench
for 30 minutes.
10. Check that pellet is completely dry and dissolve in 50µL autoclaved distilled
water (ADW)
11. Store DNA samples at -20°C
8
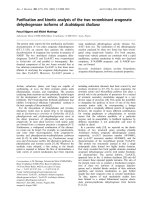
Figure 4. Process of DNA extraction (CTAB method)
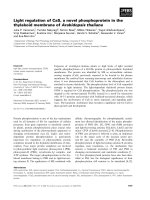
2.2.3. Genetic analysis using SSLP markers
To find the locus of mutation, SSLP (Single Sequence Length Polymorphism)
markers were designed. Firstly, 20 wild-type samples of mapping lines were analyzed
using 10 different markers and a chromosome which is contained mutant gene can be
found. Ten used markers have been designed markers that covering on five
chromosomes.
Figure 5. Location of 10 SSLP markers in each chromosome
9
Next, more markers were designed on mutant chromosome and narrowed the
mutation locus down by analyzing of recombinant samples. In this study, 3 more
marker was used to find the mutation region on chromosome. The position of the three
markers used is shown in the picture below (Figure 6).
Figure 6. Location of 3 markers in chromosome 1
Table 1. List of primers and sequences used in this study
No.
Primer
name
Forward primer (5’-3’)
Reverse primer (5’-3’)
1
nga63
ACCCAAGTGATCGCCACC
AACCAAGGCACAGAAGCG
2
nga280
GGCTCCATAAAAAGTGCACC
CTGATCTCACGGACAATAGTGC
3
nga168
GAGGACATGTATAGGAGCCTCG
TCGTCTACTGCACTGCCG
4
nga162
CTCTGTCACTCTTTTCCTCTGG
CATGCAATTTGCATCTGAGG
5
nga6
ATGGAGAAGCTTACACTGATC
TGGATTTCTTCCTCTCTTCAC
6
17200
CTTATGCTCCAAGCTTAGTGC
CTTGTTTGGATGTGAAATTGGAC
7
nga1107
CGACGAATCGACAGAATTAGG
GCGAAAAAACAAAAAAATCCA
8
CTR1
CCACTTGTTTCTCTCTCTAG
TATCAACAGAAACGCACCGAG
9
PHYC
CTCAGAGAATTCCCAGAAAAATCT AAACTCGAGAGTTTTGTCTAGATC
10
M1324
GTGATCTTACTCGGGGAATCTTT
GCATCTGAAGAAAGAAGCAAGAA
11
nga111
CTCCAGTTGGAAGCTAAAGGG
TGTTTTTTAGGACAAATGGCG
12
59620
AACCACTTGGATATCTAAAGAAC
ATCAACGACTTAAAGTATTTATC
13
56130
TGCTCATGTGACGTCTACATCTTC TCTGTACTACTTTCATGAGTGGG
10
PCR – reactions using 13 SSLP markers were run at 95°C for 2 min to
denaturation followed by 40 cycles of 94°C for 30s, 55°C for 15s, 72°C for 15s, and
72°C for 5 min to final elongation using 15 µL PCR mixture which contained 1µL of
template DNA, 0.375 µL of 10 pmole/µL marker, 1.5 µL of 10X PCR buffer, 0.3 µL of
2.5 mM dNTPs, 0.075 µL of enzyme and 11.375 µL of ADW.
C/C: Columbia (Col); L/L: Langsberg erecta (Ler)
Figure 7. Principle of SSLP mapping
2.2.4. Electrophoresis
Gel electrophoresis is the standard lab procedure for separating DNA by size for
visualization and purification. Electrophoresis use an electrical field to move the
negatively charged DNA toward a positive electrode through an agarose gel matrix.
The gel matrix allows shorter DNA fragments to migrate more quickly than larger
ones. Thus, you can accurately determine the length of a DNA segment by running it
on an agarose gel alongside a DNA ladder. PCR products were loaded into 4% agarose
(Vitantis Inc.USA) gel in 1X TAE buffer and stained with ethidium bromide. Run the
gel at 100V and analyzing gel by Chemidoc XRS camera.
11
2.2.5. DNA purification
Gel extraction of DNA fragments is mainly done to remove proteins and salts
that incorporate from certain reactions. Therefore, in order to use the DNA fragments
for downstream processing, these components musts be removed. DNA fragments
from the gel are routinely extracted for various downstream processing. There are
various methods employed for the extraction of DNA fragments from agarose gel.
Among the methods used, silica-membrane containing spin-column based DNA
extraction is the most widely used. This is the quickest method to effectively purify
DNA fragments from agarose gels [16].
In this study, DNA was purified from PCR product following below steps:
1. On electrophoresis gel, the location which contain band of DNA was cut to
collect DNA and put it into 2ml tube.
2. Add UB (the volume is three time much as gel weight) and incubation 60°C
for 10min.
3. Then, add isopropanol (the volume is the same with the gel weight).
4. Transfer all the volumn to spin column and centrifuge 7000rpm for 1min.
5. Pour off the solution. Add 750µl WB and centrifuge 12000rpm for 1min.
6. Pour off the solution. Centrifuge empty tube at 12000rpm for 3min.
7. Transfer spin column to 1.5ml tube. Add 35µl EB and incubation at room
temperature for 1min.
8. Centrifuge 12000rpm for 1min.
9. Store DNA elution at -20°C
Figure 8. Process of DNA purification
12
PART III. RESULTS AND DISCUSSION
3.1.
DNA genomic extraction
DNA extraction is a routine procedure used to isolate DNA from the nucleus of
cells. Most DNA extraction protocols consist of two parts: breaking cells open to
release the DNA by and separating DNA from proteins and other cellular debris. The
genomic DNA was extracted from fresh leaves of 852 individual F2 plants using
cetyltriethy-ammonium bromide (CTAB) method. DNA was extracted stored at -20°C
for the preparation of DNA for mapping.
3.2.
Genetic analysis using SSLP markers
3.2.1. Identify chromosomes containing mutation region.
Map-based cloning is an iterative approach that identifies the underlying
genetic cause of a mutant phenotype. The major strength of this approach is the ability
to tap into a nearly unlimited resource of natural and induced genetic variation without
prior assumptions or knowledge of specific genes. With information of sequenced
genome and dense collection of genetic markers, map-based cloning becomes
relatively straightforward especially for the Col and Ler ecotypes in Arabidopsis [9].
For map-based cloning of AP-29-38 mutant gene, Ler the mutant plant is outcrossed to the opposite ecotype (Col-0). Seeds are planted at the same of condition and
F
plants are used for mapping population to perform phenotype and genotype
analysis. DNA genome was extracted from F2 plant and do PCR analysis using SSLP
markers. Initially, the 20 wild type samples are genotype with 10 markers located in 5
chromosomes. We found that recombination frequency is 0% in nga280 marker which
located in chromosome 1. This result suggested that the mutant gene is located in
chromosome 1. Table 2 shows the PCR results with 20 wildtype samples using 10
SSLP markers.
13
Table 2. Result of PCR-based analysis using 10 SSLP markers in each chromosome.
No. Samples
Phenotype
nga63
nga280
nga168
nga6
nga162
17200
nga1107
CTR1
PHYC
M1324
Chro# 1
Chro# 1
Chro# 2
Chro# 3
Chro# 3
Chro# 4
Chro# 4
Chro# 5
Chro# 5
Chro# 5
At1g09910 At1g55840 At2g39010 At3g62220 At3g13950 At4g17200 At4g38770 At5g03740 At5g35840 At5g40750
1
Sample-1
Wild type
2
Sample-2
Wild type
3
Sample-3
Wild type
4
Sample-4
Wild type
5
Sample-5
Wild type
6
Sample-6
Wild type
7
Sample-7
Wild type
8
Sample-8
Wild type
9
10
Sample-9 Wild type
Sample-10 Wild type
11
Sample-11 Wild type
L
C
C/L
C/L
C
C/L
L
C
C/L
C/L
L
C/L
14 Sample-14 Wild type
C/L
15 Sample-15 Wild type
C/L
16 Sample-16 Wild type
C/L
17 Sample-17 Wild type
C
18 Sample-18 Wild type
C/L
19 Sample-19 Wild type
C
20 Sample-20 Wild type
C/L
Recombinant gene/ Total gene 11/20
12
Sample-12 Wild type
13
Sample-13 Wild type
C
C
C
C
C
C
C
C
C
C
C
C
C
C
C
C
C
C
C
C
0/20
C
C/L
C
C/L
C
C/L
C
L
L
C/L
C/L
C/L
C/L
C/L
C/L
C/L
L
L
C
C/L
C/L
L
C/L
C/L
L
L
C/L
C/L
C
C/L
C/L
L
C
L
C/L
C
C
L
C/L
C/L
L
C/L
L
C/L
C/L
C
C
L
L
C/L
C/L
C/L
C
C
C
C/L
C/L
C
C
L
C
C
C/L
C/L
C
L
C/L
C/L
C/L
C
L
L
C/L
L
L
C
C/L
C
C/L
C/L
C/L
C/L
C/L
L
C/L
L
C/L
C/L
C/L
10/20
C/L
C/L
C/L
C/L
C/L
C/L
C/L
C/L
L
10/20
C
C
C/L
C/L
C
C
C/L
L
C/L
10/20
C
C/L
C/L
L
C
C/L
C/L
C/L
C/L
10/20
C
C/L
L
C
C
L
L
C/L
L
8/20
C/L
C
L
C/L
C
C/L
C/L
C/L
C
7/20
C
C/L
C
C
L
C/L
C/L
C
C/L
9/20
L
C/L
L
L
C
C/L
C/L
L
C/L
8/20
3.2.2. Narrow mutation region down on chromosome 1
Once a chromosome closely linked to mutation of interest is defined, fine
mapping can be effectively carried out by searching the recombinants in the vicinity of
the mutation using two markers flanking mutation on both sides [13]. As a beginning
of fine mapping process, two flanking markers, nga111 and nga280, successively
found mutation point in chromosome 1. We attempted to narrow the genetic distance
down by checked the recombinants from nga111 and nga280 using 56130 and 59620
markers. The recombinant samples from these two markers are sent for sequencing to
continuos narrow down the mutant region.
14
A
B
C
D
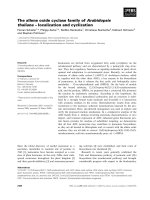
Figure 9. Examples of electrophoresis with wild type plant in mapping line (AP-2938) for linkage analysis
A & B. Marker: nga111 (chromosome 1) with 26 samples
C & D. Marker: nga280 (chromosome 1) with 26 samples
(Control samples. L: Ler-0; C: Col-0; Ht: Heterozygous)
15
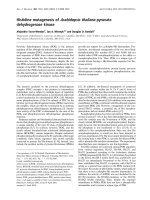
Figure 10 show the schematic diagram of the position cloning of mutant line
AP – 29 -38. In this figure, the mutant region was narrowed down to about 400kb
using two markers 56630 and 58360.
Figure 10. A schematic diagram of the positional cloning
16
PART IV. CONCLUSION
Map-based cloning (position cloning) is a unique approach that identifies
underlying genetic cause of a mutant phenotype by looking for the linkage to markers
whose physical location in the genome is known. For map-based gene cloning, mutant
plant is out-crossed with opposite ecotype. F
seeds were collected from self-
pollinated plants. F progeny is used for mapping population. DNA genomic was
extracted from individual F leaf. To indentify the location of the mutant gene, we test
20 wildtype samples with 10 markers cover 5 Arabidopsis chromosome. In each
chromosome would be have 2 to 3 set of SSLP markers. Result suggested that the
mutant gene was located in chromosome 1. Finally, the region containing mutant gene
was narrowed down to find candidates gene responsible for mutation phenotype. The
region was narrowed down to more than 400Kb. In Arabidopsis a genetic distance of
1% recombination corresponds, on average, to a physical distance of about 250Kb.
However, the ratio between genetic and physical distance is by no means constant and
it varies with respect to position on the chromosome as well as with respect to
different mapping populations. Mapping resolution is mainly determined by the size of
a mapping population [13]. The ultimate goal of fine mapping is to narrow down the
region containing the gene of interest to 40 kb or less (approximately 0.16 cM genetic
distance in Arabidopsis). There would ideally be several recombination events in this
interval to define the position of the mutation that is being mapped. So we are working
to reduce the genetic distance on the chromosome to find the position of the mutation.
17
REFERENCES
RESULT PAPERS
1. Antonia Procissi, Solveig de Laissardie`re, Madina Fe´rault, Daniel Vezon, Georges
Pelletier, & Sandrine Bonhomme. (2001). Five gametophytic mutations affecting
pollen development and pollen tube growth in Arabidopsis thaliana. Genetics 158, p.
1773–1783.
2. David W. Meinke, J. Michael Cherry, Caroline Dean, Steven D. Rounsley, & Maarten
Koornneef. (1998). Arabidopsis thaliana: a model plant for genenome analysis.
Science 23 , pp. 662-682.
3. Elliot M. Meyerowitz. (2001). Prehistory and History of Arabidopsis Research. Plant
Physiology, pp. 15–19.
4. Enrico S. Coen, & Elliot M. Meyerowitz. (1991). The war of the whorls: genetic
interactions controlling flower development. pp. 31-37.
5. Jander G, Norris SR, Rounsley SD, Bush DF, Levin IM, & Last RL. (2002).
Arabidopsis Map-based Cloning in the Post-Genome Era. Plant Physiol, pp. 440–450.
6. Kirankumar S Mysore, Robert P Tuori, & Gregory B Martin. (2001). Arabidopsis
genome sequence as a tool for functional genomics in tomato. Genome Biology,
reviews1003.1–1003.4.
7. Maarten Koornneef, & Ben Scheres. (2011). Arabidopsis thaliana as an experimental
organism. Encyclopedia of Life Sciences, pp. 662–682.
8. Matthias H., & Hoffmann. (2002). Biogeography of Arabidopsis thaliana (L.) Heynh.
(Brassicaceae). Journal of Biogeography, pp. 125–134.
9. Mi Kwon, Hyun Kyung Lee, & Sunghwa Choe. (2005). Novel Simple Sequence
Length Polymorphic (SSLP) Markers for Positional Cloning in Arabidopsis thaliana.
The Genetics Society of Korea, pp. 1-8.
10. Mia Kyed Jakobsen, Lisbeth R. Poulsen, Alexander Schulz, Pierrette Fleurat-Lessard,
Annette Møller, Søren Husted, et al. (2005). Pollen development and fertilization in
18