Effect of Light Emitting Diode to Sunflower Sprouts.
Bạn đang xem bản rút gọn của tài liệu. Xem và tải ngay bản đầy đủ của tài liệu tại đây (1.68 MB, 33 trang )
THAI NGUYEN UNIVERSITY
UNIVERSITY OF AGRICULTURAL AND FORESTRY
VU THI HOA
Topic title:
THE EFFECT OF LIGHT EMITTING DIODE TO SUNFLOWER
SPROUTS
BACHELOR THESIS
Study Mode :
Full-time
Major
:
Food technology
Faculty
:
Biotechnology and food technology
Batch
:
2013-2017
Thai Nguyen, 24/ 06 /2016
THAI NGUYEN UNIVERSITY
UNIVERSITY OF AGRICULTURE AND FORESTRY
VU THI HOA
Topic title:
THE EFFECT OF LIGHT EMITTING DIODE TO SUNFLOWER
SPROUTS
BACHELOR THESIS
Study Mode :
Full-time
Major
:
Food Technology
Faculty
:
Biotechnology and Food Technology
Batch
:
2013-2017
Supervisors :
Assoc. Prof. Dr. Songsin Photchanachai
Msc. Pham Thi Tuyet Mai
Thai Nguyen, 24/ 06/2016
DOCUMENTATION PAGE WITH ABTRACT
Thai Nguyen University of Agriculture and Forestry
Major
Food Technology
Student name
Vu Thi Hoa
Student ID
DTN 1353170023
Thesis Title
Effect of Light Emitting Diode to Sunflower
Sprouts
Supervisor(s)
Assoc. Prof. Dr. Songsin Photchanachai
Msc. Pham Thi Tuyet Mai
Abstract:
This study evaluated the antioxidant properties of sunflower sprouts (Helianthus annuus L.)
as affected by Light Emitting Diode (LED) illumination. Five to six days old sprouts were
supplied with the lights, including: white LED, blue LED (460 nm), red LED (630 nm),
sunlight, fluorescent light and dark light for 12 h, 36 h, in a controlled environment with the
temperature, relative humidity and light intensity of 250C, 65-70% and 50-60 µmol/m2s
respectively. Blue LED light resulted in the enhanced DPPH, vitamin C, blue light also
increased phenolic content at 36 h light. Chlorophyll content did not change significantly.
Red LED light decreased phenolic and vitamin C contents, DPPH and chlorophyll contents
also lower than that treated with sunlight (control). White light enhanced vitamin C but
decreased phenolic content. Dark light reduced total antioxidant activity, chlorophyll, vitamin
C and phenolic contents.
Key words:
Sunflower, LED lights, antioxidant activity,
phenolic, anthocyanin, vitamin C,
Number of pages:
35
ACKNOWLEDGEMENT
This thesis was completed by support and assistance of a number of people
whom I would like to personally thank:
First and foremost, I would like to express my great respect and deep
appreciation to the both my supervisors Assoc. Prof. Dr. Songsin Photchanachai of the
Division of Postharvest Technology, School of Bioresources and Technology, King
Mongkut’s University of Technology Thonburi (KMUTT), Thailand and Msc. Pham
Thi Tuyet Mai from the Biotechnology and Food Technology Department of Thai
Nguyen University of Agriculture (TUAF). Whose expertise and understanding guided
me through my internship, providing useful advice for the improvement of this work.
I would like to acknowledge my teachers at TUAF, Msc. Trinh Thi Chung and
the whole teachers at Faculty of Biotechnology and Food Technology were created a
good practice environment for us.
I wish to express my sincere thanks to my introductor researcher Chalinee
Songkajorn who interesting and instructed during my time here. Big thanks also go to
Nipada Ranmeechai and Naruchon Tantharapornrerk for guidance and immense
knowledge to me and special to all members of Seed Lab for their kind assistance, they
have been supportive and keen friends.
Finally, I would like to express my thanks to my family for their support in my
education. Also thanks to everyone in Postharvest Technology Laboratories for
helping me in conducting the experiment.
CONTENTS
PART 1.INTRODUCTON ............................................................................... 1
1.1.Background .................................................................................................. 1
1.2Objectives ..................................................................................................... 2
1.3 Scope of research ......................................................................................... 2
1.4 Hypothesis.................................................................................................... 2
PART 2. MATERIAL AND METHODS ........................................................ 3
2.1 Plant materials and growth conditions .......................................................... 3
2.2 Experiment design ........................................................................................ 3
2.2.1 Experiment 1: ............................................................................................ 3
2.2.2 Experiment 2 ............................................................................................. 3
2.2.3 Statistical analysis ..................................................................................... 4
2.3 Measurement of parameters .......................................................................... 4
2.3.1 Measurement of total weight ..................................................................... 4
2.3.2 Determination of chlorophyll..................................................................... 4
2.3.3 Determination of total ascorbic acid content (Vitamin C) ........................ 4
2.3.4 Determination of total antioxidant activity (DPPH) ................................... 5
2.3.5 Determination of total phenolic content ..................................................... 5
PART3. RESULTS ........................................................................................... 6
3.1. Effect of LED blue and different light on quality eating and antioxidant
activity compound. ............................................................................................. 6
3.1.1 Chlorophyll pigments ................................................................................ 6
3.1.2 Total phenolic content ............................................................................... 7
3.1.3 Antioxidant activity ................................................................................... 7
3.1.4 Ascorbic acid content ................................................................................ 8
3.2 Effect different LEDs on quality eating and antioxidant activity compound. 9
3.2.1 Chlorophyll pigments ................................................................................ 9
3.2.2 Total phenolic content ............................................................................. 10
3.2.3 Antioxidant activity ................................................................................. 11
3.2.8 Ascorbic acid content .............................................................................. 12
PART 5. CONCLUSION ............................................................................... 13
REFERENCES ............................................................................................... 14
LIST OF FIGURES
Figure 1: Effect of sun light, dark light, blue LED and fluorescent on chlorophyll a and
b, in cotyledon of sunflower sprouts after grown for 6 days. The different letters on the
columns indicate that values are significantly different (P<0.01)
Figure 2: Effect of sun light, dark light, blue LED and fluorescent on total phenolic
content of sunflower sprouts after grown for 6 days. The different letters on the
columns indicates that values are significantly different (P<0.01).
Figure 3: Effect of sun light, dark light, blue LED and fluorescent on antioxidant
activity (DPPH) of sunflower sprouts after grown for 6 days. The different letters on
the columns indicates that values are significantly different (P<0.01)
Figure 4: Effect of sun light, dark light, blue LED and fluorescent on ascorbic acid
content of sunflower sprouts after grown for 6 days. The different letters on the
columns indicates that values are significantly different (P<0.01).
Figure 5: Effect of sun light, white LED, red LED and blue LED on chlorophyll a and
b and total chlorophyll in cotyledons of sunflower sprouts after grown for 6 days. The
different letters on the columns indicate that values are non-significantly different
Figure 6: Effect of sun light, white LED, red LED and blue LED on total phenolic
content of sunflower sprouts after grown for 6 days. The different letters on the
columns indicates that values are significantly different (P<0.05).
Figure 7: Effect of sun light, white LED, red LED and blue LED on antioxidant
activity (DPPH) of sunflower sprouts after grown for 6 days. The different letters on
the columns indicates that values are significantly different (P<0.01).
Figure 8: Effect of sun light, white LED, red LED and blue LED on ascorbic acid
content of sunflower sprouts after grown for 6 days. The different letters on the
columns indicates that values are significantly different (P<0.01).
Figure9: Standard curve of ascorbic acid at 540 nm.
Figure10: Standard curve of Gallic acid at 765 nm for determination of phenolic content
Figure11: Illustrative images of sunflower sprouts for 3 days grown in dark and more
36h under sun light, dark light, blue LED and fluorescent.
Figure12: Illustrative images of sunflower sprouts for 5 days grown in dark and more
12h under sun light, dark light, blue LED and fluorescent.
LIST OF TABLES
Table1: Effect of sun light, dark light, blue LED and fluorescent on the accumulation
of pigments chlorophyll a and b, total chlorophyll, DPPH in cotyledon of sunflower
sprout.
Table2: Effect of sun light, dark light, blue LED and fluorescent on the accumulation
of vitamin C and phenolic in cotyledon of sunflower sprout
Table3: Effect of sun light, white light, red light and blue light on the accumulation of
pigments chlorophyll a and b, DPPH in cotyledon of sunflower sprout.
Table4: Effect of sunlight, white light, red light and blue light on the accumulation of
Vitamin C and phenolics in cotyledon of sunflower sprout
Table5: Total fresh weight of sunflower sprout for 3 days grown in the dark and more
36h under sun light, dark light, blue LED and fluorescent.
Table6: Total fresh weight of sunflower sprout for 5 days grown in the dark and more
12h under sun light, blue light, red light and white light
Table7: List of chemical reagents and equipment/tools need to be used
LIST OF ABBREVIATIONS
µL
Microliter
CV
Coefficient of variation
UV
Ultraviolet
GAE
Gallic acid equivalent
FW
Fresh weight
mL
Milliliter
mg
Milligram
mmol
Milimol
PART 1
INTRODUCTON
1.1. Background
Sunflower (Helianthus annuus L.) is one of the few crop species that originated
in North America (most originated in the Fertile Crescent, Asia or South or Central
America. Sunflowers is a common name refering to its peculiarity of being heliotropic,
which means it is able to orient itself to the solar star. Sunflower roots can explore
deeper soil layers so it can grow on dry and sunny places. Sunflowers sprouts is an
excellent source of vitamin E, B, C and minerals. It also contains a high amount of
protein, bioactive compounds and antioxidants. It improves digestion, brain power,
immune system, and the functioning of the cardiovascular systems. Aside from that, it
prevents heart disease and cancer. Sunflowers are usually consumed by two ways:
sunflower seeds and sunflower oil. But nowadays people use more vegetables under
sprouts in their diet, due to easy growing at home without spending a lot of area and
time. With its excellent nutrients, sunflower microgreens help keep our blood healthy,
reduce inflammation, calms the nervous system, aid in the heart health, and support
cellular recovery (Julie Daniluk, 2011). Moreover, germinated edible seeds are an
excellent source of dietary phenolic antioxidant (Bolívar A and Luis Cisneros,2010)
therefore; natural antioxidants from the microgreens have attracted increasing interests
due to their safety for the consumer (Samuoliene G et al., 2011).
Light is one of the most important environmental factors, which acts on plants
as the sole source of energy (Samuoliene G et al., 2011). Light as an important signal
influences the transition from etiolated to de-etiolated state, a stimulus for plant
development biosynthesis of cell component and gene expression throughout the life
cycle of plant (Wu M.C et al.,2007). Temperature and light are important sources for
plant growth they have ability to promote germination and increase nutrients. But,
natural temperature and light is not enough for the development. Light-emitting
diodes (LEDs) have many advantages compared to other light sources. It contributes
in the accumulation of bioactive and antioxidant compounds in plants during the
photosynthesis (Dsouza et al, 2015). Using LEDs in food production is a best solution
to provide the freshness, safety and nutritious food to maintain a healthy and active
1
life for people. Therefore, this study evaluated the effect of LED providing different
lighting spectra on antioxidant properties of sunflower microgreens.
1.2Objectives
To evaluate the effect of LEDs on antioxidant components, total antioxidant
activity, chemical compositions and eating quality of sunflower microgreens.
1.3 Scope of research
This research compared between the light conditions for sunflower micreogreen
throughout chemical properties. The different light, wavelength used including: White
light, Red (630nm), Blue (460nm), sunlight, dark light and fluorescent light.
Experiment 1 were sunlight, dark, fluorescent lights and blue light on sunflower
microgreens while experiment 2 tested for sunlight red, blue and white lights. The
chemical properties of sunflower microgreens focused on total ascorbic acid content
(TAAC), total phenolic content (TPC), 2,2-diphenyl-1-picrylhydrazyl (DPPH) free
radical scavenging assay, total chlorophyll a and b contents.
1.4 Hypothesis
- Different light types sources and wavelength had effects on the chemical
properties of sunflower microgreens.
- Different time of exposure had effects on chemical properties of sunflower
microgreens.
2
PART 2
MATERIAL AND METHODS
2.1 Plant materials and growth conditions
Sunflower (Helianthus annuus L.) seeds were obtained from a market in
Bangkok. Seeds were kept at 40C during experiment in the Seed Laboratory, Division
of Postharvest Technology, King Mongkut’s University of Technology Thonburi.
Seeds were soaked and incubated prior to sowing in the plastic basing containing
moist coconut coir (fiber). Sunflower seeds (250g) were grown in the plastic basin,
watered three times by spraying throughout the growing period. LEDs, fluorescent,
sunlight and dark lights were used.
2.2 Experiment design
2.2.1 Experiment 1:
The sunflower seeds were prepared and grown as described in 2.1 in a plastic
basin, 1basin for each treatment and conducted four treatments shown below. The
basins were covered with plastic canvas plastic for 3 days, after 3days and spayed with
water. The seedlings were transferred to the four treatment following for experiment 1:
Treatment1: planting under darkness for 36 hours (control treatment).
Treatment2: planting under sunlight for 36 hours.
Treatment3: planting under fluorescent light for 36 hours.
Treatment4: planting under blue LED light for 36 hours.
After 6 days, sunflower microgreens were cut then packed in zip bags and
stored at 40C to keep the quality of the microgreens and prepared for analysis.
2.2.2 Experiment 2
The sunflower seeds were prepared and grown as described in 2.1 in plastic
basin, one basin for each treatment and performed four treatments. They were covered
with plastic canvas plastic for five days. After that, the plastic canvas was opened open
and spray water. The following were the treatments for experiment 2:
Treatment1: planting under sunlight for 12 hours (control treatment).
Treatment2: planting under white light for 12 hours.
Treatment3: planting under red light for 12 hours.
Treatment3: planting under blue light for 12 hours.
3
2.2.3 Statistical analysis
The results were analyzed using the SAS program version 9.0 (SAS Institute Inc.,
Cary, NC, USA) at 95% confidence level and means were separated by Ducan’s Multiple
Range Test (DMRT) at 5% level of significance.
2.3 Measurement of parameters
2.3.1 Measurement of total weight
The total weight of sunflower microgreens was measured in grams (g) by
electronic balance with three decimals.
2.3.2 Determination of chlorophyll
Chlorophyll content was determined according to the methods of Moran (1982)
using spectrophotometer (UV-1800, Shimadzu, Japan). Extracts were prepared using
the cotyledons only with an approximate weight of five g (fresh weight)/ per replicate
and added with 20mL of N,N Dimethylformamide. Each treatment had eight
replicates. Then, the solution was homogenized at 8.4 rpm and incubated at 40C for
24h in dark condition. Then, the homogenate was filtered to remove solid. The sample
was diluted at a proportion of 1:40( 1 sample: 40 N-N ). The optical density was
measured using a UV-1800 spectrophotometer chlorophyll a is 664nm (OD664) and
chlorophyll b is 647nm (OD647). Determined chlorophyll from the following equations
(Lichtenthaler and Wellburn, 1983; Zhang et al., 2009, as cited in H. Li et al, 2012):
Chl.a (mg/g)=(12.72*OD664-2.59*OD647 )V/1000W
Chl.b (mg/g)=(22.88*OD647-4.67*OD664 )V/1000W
Chl.(a+b) (mg/g)= Chl.a+Chl.b
2.3.3 Determination of total ascorbic acid content (Vitamin C)
Vitamin C was determined by DNPH method (Kapur et al., 2012)
Chemical preparation: 5% metaphosphoric acid (metaphosphoric 5g + distilled
water), 2% Thiourea solution( thiourea 2g in 5% metaphosphoric acid), 0,02%
indophenol (20mg 2,6 indophenol + 100mL distilled water), 85% sulfuric acid , 2%
2,4- Dinotrophenyl hydrazine(DNP) (2g DNP +10N H2SO4 100ml) and standard
ascorbic acid.
Sample preparation: Five g fresh sample was weighed, added with 20ml of 5%
metaphosphoric, homogenized in plastic tube (IKA T25, Ultra-Turrax, Japan) and
4
placed in an ice bath. Then, the sample was filtered. The sample was extracted, take
0.4mL filtrate and mix with 0.2mL of 0,02% indophenol and held for 2-3 minutes.
Next, 0.4mL of 2% thiourea solution and 0.2mL of 2% DNP(except blank sample)
were added to the solution and shaken. After that, it was incubated at 500C for 1h in
hot water bath. When finished, the sample were taken out and added with 1mL of 85%
H2SO4 then incubated at room temperature for 30minutes. The absorbance was
measured at 540nm using spectrophotometer (UV-1800, Shimadzu, Japan). The
standard used were ascorbic acid and metaphosphoric with concentration at 0, 20, 40,
60, 80, 100 mg/L.
2.3.4 Determination of total antioxidant activity (DPPH)
Total antioxidant activity will be determined by DPPH method (Hussian,
Suradkar, Javaid, Akram and Parvez, 2015).
Chemical preparation: working solution was prepared by DPPH and 95%
ethanol.
Extracts preparation: Five g sample (wet weight) was added with 20mL of
85% ethanol and homogenized using homogenizer at 8.4rpm in ice bath. Then, it was
centrifuged at 12,000rpm for 10minutes to obtain the supernatant. After that, 0.15mL
supernatant was taken, mixed with 2.85mL working solution and incubated in dark
condition for 30min. Absorbance was measured at 515nm in a UV-Vis
spectrophotometer(Shimadzu, UV-1800, Japan).
DPPH radical scavenging (%)=[(Aworking solution- Asample)]/Aworking solution
2.3.5 Determination of total phenolic content
Phenolic content was measured following the Folin-Ciocalteu method of
Singleton et al(1999). The steps to create supernatant solution was the same analysis
with DPPH analysis. 0.02 mL supernatant was take out and 1.6mL distilled water was
added .Then, 0.1mL of 100% Folin-ciocalteu phenol solution mixed with 0.2mL of
20% sodium carbonate was added. Next, it was incubated at 400C for 30 min in water
bath. When finished, the sample was taken out and placed at room temperature for 15
min and was measured using double beam UV-Vis spectrophotometer (Shimadzu, UV,
Japan) at fixed wavelength of 765nm. The standard used was garlic acid with
concentrations of 0, 0.2, 0.4, 0.6, 0.8, 1 mg/L.
5
PART3. RESULTS
3.1. Effect of LED blue and different light on quality eating and antioxidant
activity compound.
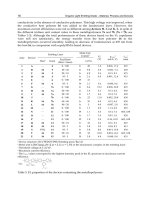
3.1.1 Chlorophyll pigments
The effect of sunlight, dark light, blue LED and fluorescent on accumulation of
chlorophyll a, b and total chlorophyll in cotyledon of sunflower sprout was showed in
Figure 1. Interestingly, fluorescent light has the most ability to produce chlorophyll
pigments. Chlorophyll a, b and total chlorophyll contents were 13.78, 5.19 and 18.97
mg/100g FW, respectively. There was significant difference between different lights.
Chlorophyll a, b and total chlorophyll under dark light which showed the lowest due to
light absence, seedling require light for photosynthesis and initiate photo
morphogenesis (Tiaz and Zeiger, 2010).
5.19a
6
13.4a
13.4a
13.7a
2.26b
C hl o r o phyl l b
(m g /1 0 0 g F W )
4.52b
4.15b
4
2
0.54c
0
Sun light
Dark
blue LED Fluorescent
Treatments
25
17.54
a
Total chlorophyll
(mg/100g FW)
17.92a
20
18.97a
15
10
5
2.7b
0
Sun light
Dark light LED blue fluorescent
Treatments
Figure 1 Effect of sunlight, dark light, blue LED and fluorescent on chlorophyll a and
b and total chlorophyll in cotyledon of sunflower microgreens after grown for 6 days.
The different letters on the columns indicate that values are significantly different (P≤0.01).
6
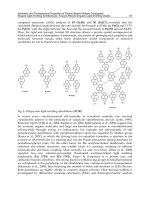
3.1.2 Total phenolic content
The results of the total phenolic content ranged between 21.51 to 28.94 mmol
GAE/100g FW. The highest total phenolic content was under blue LED (28.94 mmol
GAE/100g FW). This may relate to the abiotic stress, (Rivero et al., 2001) reported
that thermal stress accumulates phenolic in tomato and water melon plants.
Whereas results were not significant among sunlight, dark and fluorescent lights.
28.94a
23.06b
22.69b
21.51b
Figure 2 Effect of sunlight, dark light, blue LED and fluorescent on total phenolic
content of sunflower sprouts after grown for 6 days. The different letters on the
columns indicates that values are significantly difference (P≤0.01).
3.1.3 Antioxidant activity
There was significant difference in DPPH of sunflower microgreens as shown in
Figure 2. DPPH content with different light ranged between 25.52 to 44.66%. Amount
of DPPH was the highest blue LED (44.66%) due to reactive oxygen species (ROS)
was accumulation under blue LED (Kim et al., 2013). Due to, Blue LED had long
wavelength effected to photosynthesis, photosynthesis effected to product and make
increased antioxidant. So, it can prove antioxidant enzyme activity, it is agreement
with results in barley (Urbonavičiūtė, 2009). Sprouts under dark light had the lowest
DPPH (25.52%) but not different with sunlight (28.67%) and fluorescent light
(31.3%).
7
44.66a
31.3b
28.67b
25.52b
Figure 3 Effect of sunlight, dark light, blue LED and fluorescent on antioxidant
activity (DPPH) of sunflower microgreens after grown for 6 day. The absence of
letters on the columns indicates that values are significantly difference (P≤0.01).
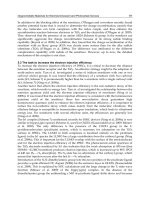
3.1.4 Ascorbic acid content
Ascorbic acid of sunflower microgreens ranged between 1.87 to 5.92 mg/100g
FW. Sunflower micreogreen grown under sunlight and blue LED had higher ascorbic
acid than those grown under dark and fluorescent lights. Figure4 showed ascorbic acid
amount which did not significantly induced by blue LED, other authors verified
different enzymes have involved to ascorbic acid synthesis under blue light (Zhang et
al, 2015).
8
Vitamin C (mg/100g FW.)
10
4.75a
8
5.92a
6
2.74b
4
1.87b
2
0
Sun light
dark light blue LED fluorescent
Treatments
Figure 4 Effect of sunlight, dark light, blue LED and fluorescent on ascorbic acid
content of sunflower microgreens after grown for 6 days. The different letters on the
columns indicate that values are significantly different (P≤0.01).
3.2 Effect different LEDs on quality eating and antioxidant activity compound.
3.2.1 Chlorophyll pigments
Figure 5 shows that there is no significant difference among the treatments for
Chlorophyll a and total chlorophyll contents. The mount of total chlorophyll content
checked in range between 13.8-14.91 mg/100g FW. It is agreement with Houttuynia
cordata seedlings (Wang et al., 20015) that chlorophyll ratio under LED treatments
did not change significantly. Due to absorbs light most strongly in the blue portion of
the electromagnetic spectrum, followed by the red portion but all the light in this
experiment have blue and red light.
9
10.58a 10.44a
To tal c hl o r o phyl l (m g /1 0 0 g F W .)
10.98a
3.93a
10.47a
3.32b
3.36b
3.07b
20
14.91a
15
13.89a
13.8a
14.54a
10
5
0
Sun light LED white LED red LED blue
Treatments
Figure 5 Effect of sunlight, white LED, red LED and blue LED on chlorophyll a and b and
total chlorophyll in cotyledons of sunflower sprouts after grown for 6 days. The absence of
letters on the columns indicate that values are not significantly different (NS).
3.2.2 Total phenolic content
Total phenolic content of sunflower microgreens showed significant differences
under different lights. Phenolic content of sunflower microgreens ranged between
15.75 to 20.93mmolGAE/ 100g FW. Phenolic content was lowest under red light, this
result is concordant in wheat leaves where content of phenolic amount reduced under
sole red LED (Urbonavičiūtė, 2009).
10
20.9a
20.74a
16.88b
15.75b
Figure 6 Effect of sunlight, white LED, red LED and blue LED on total phenolic
content of sunflower sprouts after grown for 6 days. The different letters on the
columns indicate that values are significantly different (P≤0.05).
3.2.3 Antioxidant activity
Antioxidant activity of sunflower microgreens showed significant difference
when grown under LED light as shown in Figure 7. The results ranged between 10.26
to 20.22%. The DPPH under blue LED (20.22%) was highest. The outcome of red
LED having the lowest antioxidant corresponded with Urbonavičiūtė (2009) that with
single red LED all wheat varieties were more resistant to antioxidant activities properties.
20.22a
19.96b
10.66b
10.26b
Figure 7 Effect of sun light, white LED, red LED and blue LED on antioxidant
activity (DPPH) of sunflower sprouts after grown for 6 days. The different letters on
the columns indicate that values are significantly different (P≤0.01).
11
3.2.8 Ascorbic acid content
The effect of sunlight and LEDs on accumulation of ascorbic acid were showed
in Figure 8. Blue light was enhanced Vitamin C content, it is in agreement with
previous study such as results in citrus juice (Zhang et al, 2015) that under Blue LED
was increased ascorbic acid amount in three citrus juice. Verkerke(2014) concluded
that when increasing light intensity vitamin C was increased. (Zhang et al, 2015) also
showed that red LED did not increased vitamin C content. White light improve
vitamin (Samuoliene,2012) correspond with this results.
Vitamin C (mg/100g FW.)
5.18a
6
4.83a
4.55b
3.94c
4
2
0
Sun light
LED white LED red
LED blue
Treatments
Figure 8 Effect of sunlight, white LED, red LED and blue LED on ascorbic acid
content of sunflower sprouts after grown for 6 days. The different letters on the
columns indicate that values are significantly different (P≤0.01).
12
PART 5
CONCLUSION
The concentrations of the compounds increased under lights. These changes were
more observable in LED treatment which had higher DPPH, vitamin C, phenolic and
chlorophyll concentrations.
In treatment1 of 36 h light, blue LED increased DPPH, phenolics but there were
no difference between blue LED and sunlight (control) in terms of vitamin C and
chlorophyll contents. Meanwhile, chlorophyll and vitamin C concentration were
decreased under dark conditions. Fluorescent light did not affect chlorophyll, DPPH
and phenolics but reduced vitamin C content.
In treatment 2 of 12h light, both white and blue LED significantly induced
vitamin C. Also, blue LED induced DPPH but white LED decreased phenolic content.
Meanwhile, red light decreased vitamin C and phenolic at 12h light. There were no
differences between sunlight and LEDs in chlorophyll content.
At 12h and 36h light, Blue LED enhanced antioxidant activity (DPPH).
Based on the results, blue LED enhanced the production of antioxidants and
could be attributed to the short wavelength particularly at 450 nm which has been
reported to increase photosynthetic processes. With the increased rate of
photosynthesis also increased its products which could be used for metabolism and
serve as precursors for antioxidant synthesis.
13
REFERENCES
1. Bolívar A. Cevallos-Casals
1
, Luis Cisneros-Zevallos*(2010).,Impact of
germination on phenolic content and antioxidant activity of 13 edible seed
species, Food Chemistry Vol. 199, pp. 1485-1490.
2. E. Kubicka, L Jçdrychowski and R. Amarowicz(1999) Effect of phenolic
compounds extracted from sunflower seeds on native lipoxygenase activity, pp.
127-130.
3. Gallie, D. R. (2013). Increasing Vitamin C Content in Plant Foods to Improve
Their Nutritional Value-Successes and Challenges. Nutrients. Vol. 5, pp. 34243446.
4. Giedrė Samuolienė1,*, Aušra Brazaitytė1, Julė Jankauskienė1, Akvilė Viršilė1,
Ramūnas Sirtautas1, Algirdas Novičkovas2, Sandra Sakalauskienė1, Jurga
Sakalauskaitė1, Pavelas Duchovskis1(2013)., LED irradiance level affects
growth and nutritional quality of Brassica microgreens, Cent. Eur. J. Biol. •
Vol.8(12), pp. 1241-1249.
5. Hussain, P. R., Suradkar, P., Javaid, S., Akram, H., Parvez, S. (2015). Influence of
pastharvest gamma irradiation treatment on the content of bioactive compounds and
antioxidant activity of fenugreek
(Trigonella Foenum-graceum L.) and spinach
(Spinacia oleracea L.) leaves. Inovative Food Science and Emerging Technologies.
Vol. 33, pp. 268-281
6. Inanc, A. L. (2011). Chlorophyll: Structural Properties, Health Benefits and Its
Occurrence in Virgin Olive Oils. Academic Food Journal. vol. 9 (2), pp. 26-32.
7. Julie Daniluk, R.H.N. (2011). Five health reasons to eat sunflower seeds and
sprouts.
8. Kapur, A., Haskovic, A., Copra-Janicijevic, A., Klepo, L., Topcagic, A.,
Tahirovic, I., Sofic, E. (2012). Spectrophotometric analysis of total ascorbic
acid content in various fruits and vegetables. Bulletin of the Chemists and
Technologists of Bosnia and Herzegovina, pp. 39-42.
9. Kim, K., Kook, H.S., Jang, Y., Lee, W., Kannan, S.K., Chae, J. and Lee, K., 2013,
“The Effect of Blue-Light-Emitting Diodes on Antioxidant Properties and
14
Resistance to Botrytis cine in Tomato”, The Journal of Plant Pathology and
Microbiology, Vol. 4, pp. 1-5.
10. Li, H., Tang, C., Xu, Z., Liu, X. and Han, X., 2012, “Effects of Different Light
Sources on The Growth of Non-heading Chinese Cabbage (Brassica campestris
L.)”, Agricultural Science, Vol. 4, pp. 262-273.
11. Li, C., 2000, “Plant blue-light receptors”, Trends in Plant Sciences, Vol, 5, rea No.
8, pp. 337-342.
12. Lin, K., Huang, M., Hsu, M. and Yang, Z., 2013, ”The Effect of Red, Blue and
White Light-Emitting Diodes on The Growth, Development, and Edible Quality
of Hydroponically Grow Lettuce (Lactuca sativa L. var. capitantia)”, Scietia
Horticulturae, vol. 150, pp. 86-91.
13. MORAN R, D PORATH 1980 Chlorophyll determination in intact tissues using
N,N-dimethylformamide. Plant Physiol Vol. 65, pp. 478-479.
14. Moran, R. (1982). “Formulae for determination of chlorophyllous pigments
extracted with N,N Dimethylformamide”. Plant physiol. Vol. 69, pp. 13761381.
15. M. M´arton, Zs. M´andoki, Zs. Csap´o-Kiss, J. Csap´o,(2010) The role of sprouts
in human nutrition. A review, pp.81-117.
16. Rivero, R.M., Ruiz, J.M., García, P.C., Lopez-Lefebre, L.R., Sanchez, E. and
Romeo, L., 2001 “Resistance to Cold and Heat Stress: Accumulation of
Phenolic Compounds in Tomato and Watermelon Plants”, Plant Science, Vol.
pp.315-321.
17. Samuoliene, G., Brazaityte, A., Sirtautas, R., Novickovas, A. and Duchovskis, P.,
2012, “The Effect of Supplementary LED Light on The Antioxidant and
Nutritional Properties of Lettuce”, ACTA Horticulturae, Vol. 952, pp. 835-841
18. Samuolienė G., Urbonavičiūtė A., Brazaitytė A., Šabajevienė G., Sakalauskaitė J.,
Duchovskis P., (2011)The impact of LED illumination on antioxidant properties
of sprouted seeds, Cent. Eur. J. Biol., Vol. 6, pp. 68-74.
19. Singleton , V. L., Othofer, R. and Raventos, L. R. M. (1999). Analysis of Total Phenolics
and other Oxidation Substrates and Antioxidant by Means of Folin-Ciocalteu Reagent.
Methods in Emzymology. Vol. 299, pp. 152-178.
15
20. Taiz, L. and Zeiger, E., 2010, Plant Physiology, 5th ed., Sunderland, Sinauer
Associates, USA, pp.99-109.
21. Urbonaviciute, A., Samuoliene, G., Brazaityte, A., Duchovskis, P., Ruzgas, V. and
Zukauskas, A., 2009, “The Effect of Variety and Lighting Quality on
Wheatgrass Antioxidant Properties”, Zemdirbyste- Agriculture, Vol. 96, pp.
119-128.
22. Verkerke, W., Labrie, C. and Dueck, T., 2015, “The Effect of Light Intensity and
Duration on Vitamin C Concentration in Tomato Fruits”, ACTA Horticulture,
Vol. 11, pp. 49-53.
23. Wu M.C, Hou C.Y., Jiang C.M., Wang Y.T., Wang C.Y., Chen H.H., et al.,
(2007)A novel approach of LED light radiation improves the antioxidant
activity of pea seedlings, Food Chem., Vol. 101, pp. 1753-1758.
24. Wang, Z., Tian, J.Y. and Yang, L., 2015, “Effect of LED Light Spectra on Active
Oxygen Metabolism and Expression of Antioxidant Isozyme in Houttuynia
Cordata Thub. Seedlings”, Hort Science, Vol.1, No.5, pp. 28-34.
25. Zhang, L., Ma, G., Yamawaki, K., Ikoma, Y., Matsumoto, H., Yoshioka, T., Ohta,
S. and Kato, M., 2015,”Regulation of Ascorbic Acid Metabolism by Blue LED
Light Irradiation in Citrus Juice Sacs”, Plant Science, vol. 233, pp. 134-142
26. />
16