Online social networks human cognitive constraints in facebook and twitter personal graphs
Bạn đang xem bản rút gọn của tài liệu. Xem và tải ngay bản đầy đủ của tài liệu tại đây (2.32 MB, 109 trang )
Online Social Networks: Human
Cognitive Constraints in Facebook
and Twitter Personal Graphs
Online Social Networks: Human
Cognitive Constraints in
Facebook and Twitter Personal
Graphs
Valerio Arnaboldi
Andrea Passarella
Marco Conti
Robin I.M. Dunbar
AMSTERDAM • BOSTON • HEIDELBERG • LONDON • NEW YORK • OXFORD
PARIS • SAN DIEGO • SAN FRANCISCO • SINGAPORE • SYDNEY • TOKYO
Elsevier
Radarweg 29, PO Box 211, 1000 AE Amsterdam, Netherlands
The Boulevard, Langford Lane, Kidlington, Oxford OX5 1GB, UK
225 Wyman Street, Waltham, MA 02451, USA
Copyright © 2015 Elsevier Inc. All rights reserved.
No part of this publication may be reproduced or transmitted in any form or by any means, electronic
or mechanical, including photocopying, recording, or any information storage and retrieval system,
without permission in writing from the publisher. Details on how to seek permission, further
information about the Publisher’s permissions policies and our arrangements with organizations
such as the Copyright Clearance Center and the Copyright Licensing Agency, can be found at our
website: www.elsevier.com/permissions.
This book and the individual contributions contained in it are protected under copyright by the
Publisher (other than as may be noted herein).
Notices
Knowledge and best practice in this field are constantly changing. As new research and experience
broaden our understanding, changes in research methods, professional practices, or medical treatment
may become necessary.
Practitioners and researchers must always rely on their own experience and knowledge in evaluating
and using any information, methods, compounds, or experiments described herein. In using such
information or methods they should be mindful of their own safety and the safety of others, including
parties for whom they have a professional responsibility.
To the fullest extent of the law, neither the Publisher nor the authors, contributors, or editors, assume
any liability for any injury and/or damage to persons or property as a matter of products liability,
negligence or otherwise, or from any use or operation of any methods, products, instructions, or ideas
contained in the material herein.
Library of Congress Cataloging-in-Publication Data
A catalog record for this book is available from the Library of Congress
British Library Cataloguing in Publication Data
A catalogue record for this book is available from the British Library
ISBN: 978-0-12-803023-3
For information on all Elsevier publications
visit our website at />
PREFACE
Online social networks (OSNs), like Facebook and Twitter, are undoubtedly
changing the way we communicate and manage our social lives. The ability
to access OSNs from our smart mobile devices is contributing to the socalled cyber-physical world (CPW) convergence, which envisions a world
where virtual and physical social interactions are often indistinguishable and
completely dependent upon each other.
In this scenario, the analysis of OSNs is a very intriguing and important
topic for two reasons. One is that analysing the behaviour of OSN users can
lead to new insights into human social behaviour. Whilst it is known that
people’s social capacity is bounded by their limited cognitive and time resources, the effect of OSNs on these limits is still not completely understood.
The other is that OSNs are one of the primary means of communication
between users and information access in the CPW. Understanding the key
features of human relationships inside OSNs may thus help in designing
novel user-centric services.
In this book, we investigate these aspects, presenting a series of analyses
on the structural properties of personal social network graphs (known as
ego networks) in Facebook and Twitter. The book uses a multidisciplinary
approach to the study of social networks, discussing the most recent
advances in the field. The results presented in this book indicate that ego
networks in Facebook and Twitter show the same structural properties as
those found by previous studies in offline environments (not mediated by
OSNs). This suggests that, despite having initiated a radical change in our
lives, OSNs may be unable to improve our social capacity, because that,
apparently, remains constrained by the limited nature of the capacities of our
brain. Moreover, thanks to the analysis of the large volume of data available
from Facebook and Twitter, it has been possible to find also original results
in terms of new properties on the structure of ego networks that were not
visible in offline social networks. This suggests that we can use the study
of large-scale online communication datasets to deepen knowledge about
human social behaviour. In effect, online data represent a sort of social
microscope to investigate human behaviour.
vii
viii
Preface
Finally, in the book, we discuss how OSN structural properties could
be exploited to extend social network analysis, and to create future online
services. We discuss several such examples, including the analysis of information diffusion, and we also present initial results on new communication
platforms based on the concepts discussed in this book, showing how the
highlighted OSN structural properties impact on key features of this type of
services.
ACKNOWLEDGEMENTS
Valerio Arnaboldi would like to thank his family for their support during the
book-writing process.
Marco Conti wishes to thank his wife, Laura, for her invaluable support
understanding and inspiration, throughout this book project, and in everyday
life.
Andrea Passarella expresses his gratitude to Erica, his wife, for her
constant understanding, encouragement and for being such a great life
partner.
The work for this book of Valerio Arnaboldi, Marco Conti and Andrea
Passarella has been carried out also in the European Laboratory on Big Data
Analytics and Social Mining (SoBigData, ), a joint
laboratory involving IIT-CNR and a number of other institutions active in
the area of Social Mining. SoBigData is leading, under H2020, the SoBigData Research Infrastructure, the only EU-funded Research Infrastructure
on BigData and social data mining.
Robin I.M. Dunbar’s research is supported by a European Research
Council Advanced grant.
ix
CHAPTER
1
Introduction
1.1 OFFLINE AND ONLINE SOCIAL NETWORKS
In its classical definition, a ‘social network’ represents a social structure
containing a set of actors and a set of dyadic ties identifying social
relationships existing between these actors in the considered social context
(e.g. a workplace, a country, the scientific community) [1]. Social network
analysis is aimed at understanding social phenomena arising in the contexts
in question (e.g. the circulation of new ideas in a workplace, the spread of
diseases or the creation of collaborations among scientists) by looking at
structural properties of these networks.
The recent advent of social media, like Facebook and Twitter, is creating
new opportunities for the analysis of social networks. In fact, some social
media are now so widely used that they can represent a large portion of an
individual’s entire social world, and their analysis could therefore provide
new insights into our social behaviour. In contrast to more traditional means
of communication (such as face-to-face interaction or communication by
phone), social media are gradually generating a completely new ‘online’
social environment, where social relationships do not necessarily map preexisting relationships established face-to-face, but can also be created and
maintained only in the virtual world. To highlight the differences between
these social environments, we define ‘online’ social networks (hereinafter
OSNs) as the social networks formed of users of specific social media
and the social links existing between them, and ‘offline’ social networks
as all the other social networks not mediated by the use of social media
(e.g. networks formed through face-to-face interactions and phone calls).
Our definition of OSNs emphasises the capacity that social media offer
for projecting ourselves in the virtual world of online communications,
something that other communication services are not able to do. This
distinction between ‘online’ and ‘offline’ social networks will be extensively
used in this book to analyse and discuss the differences between the social
environments they embody.
Facebook and Twitter surely represent nowadays the most important
and the largest OSNs in the world, and they will be the main subject of
1
2
Online Social Networks
discussion in this book. For the readers who are less familiar with them, we
give a brief description of their main features, introducing the terms that we
shall encounter in the rest of the book.
Facebook is the most used online social networking service in the world,
with more than 1.3 billion monthly active users as of the first quarter of
2015 [2]. It was founded in 2004 and is open to everyone over 13 years
old. Facebook provides several features for social interaction. Users have
a profile which reports their personal information, and can be customised.
Connected to their profile, users have a special message board called wall,
which reports all the status messages they create (status updates) as well as
messages received from other users (posts). Posts can contain multimedia
information such as pictures, URLs and videos. Users can comment on posts
to create discussions with other users or to add information to them. To
be able to communicate with another user (e.g. writing posts on her wall
and commenting on her posts or photos), a user must obtain her friendship.
A friendship is a bi-directional relation that requires the acceptance of the
involved users. Users can visualise a summary of the activity of their friends
through a special page called a news feed. This page presents real-time
notifications describing the activities performed by friends, including posts
and the comments they create, photos they add, etc. Direct communication
between Facebook users is provided through posts, which can be written on
the wall of other users. Posts can also contain references to multiple users.
Private communications are provided by a chat called messenger. Facebook
also provides other mechanisms to communicate online, such as voice and
video calls. A widely used feature of Facebook is the like button, which
allows people to express their favourable opinion about contents (e.g. posts,
pictures).
Twitter is an online social networking and microblogging service
founded in 2006, with roughly 300 million monthly active users as of
the second quarter of 2014 [3]. In Twitter, users can post short messages
(with at most 140 characters) called tweets. Users can automatically receive
notifications of new tweets created by other users by ‘following’ them (i.e.
creating a subscription to their notifications). People following a user are
called her followers, whilst the set of people followed by the user are her
friends.
Tweets can be enriched with multimedia content (i.e. URLs, videos and
pictures) and by some special marks. Specifically, a tweet can reference
one or more users with a special mark called a mention. Users mentioned
Introduction
3
in a tweet automatically receive a notification, even though they are not
followers of the tweet’s author. Users can also reply to tweets. In this case,
a tweet is generated with an implicit mention to the author of the replied
tweet.
In Twitter, users can retweet tweets, or, in other words, forward tweets to
all their followers. Each tweet can be assigned to a topic through the use of
a special character called hashtag (i.e. ‘#’) placed before the text indicating
the topic. Hashtags are used by Twitter to classify the tweets and to obtain
trending topics, which can be visualised and searched for through a special
page. A trending topic is a word, phrase or topic that begins to be mentioned
at unusually high frequencies.
1.2 OSNs IN THE CYBER-PHYSICAL CONVERGENCE SCENARIO
Without any doubt, OSNs, like Facebook and Twitter, have deeply changed
the way people interact with each other, from teenagers to older folks.
Perhaps more surprisingly, the cultural change they have enacted is going
far beyond a simple mutation in the way we express ourselves and communicate. Every action which involves a social interaction can now be done
through OSNs, such as looking for a new job, advertising something, or
organising events, just to mention a few examples. In addition, we have
access to OSNs potentially from everywhere, and all the time, thanks to the
smart mobile devices in our pockets.
The use of mobile and pervasive devices is affecting the development
of our ecosystems, by constantly interlinking the cyber and the physical
realities in which we are immersed. Information related to the physical
world is captured through mobile devices, and then transferred to the
cyber world, affecting the state of virtual applications and services, which,
in turn, can modify or adapt the physical world around us through actuators. This is contributing to a gradual convergence toward a cyberphysical world (CPW) [4]. This convergence is paving the way for the
creation of innovative applications, which, by exploiting the physical and
the social contexts of their users, can improve services in the cyber
world.
In a converged CPW, physical events and actions affecting the personal
and social spheres of users influence the way information is handled in
the cyber world. Humans are at the core of this process, as, through the
4
Online Social Networks
use of smart devices, they capture aspects of physical events by creating
content (e.g. pictures, videos, text) and transferring them to the cyber
world. Social media provide a powerful way of performing these actions,
supporting a user-centric communication paradigm whereby people actively
contribute to the creation and diffusion of information, influenced by the
social structures that exist in our society. This places OSNs at the core of the
CPW scenario. The analysis of OSNs is important for two main reasons. On
the one hand, it is useful for understanding human social behaviour in a new
virtual environment, and the social phenomena arising in this environment.
On the other hand, it can help to create new human-centric services
and applications which exploit the knowledge acquired from the study
of OSNs.
As an example of how the study of OSN structures can be useful
for understanding online social phenomena, we can consider the impact
that OSNs are already having on information diffusion. Studies conducted
hitherto on the global structure of OSNs indicate that they show typical
properties of ‘small-world networks’, with short average distance between
users, and high clustering coefficient. Moreover, OSNs show long-tailed
distributions of the number of social connections per user (i.e. most people
regularly contact only a few individuals, but a small number of people
have a very large number of contacts). In addition, almost every user
is reachable from all the other parts of the network, thus forming a
connected ‘giant component’. This results in a very favourable condition
for the diffusion of information, and is placing OSNs amongst the preferred
communication channels for advertising, rapidly replacing traditional means
such as the television and the radio. Despite these results, designing humancentred services by exploiting OSN structural properties is still in its
infancy, and many more areas can be foreseen where this approach will be
exploited.
In addition, from the standpoint of OSN analysis, significant effort has
been put to analyse global properties of OSNs (which we shall describe
in more detail in the rest of the book). However, from the standpoint of
individuals, we still do not have a clear view of the effects of the use
of OSNs on the structure of our personal social networks, and on our
capacity for handling social relationships. Undoubtedly, OSNs are powerful
means in that they allow us to connect, for example, with old classmates,
or friends from overseas – individuals whom it would be too expensive
to contact using other more conventional communication means. What is
Introduction
5
more difficult to assess is whether OSNs are also improving our social
capacity, perhaps by increasing the total number of relationships we can
actively maintain. It could be that OSNs simply represent another tool for
maintaining our social relationships, one that is certainly very useful but
perhaps not able to deeply alter the structure of our social system, due to
cognitive or other constraints on our behaviour. A natural starting point,
then, for the investigation of this is the analysis of the structural properties
of personal social networks of OSN users, called egocentric networks or
simply ego networks.
1.3 EGO NETWORKS ANALYSIS AND THE SOCIAL BRAIN
HYPOTHESIS
Ego networks govern the relationships between a user (ego) and her social
peers (alters) and are therefore one of the fundamental building blocks that
determine social behaviour in any type of human social network. In offline
environments (outside OSNs), it has been found that the structural properties
of ego networks are highly constrained. Specifically, our social capacity is
bounded by a combination of the size of the human brain and of the limited
time that can be allocated for the management of social relationships. These
findings constitute the basis of the social brain hypothesis (SBH), which
identifies the causes of brain evolution in the increasing ‘computational’
demands of social systems – i.e. on the fact that humans had to build larger
and larger social networks as a key strategy of their evolutionary path, and
that this required more ‘computational resources’ and thus bigger brains [5].
This hypothesis is in contrast with conventional wisdom over the past
centuries, which assumed that the brain evolved to cope only (or mainly)
with ecological problem-solving tasks such as how to make tools. The SBH,
as opposed to other hypotheses, is able to explain why humans maintain
such an expensive brain, which consumes about 20% of their total daily
energy intake. Animals showing complex social processes such as tactical
deception and coalition formation also have large brains, although the real
driver for brain size seems to be the evolution on bonded social relationships
based on closely intimate social relationships [6, 7]. This is particularly
true for the neocortex, the part of the brain associated with reasoning and
consciousness. Evidence of the SBH is provided by findings on primates,
which highlight a correlation between neocortex size and social group size,
a proxy of social system’s complexity, as well as various aspects of social
behaviour [8].
6
Online Social Networks
In human ego networks, social relationships are not ‘flat’, in the sense
that their importance is not evenly distributed among alters. On the contrary, the internal structure of ego networks show a series of nested subnetworks in which the strength of social relationships, as in large-scale
social networks, follows a long-tailed distribution. This generates a series
of recognisable concentric circles of alters around individuals, coinciding
with these sub-networks. These circles (or layers) are explained by the SBH
as the formation of a series of alliances to maintain cohesion and stability in
the social groups.
1.4 AIM OF THE BOOK
Even though OSNs have been largely studied in the literature, there are still
no detailed results on the structural properties of online ego networks. The
analysis of such properties could reveal important aspects of OSNs, and of
human social behaviour in general. In fact, if online ego networks showed
the same properties found by previous studies of offline social networks,
this would indicate that they are controlled by the same cognitive and time
constraints governing the offline world. In essence, although OSNs allow
us to establish and maintain a potentially infinite number of connections,
the effective number of relationships that we actively maintain could still be
limited, as in other environments, due to our constrained nature. If this was
true, we would be able to better predict how OSNs will evolve, and how
people will behave. This is, of course, of great importance for the creation
of novel online services.
This book presents extensive analyses on the structural properties of ego
networks in Facebook and Twitter. These analyses have a double aim. On
the one hand, we aim to provide a detailed analysis of ego networks in
OSNs. This allows us to check whether or not OSNs radically change the
structures found offline, and thus test the SBH in a completely different
social environment. On the other hand, we want to provide understanding
of human social behaviour in OSNs as guide to the optimisation of novel
services based on OSNs.
The book also provides a brief but complete review of the most recent
methods in social networks and ego networks analysis. We think that this
could provide a useful source for students and researchers approaching the
analysis of social networks from a multidisciplinary perspective, bringing
together aspects of social networks which remained disjointed until now.
Introduction
7
1.5 BOOK STRUCTURE
The book starts with a review of the most recent advances in the social
network literature, reported in Chapter 2. This chapter provides the reader
with the needed tools for a correct understanding of the analyses presented
in the following chapters, and motivates the need for novel studies on online
ego networks. Then, we present our contribution in the field, reporting the
results extracted from our most recent publications, which relate to the
structural analysis of ego networks in Facebook (Chapter 3) and Twitter
(Chapter 4), respectively. In Chapter 5, we examine the evolutionary
dynamics of social networks over a longer time scale within a Twitter
environment, in order to study the growth and decay of relationships in more
detail. Finally, in Chapter 6, we summarise the results presented in the book,
and discuss how these results could be exploited to improve online services
and create the bases for novel analyses on social networks.
CHAPTER
2
Human Social Networks
2.1 INTRODUCTION
This chapter presents an overview of the main characteristics of social
networks, and how they have been studied. It is organised in terms of
two main axes: (i) the level of the analysis, which can be macroscopic
(i.e. on complete social networks) or microscopic (i.e. on social links of
individuals), and (ii) whether or not the importance of social relationships
(the tie strength) is taken into account.
Macroscopic analyses seek to understand the global properties of the
whole structure of social networks. They use indices that capture these
properties without the need to analyse the details of each and every node
in the network, as that is often unfeasible when there are a large number of
elements in the network.
Microscopic studies are aimed at characterising social networks from the
perspective of a single individual, considering only the portion of network
formed of the set of relationships of that individual. These personal social
networks are also called ego (or egocentric) networks. Ego networks are
studied so as to understand social differences at the personal and relational
level.
On the second axis, the analysis of tie strength permits us to refine the results found on social networks by considering differences in the importance
of social links. Specifically, social networks can be presented as weighted or
unweighted, where the former refers to the fact that weight of the tie reflects
the level of interaction between any pair of nodes and the latter refers to the
fact that the ‘weight’ of the tie is considered only to be all-or-none. Graphs
weighted by the level of interaction between nodes are called ‘interaction
graphs’, whilst unweighted social network graphs are called ‘social graphs’.
In microscopic studies, the tie strength has a fundamental role since it
permits us to differentiate single social relationships, the building blocks of
ego networks. For this reason, in the literature there are only a few examples
of microscopic analyses on unweighted ego networks, and in this book we
present only analyses on weighted ego network graphs.
9
10
Online Social Networks
After we have discussed this classification in more detail, the chapter
is divided into four sections. Section 2.2 presents the key properties of
social networks from a macroscopic point of view, considering the networks
as unweighted graphs. Macroscopic studies typically use tools derived
from graph theory and complex networks analysis, which are described in
Section 2.2.1. Section 2.2.2 presents in detail the fundamental macroscopic
properties found through the analysis of unweighted social networks. Based
on these features, a series of models for the generation of synthetic social
network graphs have been proposed in the literature (see Section 2.2.3). In
Section 2.3, we present the main results found through macroscopic analyses
of interaction graphs. Then, Section 2.4 presents the main properties of ego
networks found through microscopic analyses. Finally, Section 2.5 presents
studies aimed at bridging the gap between macroscopic studies of social
network graphs and microscopic analyses of behavioural and social aspects
of ego networks, which we identify as meso-level analyses.
2.2 MACROSCOPIC PROPERTIES OF UNWEIGHTED
SOCIAL NETWORKS
2.2.1 Complex Network Indices
Complex network analysis is a very extensive topic of research in statistical
physics. Interested readers are referred to [9, 10] for more details.
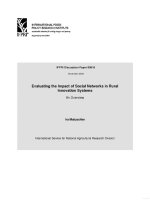
In macroscopic analyses, the social network, such as the very simple one
depicted in Figure 2.1, is seen as a unique global graph. Complex network
methods have been designed to analyse exactly this type of network, and
therefore they are often applied to macroscopic analyses of social networks.
Specifically, in these cases, social networks are expressed in the form of
a graph G(V, E), where a vertex (or node) x ∈ V represents a social
actor, and the set of edges (or links) E contains pairs of elements (x, y)
representing the social relationship between x and y. Social network graphs
can be both directed or undirected. In directed graphs, an edge (or arc)
e = (x, y) represents the social relationship from x to y; note that this is
not necessarily equal to the one from y to x. On the other hand, in undirected
graphs edges are assumed to be bidirectional, and therefore the properties
of a social relationship between two nodes x and y is equal to the one from
y to x.
A network of connected nodes or individuals can be described using a
number of simple indices. One of the most commonly used in social network
Human Social Networks
1
11
4
3
2
5
Figure 2.1 Example of triplets and triangles.
analysis is the degree of a node, which is a measure of the node’s centrality.
Centrality indicates the importance of a node and its influence over other
nodes in the network. Degree centrality is defined as the number of edges
connected to a node. It is important because the degree tells us the number
of social relationships a node has, and therefore how many individuals in a
social network are socially connected. In the case of directed graphs, there
is a distinction between the in-degree, that is the number of incoming edges
of the node, and the out-degree, the number of its outgoing edges.
The path length is another typical index. It can be intuitively seen as
the distance between pairs of nodes in the network. This is important for
understanding phenomena such as information diffusion, since the path
length is directly related to the degree of connectivity of the graph (i.e.
the property of nodes to be connected to each other in a unique graph
component, without forming separate sub-graphs). A path between two
nodes x and y in a graph is defined as a series of edges connecting a sequence
of distinct nodes, where x is the first node of the sequence and y is the last
one. Note that there could exist multiple paths between the same nodes. The
length of a path is measured as the number of edges it contains. The shortest
path between two nodes is the path with the shortest length. The diameter
of a network is the length of the longest ‘shortest path’ between any pair of
nodes in the network.
Two additional centrality indices can be defined using paths. The first
is the closeness of a node. It is calculated as the inverse of the sum of the
length of the shortest paths between the node and all the other nodes in the
network. Nodes with high closeness are closer to all the other nodes than
is the average node. For this reason, they have more influence and a more
12
Online Social Networks
central role. Another measure of centrality based on paths is the betweenness
of a node v, g(v), defined as:
g(v) =
s=v=t
σst (v)
σst
(2.1)
where σst is the number of shortest paths from s to t and σst (v) is the
number of those paths in which one of the nodes is v. The node betweenness is particularly important in the analysis of information diffusion, for
example, for identifying influential nodes or opinion leaders. In fact, since
nodes with high betweenness are placed on a large number of paths, they
are often fundamental to the spread of information, and act as opinion
leaders.
Another important index in complex network analysis is the degree of
clustering, which indicates how much nodes are interconnected to each
other. Intuitively, a maximally clustered network is a full mesh, where all
nodes are directly connected to all the other nodes. There are two clustering
indices: the global and the local clustering coefficients. The global clustering
coefficient of a network, C, is defined as follows:
C=
3 × Number of triangles
Number of connected triplets
(2.2)
where a triplet of vertices consists of three connected vertices. For example,
nodes 1, 3 and 5 in Figure 2.1 form a triplet. On the other hand, a triangle is
composed of three vertices connected to each other by three edges, as nodes
1, 2 and 3 in Figure 2.1. C is also referred to as transitivity.
The local clustering coefficient of a node i, Ci , measures how much i and
its neighbours are clustered, and it is defined as follows:
Ci =
Number of triangles centred at i
Number of triplets centred at i
(2.3)
The average of the local clustering coefficients of all nodes in the
network, defined as C = 1n ni=1 Ci , where n is the number of nodes in
the network, is an alternative to the global clustering coefficient. However,
C is more influenced by nodes with low degree compared to C [9].
Finally, we briefly highlight other indices often used in social network
analysis. The correlation between the degrees of adjacent vertices, also
called the assortativity [11], tells us whether the degree of the individual
Human Social Networks
13
nodes is similar to the degrees of their neighbours. The presence of
assortativity has an important impact on the circulation of information or
the spread of diseases in social networks. The infection of a node with high
degree will cause a very quick spread of the disease if the neighbours of
the infected node also have high degree; as a result, the disease can reach
a large proportion of nodes in the network just in a few steps. In such
cases, quarantining hubs and their direct neighbours can prevent large-scale
epidemics.
The number of connected components in the graph and the distribution
of their size are also important indices for characterising social networks.
Social networks are often formed of a giant component of connected nodes
that includes most of the nodes of the network, and a small fraction of
disconnected sub-networks or single nodes [12]. The presence of a giant
component of connected nodes ensures reachability of the nodes through
chains of social links and is often essential for the diffusion of information.
Another set of indices indicates the presence of communities in the
network, that is, subsets of nodes with many connections to each other
and fewer connections to other subsets of nodes. Communities represent
an internal organisation and subdivision of the network. Many different
definitions of community have been formulated over the years and different
indices have been defined to identify them. However, recent experiments on
large-scale graphs evinced that not all the proposed community detection
algorithms show a good performance, and only few of them lead to accurate
results [13]. For a complete description of these methods we refer the reader
to [14].
2.2.2 Key Results From Social Network Analysis
The tools derived from complex network analysis have allowed researchers
to discover some characteristic topological properties that have been observed in a variety of social networks, and which are considered to be
distinctive features of social networks.
Stanley Milgram pioneered social network analysis by empirically measuring the average shortest path length between people in the USA through
his famous ‘small-world’ experiment. Milgram asked a random set of
participants living in Nebraska to send a package to a person in Boston,
MA, by forwarding it only to people they directly knew, and whom they
thought might be closer to the final recipient than they were. Each time
14
Online Social Networks
an intermediate peer received the package, she had to add her name on
it before sending it on, so that the number of intermediate steps could be
traced. Some packages got lost, but those that reached the final destination
had been through an average number of just six steps [15].
Milgram’s findings were the first indication that social networks show
an average shortest path length of around six. This fact is often identified
as the ‘six degrees of separation’, and has been ascribed iconic status as
a theoretical ‘fact’. Short paths are a typical feature of many complex
networks. In general, a network is said to have short paths if the average
shortest path length is proportional to the logarithm of the number of nodes
in the network, see Equation 2.6. A small average shortest path length in
a social network is a favourable condition for the diffusion of information
since it implies that messages travelling through chains of social links can
reach any node in a few hops.
An average shortest path length of around six has been found in several
studies of large-scale social networks. One of the most noticeable of these
is represented by the work reported in [16], where the authors found that
the social network representing contacts in Microsoft Messenger exhibits an
average shortest path length of 6.6. A recent analysis of the entire Facebook
social network graph, as of 2011, revealed an average shortest path length
of 4.7 [17]. Similar results have also been found in analysis of Twitter
social networks based on following relationships between users [18, 19].
Twitter shows a slightly smaller average shortest path length compared to
Facebook, perhaps due to the peculiar nature of following relationships,
which probably represent a weaker social relationship between users than is
the case for Facebook friendships. Interestingly, Google+ shows an average
shortest path length around 5 [20], appearing to be similar to Facebook and
Twitter. These results seem to indicate that in online social networks (OSNs)
the average distance between people can be even shorter than in offline
environments, and consequently information could travel faster through
social media compared to more traditional communication channels. Notice
that these analyses only consider unweighted social graphs, where an edge
indicates only the mere existence of a social contact between users. For this
reason, the average shortest path length could be influenced by the presence
of many inactive social relationships or ones with a very low frequency of
interaction. For some types of information, these links might not be used,
resulting in effective path lengths longer than those social network analysis
would predict. We consider this point in more detail in Section 2.3.
Human Social Networks
15
Thanks to the work done by Duncan Watts and Steven Strogatz, social
network graphs have been further characterised. In fact, compared to
other kinds of networks such as biological and technological networks,
social networks show not only a small average shortest path length but
also high clustering [21]. In Section 2.2.3, the difference between high
and low values of clustering will be discussed in more detail, with a
comparison between random graphs and other types of structured networks.
Here we recall that, with the presence of high clustering, there is a high
probability that two neighbours connected to a node will also be connected
to each other. A high clustering coefficient has been found in Microsoft
Messenger [16], Facebook [17], Twitter [18], Google+ [20] and many other
social networks [22]. Networks showing both a small average shortest path
length and high clustering are called small-world networks. Notably, many
social networks (including Facebook and Twitter [17, 18]) appear to be
small-world networks.
Albert-László Barabási and Réka Albert observed that various social
networks show node degree distributions that have a power law form [23].
A power law function has the following form:
f(x) = Cx−α
(2.4)
where α is called the scaling exponent, and ‘scaling’ means that a power
law function satisfies f(cx) ∝ f(x). That is to say, the function’s argument
changes the constant of proportionality, but the shape of the function itself
remains the same. This property is called scale invariance, and it leads to a
linear relationship between the logarithm of both f(x) and x. A power law
function plotted on logarithmic scale for both axes appears as a straight line.
The value of α controls the shape of the function, and thus the slope of the
straight line on a logarithmic scale.
A quantity x obeys a power law if it is drawn from a probability
distribution p(x) with the following form:
p(x) ∝ x−α
(2.5)
Typically, estimated values of α derived from empirical data sets with
quantities following power laws lie between 2 and 3 [24]. These values
are typical also for node degree distributions in social networks. In power
law node degree distributions, the higher the values of α, the lower the
probability of having nodes with high degree.
16
Online Social Networks
Networks with power law degree distributions are called scale-free
networks. In these networks, most of the nodes have a very small degree,
but there are a few nodes (called hubs) with many connections. The study
of a large-scale phone call social network revealed a power law node degree
distribution, with the presence of small local clusters typically grouped
around a high-degree node [25]. Power law degree distributions have also
been found in social networks formed of contacts extracted from email
exchanges [26] and in OSNs like Facebook [27] (although this has been
later contradicted in [17]) and Twitter [18], among others [22]. Scale-free
networks have a higher robustness to fault tolerance compared to other kinds
of networks, as observed in [16]. In fact, the failure (or removal) of random
edges does not drastically modify the structure of the network in such cases.
To deeply modify the graph, hubs need to be identified and removed, and the
probability of selecting their edges from a random selection is lower than
the probability of selecting edges from low degree nodes, since the latter are
more common than the former [28]. Scale-free networks could, nonetheless,
suffer from targeted attacks on hubs.
Social networks also show positive assortativity, as found in the Facebook social graph [17, 27], Twitter [19] and other OSNs, including Flickr,
YouTube, LiveJournal and Orkut [22]. Nodes in social networks are, on
average, linked to similar others, not only in terms of node degree, as already
seen for the assortativity. This general property is known as homophily [29],
and is known to directly influence many aspects of social networks. Homophily is known to be the result of two underlying mechanisms: selection
and social influence, where the former indicates the propensity of people
to create new social relationships with people who are similar to them, and
the latter indicates that people influence the behaviour of their friends and,
as a result, socially connected people tend to become similar to each other.
In their seminal work, Christakis and Fowler [30] analysed the interplay
of these effects in a social network with information about health-related
outcomes. They found that obese and non-obese people tended to clusert in
the network, in accordance with homophily. In addition, they found that
selection alone is not enough to explain this clusterisation, which is, in
part, the result of social influence. This means that obesity (and perhaps
other behavioural-related health conditions) may be related to some kind of
intrinsic spreading effect of social networks [31].
The analysis of many different social networks (e.g. the studies on
Facebook [32] and Microsoft Messenger [16]) highlighted the presence of
homophily in different characteristics of the users. Moreover, the presence
Human Social Networks
17
of a giant component is clearly visible in the social graphs of Facebook [17],
Twitter [19], mobile phone networks [25] and Microsoft Messenger [16].
Another property of the topology of social networks is the presence of
spatial constraints. Nodes in the same cluster are more likely to be spatially
close to each other, whereas nodes in different clusters are usually in
different geographical regions [33]. Also the mobility of nodes has been
found to play a central role in the formation of social relationships, since
nodes encountering each other can exchange information and form or
strengthen social relationships [34].
In Table 2.1, we report the properties of several OSNs (e.g. Facebook and
Twitter). For comparison purposes, we also report some reference results
from the analysis of offline social networks, as well as key results related
to the network structures of the Internet itself, or Internet systems such as
World Wide Web (WWW). This allows us to summarise the key properties
highlighted in the literature about the structure of OSN unweighted graphs,
and to compare them with other types of networks analysed using a similar
approach. In the literature, initial results on node degree of social networks
seemed to indicate that power law distributions are a distinctive feature of
social and technological networks. However, several analyses found results
that contradict this conventional assumption (e.g. the work by Ugander
et al. [17] on the Facebook social graph). In accordance with what we
have already discussed in this chapter, the average shortest path length of
OSNs appears to be shorter than that found in other kinds of networks, for
example, the WWW and some co-authorship networks. Note that the coauthorship network from biology shows a very short average shortest path
length compared to typical values for offline social networks. This could
be due to the number of coauthors per paper, since this is usually much
higher in biology than in other disciplines (see />data_metrics_comparison.htm), and it is higher than the typical group size
in humans. The difference in terms of average shortest path length between
OSNs and other kinds of social networks, however, seems to be true only
when we consider the unweighted social graph of OSNs. When interaction
graphs are considered instead, the average shortest path length is in line with
the results found offline and with the theory of six degrees of separation.
Nevertheless, only a few analyses have been performed to highlight this
difference (e.g. the work by Wilson et al. [27]), and more work is needed
to verify it. Although the values of clustering coefficient for the different
networks can vary significantly, all of them denote high clusterisation in
the network. Since OSNs show high clustering and short paths they can
Table 2.1 Structural Properties of Several Social Networks
Networka
Vertices
Edges
Degree Distributionb
Avg. Shortest Path
Diameter
Local Clustering
Global Clust.
Giant Comp. Size (%)
Assortativity
Facebook [17]
721M
68.7G
Long-tailed with cutoff
4.7
–
–
–
99.91
0.226
Social
10.7M
240M
Long-tailed
4.8
13.4
0.164
–
–
0.17
Interaction
–
–
PL 1.5 < α < 1.8
5 < l < 10
18 < d < 25
0.03 < C < 0.08
–
–
0.18 < ρ < 0.23
Twitter [19]
41.7M
1.47G
PL α = 2.276
4.12
18
–
–
–
–
Twitter [18]
175M
20G
PL α = 1.35 (i)
4.17 (u)
18
–
–
92.9
PL α = 1.28 (o)
4.05 (d)
Facebookc [27]
−0.296 (i)
0.272 (o)
LN μ = 2.8, σ 2 = 3.4 (i)
LN μ = 3.6, σ 2 = 2.9 (o)
Google+ [20]
35.1M
575M
PL α = 1.35 (i)
5.9 (d)
19 (d)
PL α = 1.2 (o)
4.7 (u)
13 (u)
–
–
71.8
–
Messenger [16]
180M
1.34G
PL α = 0.8
6.6
29
0.137
–
99.9
–
Flickr [22]
1.85M
22.6M
PL α = 1.78 (i)
5.67
27
–
–
–
0.202
PL α = 1.74 (o)
Yahoo 360! [35]
5M
7M
PL shape
8.26
–
–
–
–
–
Myspace [36]
100K
6.85M
PL α = 3.1
2.7
–
0.26
–
–
0.02
Orkut [22]
3.07M
224M
PL α = 1.5 (i)
4.25
9
–
–
–
0.072
5.88
20
–
–
–
0.179
PL α = 1.5 (o)
LiveJournal [22]
5.28M
77.4M
PL α = 1.65 (i)
PL α = 1.59 (o)
Youtube [22]
1.16M
4.95M
Cyworld [36]
12M
191M
Sina Weibo [37]
Renren [38]
Co-authorship [39]
Biology
Physics
Mathematics
Email [40]
Phone calls [25]
WWW [41]
80.8M
42.1M
7.2G
1.66G
5.1
21
–
–
–
−0.033
3.2
–
0.16
–
–
−0.13
4.63
5.38
14
–
–
0.063
–
–
–
76.8
–
0.15
92
85
82
–
–
91
0.13
0.36
0.12
–
–
–
–
–
–
4.6
24
–
0.066
–
5.9
20
–
0.43
–
7.6
27
–
0.15
Long-tailed
–
–
–
0.168
PL α = 8.4
–
–
–
–
PL α = 2.1 (i)
6.83
28
–
–
PL α = 2.72 (o)
Internet [42]
3.89K
5.01K
PL α = 0.48
–
–
–
–
a Letters in parentheses indicate whether the graph is directed (d) or undirected (u) and whether the in-degree (i) or the out-degree (o) is analysed.
b Fitted parameters for power law (PL) or log-normal (LN) distributions, or indication on the shape of the distribution.
c Average values out of several Facebook regional networks. The number of vertices and edges are the total sum for all the regional networks.
1.52M
52.9K
253K
16.9K
4.6M
203M
–
–
–
57K
7M
1.47G
PL α = 1.99 (i)
PL α = 1.63 (o)
PL α ∼ 2 (first region)
α ∼ 5 (second region)
PL α = 2.33 (i)
PL α = 3.5 (limited region)
20
Online Social Networks
be considered small-world networks, as highlighted by several studies
in the literature. Interestingly, the size of the giant component ranges
between ∼70% and more than 99.9%, denoting a significant difference
amongst networks in their ability to interconnect nodes with each other,
and form a unique connected component. Notably, this variation can be
noted in all types of networks, indicating that it is not characteristic of
a specific environment. As far as assortativity is concerned, most of the
networks are weakly assortative (i.e. with positive assortativity), with a few
exceptions showing the opposite. This means that nodes tend, with a weakly
marked preference, to establish social relationships with nodes with similar
degree.
From these results, we can note that OSNs show structural properties
similar to other types of social and technological networks. This indicates
that, at the microscopic level, OSNs and offline social networks seem to
have the same structure.
2.2.3 Models for the Generation of Network Graphs
Besides observing social networks though complex network indices, many
studies have proposed mathematical models to generate graphs that present
the key features observed in real networks.
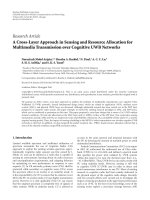
After observing the properties of small-world networks, Watts and Strogatz (WS) introduced a generative model of small-world network graphs,
known as the WS model. This model starts from a regular ring lattice
graph, such as the one shown in Figure 2.2(a), where all the nodes have
the same degree and, when placed on a ring, are connected only to their
1
10
1
2
10
1
2
10
2
9
3
9
3
9
3
8
4
8
4
8
4
7
(a)
5
6
7
(b)
5
6
7
(c)
5
6
Figure 2.2 Network graphs generated by the Watts–Strogats model with different parameters. (a) The network is a
regular lattice and no modifications have been applied. (b) Some links have been modified so as to obtain a small-world
network. (c) The modification of a high percentage of links leads to a random graph.