WRITING TASK 1 LINE GRAPH
Bạn đang xem bản rút gọn của tài liệu. Xem và tải ngay bản đầy đủ của tài liệu tại đây (1.23 MB, 40 trang )
WRITING TASK 1
LINE GRAPH
Ms.Thi’s English Classes
LƯU Ý KHI VIẾT BÀI DẠNG LINE GRAPH
1. Bố cục bài viết sẽ giống các bài Task 1 khác:
+ Introduction: paraphrase câu đề bài. Tức là viết lại câu của đề bài sử
dụng từ vựng của bạn.
+ Overview: tìm 2 đặc điểm chung của biểu đồ. Thường với biểu đồ dây
bạn có thể lưu ý một số đặc điểm sau để tìm cho nhanh:
Đặc điểm về xu hướng: nhìn từ đầu năm đến cuối năm xem xu hướng
chung của dây là gì ? Là tăng ? giảm ? hay dao động liên tục ?
Đặc điểm về dây nổi bật nhất: ví dụ đề bài cho tầm 3,4 dây tìm xem
dây nào nằm cao nhất, thấp nhất, hoặc thay đổi lớn nhất...
Ms.Thi’s English Classes
LƯU Ý KHI VIẾT BÀI DẠNG LINE GRAPH
+ Body 1 : 2 khổ thân bài của một bài biểu đồ dây thường sẽ
là mô tả số liệu, xu hướng của số liệu. Lưu ý luôn luôn so sánh
các thông tin với nhau, không mô tả riêng rẽ.
+ Body 2: như trên
2. Sử dụng quá khứ đơn (ví dụ: increased, fell..) cho các
năm trong quá khứ, 'is expected/predicted to" khi đưa ra
dự đoán cho các năm trong tương lai.
Ms.Thi’s English Classes
1
Oil use of major consumers
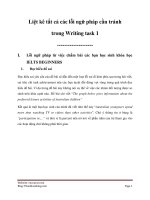
The graph below gives information about total oil use of 4 main
consumers from 2009 to 2030
Ms.Thi’s English Classes
Reprot Plan
Paraphrase question: one sentence.
Summary paragraph: 2 key features: [1] trends in the graph:
decrease in daily oil consumption in the US and Western Europe
and Japan; increase in in the figures for China and the Middle
East [2]highest: the US.
Paragraph 3: compare the amount of oil consumed per day in
the four areas in 2009 – report all figures.
Paragraph 4: compare the figures in all region in 2030 – report
all data.
Ms.Thi’s English Classes
ANSWER
The line graph compares four areas in terms of the amount of
oil consumed per day in a 22-year period starting in 2009.
Overall, from 2015, oil consumption in Western Europe/Japan
and also in the US is predicted to decline, in contrast to the
expected increase in China and the Middle East. The US will
remain the major consumer throughout the period.
In 2009, the number of barrels of oil consumed daily in the US
totalled almost 10 billion. The figures were considerably lower
for Western Europe/Japan at 4 billion, and China and the
Middle East at 2 billion barrels each. While consumption fell
Ms.Thi’s English Classes
in Western Europe/Japan by 2015, and remained stable in the
US, there was an increase in oil consumption in China and the
Middle East.
By 2030, the number of barrels of oil consumed daily in the US
is anticipated to fall to about 4 billion, while consumption is
expected to decrease to 2 billion barrels in Western
Europe/Japan. By contrast, a rise in the amount of oil
consumed is predicted in the Middle East, reaching a peak of 3
billion barrels per day in 2030. This is slightly lower than the
projected figure for China.
199 words
Ms.Thi’s English Classes
Vocabulary note: Về từ vựng
- ‘in terms of’ is a very useful phrase in task 1 reports. It is a clear
and simple way to indicate which category you are referring to. See
Simon’s blog of May 28, 2015.
- By contrast/ In contrast: these can be used to describe
opposite/different trend.
- ‘figure’ - this can be used in lots of situations, to refer to a
number, an amount or a percentage/proportion/rate. See Simon’s
blog of January 31, 2013.
- ‘equal…each’: each needs using when describing same data.
- ‘respectively’: is a synonym of ‘in turn’ to list.
Ms.Thi’s English Classes
Lưu ý:
Số lượng số liệu phải bằng số lượng danh từ.
Số liệu nào đứng trước thì danh từ của số liệu đó phải đứng trước.
- ‘a (number)-year period starting in/ ending in/
between…and…: describe a period of time
- Paraphrase: the amount of oil consumed, the number of barrels
of oil used, daily oil consumption, in demand
- Remained stable/reached a peak: other vocabulary to describe
different trends.
Remain stable: không đổi
Reached a peak: chạm đỉnh
Ms.Thi’s English Classes
Grammar notes: Về ngữ pháp
- Use verbs: increase/decrease/rise/decline: ‘the percentage of
expenses on food rose significantly to 20% in 2010.’
- Các trạng từ thể hiện sự tăng/ giảm đáng kể: dramatically,
significantly, sharply, remarkably…
tăng/ giảm ít, không đáng kể: slightly, unremarkably…
tăng/ giảm chậm rãi: slowly. gradually
tăng/ giảm đều: steadily
Ex: ‘the percentage of expenses on food rose significantly to
20% in 2010.’
Ms.Thi’s English Classes
Grammar notes: Về ngữ pháp
- Use nouns: increase/decrease/rise/growth/downward trend/
upward trend:
‘There was a decrease in the market share of apples in Japan in 2005.’
- Place (countries/ cities/…) / time (the year…) + witnessed/
saw/ experienced.
+ a/an + N (increase/decrease/…): the US experienced a significant
increase in exports in 2007.
Ex: the US experienced a significant increase in exports in 2007.
- Data…, compared to…: this is used to compare at least 2
categories or objects.
- Is predicted/ anticipated/ expected: describe data in the future.
Ms.Thi’s English Classes
2
Price changes for fresh fruits and vegetables, sugars
and sweets, and carbonated drinks.
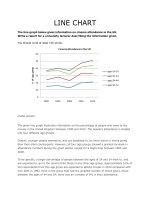
The graph below shows relative price changes for fresh fruits
and vegetables, sugars and sweets, and carbonated drinks
between 1978 and 2009.
Summarise the information by selecting and reporting the
main features, and make comparisons where relevant.
Write at least 150 words.
Ms.Thi’s English Classes
Ms.Thi’s English Classes
TASK 1 PLAN
paraphrase task heading
summary paragraph – 2 key features: [1] prices for 3 food
groups and CPI increased [2] only prices for fresh fruits
and vegetables were higher than overall increase in CPI
over the period.
compare sugar/sweets and carbonated drinks trend with
CPI
report on fresh fruits and vegetables trend.
Ms.Thi’s English Classes
ANSWER
The line graph provides information about changes in price in
the USA of three different food product groups from 1979 to
2009, and the overall trend in the consumer price index over
this 30-year period.
Overall, it is clear that prices increased for the three food
product groups, despite fluctuations. Only the increase in the
prices for fresh fruits and vegetables was significantly higher
than the rise in the general consumer price index.
Ms.Thi’s English Classes
All the lines on the graph have the same starting figure in
1979. Over the
period, the consumer price index rose
steadily from around 60 in 1979 to over 200 in 2009. Prices
for sugar and sweets and carbonated drinks showed similar
trends.
Although
their
prices
also
rose,
they
were
consistently below the consumer price index average after
1987. After many minor fluctuations, the number for sugar
and sweets was 200 on the graph in 2009, higher than the
final figure for carbonated drinks at 150.
Ms.Thi’s English Classes
Prices rose sharply for fresh fruits and vegetables,
particularly after 1989. From the same figure of about 60 at
the start of the period, the prices finished at roughly 330 on
the index in 2009.
195 words.
Ms.Thi’s English Classes
VOCABULARY
overall: [adjective] [nhìn chung] general, including all the things
which we should consider. (Ex: The satellite pictures gave the
weather experts an overall view of the weather worldwide.)
trend: [noun] [xu hướng] a change which takes place over a period
of time. (Ex: There is a general trend towards using computers more
and more in language teaching.)
fluctuations: [noun] [dao động, thay đổi bất thường] changes in
number or amount, especially when these changes are big. (Ex: Oil
prices change every day, so it is impossible to predict the.)
fluctuations which are likely to occur next year.
Ms.Thi’s English Classes
significantly: [adverb] [quan trọng, trọng đại, đáng chú ý] in a
large or important way. (Ex: I had not seen my cousin for 20 years,
and of course his appearance had changed significantly.)
steadily: [adverb] [vững chắc, đều đặn] in an even and regular
way. (Ex: Keeping the same speed, he drove steadily until he reached
his destination.)
consistently: [adverb] [chắc chắn, kiên định] always in the same
way. (Ex: As a result of increasing crime, many people in Brazil have
been consistently arguing for a change in the law.)
sharply: [adverb] [mạnh mẽ] suddenly and by a large amount.
(Ex: Temperatures in the desert fall sharply at night.)
Ms.Thi’s English Classes
3
The consumption of fish and some different
kinds of meat
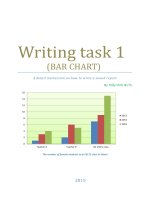
The graph below shows the consumption of fish and some
different kinds of meat in a European country between
1979 and 2004.
Summarise the information by selecting and reporting the
main features, and make comparisons where relevant.
Ms.Thi’s English Classes
Ms.Thi’s English Classes
ANSWER
The line graph illustrates the amount of four different types
of food which people in a European nation consumed from
1979 to 2004.
Overall, fish was the least commonly used food in the
European country throughout the period shown. Also, the
expenditure on beef, lamb and fish decreased, while there
was a fluctuating increase in the figure for chicken.
Ms.Thi’s English Classes
It can be seen from the graph that in 1979, the amount of beef
which was consumed was the highest, at about 220 grams per
person per week. The figures for chicken and lamb were lower,
at under 150 grams and exactly 150 grams respectively.
However, fish accounted for the lowest number with only
about 60 grams eaten (*)
In the period between 1979 and 2004, the country witnessed
a significant growth to around 250 grams in the consumption
of chicken. By contrast, around 50 grams of lamb was eaten,
compared to about 40 grams of fish in 2004.
Ms.Thi’s English Classes
Although the consumption of beef reached a peak of about 240
grams in 1983, this fell steadily to just over 100 grams in 2004.
181words
(*)
It is OK to write ‘used’, but I prefer ‘consumed/eaten’ because this
explains how they were used. I think that ‘eaten’ is a more precise
synonym if you wish to avoid repetition of ‘consume’ too often.
However, as Simon (ielts- simon.com) points out, we should not
be afraid of repeating some key terms in task 1 if this makes our
report clearer.
Ms.Thi’s English Classes
4
Tourists to England who visited four different
attractions in Brighton.
The line graph below shows the percentage of tourists to
England who visited four different attractions in Brighton.
Summarise the information by selecting and reporting the
main features, and make comparisons where relevant.
Write at least 150 words.
Ms.Thi’s English Classes