DSpace at VNU: Metallic nanoparticles: synthesis, characterisation and application
Bạn đang xem bản rút gọn của tài liệu. Xem và tải ngay bản đầy đủ của tài liệu tại đây (2.17 MB, 14 trang )
Int. J. Nanotechnol., Vol. 8, Nos. 3/4/5, 2011
Metallic nanoparticles: synthesis, characterisation
and application
Nguyen Hoang Luong*, Nguyen Ngoc Long,
Le Van Vu and Nguyen Hoang Hai
Center for Materials Science,
Hanoi University of Science,
Vietnam National University,
334 Nguyen Trai, Thanh Xuan, Hanoi, Vietnam
E-mail:
E-mail:
E-mail:
E-mail:
*Corresponding author
Phan Tuan Nghia and Nguyen Thi Van Anh
Key Laboratory for Enzyme and Protein Technology,
Hanoi University of Science,
Vietnam National University,
334 Nguyen Trai, Thanh Xuan, Hanoi, Vietnam
E-mail:
E-mail:
Abstract: Colloidal sphere-like gold nanoparticles were prepared from an
HAuCl4 aqueous solution by the chemical reduction method and by using
X-ray irradiation, while rod-like gold nanoparticles were synthesised
according to the seed-mediated growth method and by sonoelectrochemistry.
Gold nanoparticles exhibit fcc structure. Sphere-like gold nanoparticles
have a diameter of 20–60 nm, while rod-like gold nanoparticles have an aspect
ratio of 2–4. In UV-vis spectra, the absorption bands related to surface
plasmon resonance were observed. Co-Pt nanoparticles of 5–20 nm were
prepared by electrochemistry, while Fe-Pt nanoparticles with a size of 5–10 nm
were prepared by sonoelectrochemistry. After annealing, these magnetic
nanoparticles showed a high coercivity. The gold nanoparticles were
functionalised for detecting breast cancer cells.
Keywords: gold nanoparticles; Co-Pt nanoparticles; Fe-Pt nanoparticles;
optical properties; magnetic properties.
Reference to this paper should be made as follows: Luong, N.H.,
Long, N.N., Vu, L.V., Hai, N.H., Nghia, P.T. and Anh, N.T.V. (2011) ‘Metallic
nanoparticles: synthesis, characterisation and application’, Int. J. Nanotechnol.,
Vol. 8, Nos. 3/4/5, pp.227–240.
Biographical notes: Nguyen Hoang Luong received his PhD in Solid State
Physics from the University of Hanoi in 1984. He received the Degree
of Doctor of Habilitation from the University of Mining and Metallurgy,
Krakow, Poland, in 1999. He was promoted to the rank of Associate Professor
Copyright © 2011 Inderscience Enterprises Ltd.
227
228
N.H. Luong et al.
in 1996 and to Professor in 2002. He is the author/co-author of over
50 publications in international journals. His research interests include the
magnetic properties of rare-earth intermetallic compounds, synthesis,
characterisation and application of nanostructures based on magnetic and
metallic materials.
Nguyen Ngoc Long received his PhD in Solid State Physics from
Saint-Petersburg University, Russia, in 1972. He was promoted to the
rank of Associate Professor in 1991 at Hanoi University. He is a former
Director of the Centre for Materials Science, Hanoi University of Science,
Vietnam National University. His research interests include the optical
properties of semiconductors, synthesis, characterisation and application of
nanostructures based on semiconductor and metal materials.
Le Van Vu graduated from the Faculty of Physics at the University of Hanoi in
1978, where he subsequently received his PhD in 1994. Currently,
he is an Associate Professor at the Faculty of Physics of the Hanoi University
of Science. His research interests include preparation of nanostructured
materials based on metals and semiconductive metal oxides and their biological
application.
Nguyen Hoang Hai received his PhD in Physics from Universite de
Grenoble 1 – Joseph Fourier and Laboratoire de Magnetisme Louis Neel,
France. Subsequently, he was awarded an NRI Postdoctoral Fellowship, which
he took to the University of Nebraksa, Lincoln. His major interests are
preparation and characterisation of magnetic, metallic nanomaterials for
bioapplications, and for environmental science, biosensors; dynamics
of magnetic phenomena. He has authored more than 30 publications on
international journals. He is now an Associate Professor of the Faculty of
Physics of Hanoi University of Science.
Phan Tuan Nghia is a Lecturer at the Faculty of Biology, Hanoi University of
Science. He received his PhD from the University of Hanoi in 1988 and held a
Postdoctoral position at the International Centre for Genetic Engineering and
Biotechnology (ICGEB) in New Delhi, India (1995–1997), and a Postdoctoral
Associate Research Fellow position at the University of Rochester in
New York, USA (1998–2001). His recent research interests include
investigation and characterisation of antibacterial and antiviral agents,
development of assays for the detection of bacterial and viral pathogens in
humans and molecular characterisation of stress response in bacteria.
Nguyen Thi Van Anh received her PhD in Life Science from Tohoku
University, Japan. She is currently a Researcher at the Key Laboratory
of Enzyme and Protein Technology, Hanoi University of Science. She has
received a research grant for young women scientist by The Third World
Academy (TWAS) of Science (2005–2007). Her major interest is application of
metal nanoparticles in diagnostics and drug delivery.
1
Introduction
Gold nanoparticles (NPs) are very unusual because of their size- and shape-dependent
properties [1]. Gold nanospheres have a characteristic red colour, but anisotropic gold
nanorods have a dramatically different colour due to the surface plasmon oscillation [2].
Metallic nanoparticles: synthesis, characterisation and application
229
Gold NPs generate enhanced electromagnetic fields that affect the local environment.
The field is determined by the geometry of the NP and can enhance fluorescence of the
gold itself, the Raman signal of a molecule on the surface, and the scattering of light.
Because of the above-mentioned factors, many applications in biomedicine of gold NPs
became possible [3].
Magnetic nanostructured materials based on transition metals Co and Fe such as
CoPt and FePt have a very high potential application in producing new-generation
ultra-high density magnetic recording media because of their good chemical stability
and high magnetocrystalline anisotropy observed in the ordered intermetallic phase with
L10 structure [4,5]. These materials will contribute to an effort to design a magnetic
medium capable of recording densities beyond 1 Tbits/in2. Besides, these materials have
potential applications in permanent magnetic nanocomposites and biomedicine.
In this paper, we report on the synthesis and characterisation of gold NPs as well as
Co-Pt and Fe-Pt NPs. We also studied the application of gold NPs for detecting breast
cancer cells.
2
Experiment
Using a chemical reduction method, synthesis of gold nanospheres was carried out as
follows: 50 ml of 0.01 wt% chlorauric acid (HAuCl4 ⋅ 3H2O) solution was heated to
boiling while stirred in a 100 ml beaker. Then, a few hundred microlitres (µl) of 1 wt%
trisodium citrate dihydrate (Na3C6H5O7 ⋅ 2H2O) solution were quickly added to the auric
solution. The solution changed colour within several minutes from yellow to black and
then to red or purple. Gold nanospheres were also synthesised using a stronger reductive
agent (sodium borohydride (NaBH4)) as follows: 5 ml NaBH4 0.01 M at 0°C was added
to 25 ml HAuCl4 1 mM in a 50 ml flask and stirred for 15 min, until the colour of the
solution changed from light yellow to dark red.
Gold NPs were also synthesised via a photochemical approach by using X-ray
irradiation. In this approach, a few µl of 1 mM Triton X-100 (TX-100) solution were
mixed with 3 ml of 1 mM HAuCl4 ⋅ 3H2O solution. Pure HAuCl4 solution without
TX-100 addition was also prepared for comparison. The X-ray radiation was Cu-Kα
radiation of an X-ray diffractometer Bruker D5005 with the parameters of 40 kV and
40 mA. The X-ray irradiation time was set up to 40 min or 60 min to guarantee the
complete reduction of gold precursor solution.
Gold nanorods have been synthesised according to the seed-mediated growth method
from the following precursors: the solutions of 1 mM chlorauric acid (HAuCl4 ⋅ 3H2O),
0.2 M cetyltrimethylammonium bromide (CTAB: C19H42BrN), 0.01 M NaBH4, 4 mM
silver acetate (AgC2H3O2) and 0.08 M ascorbic acid (C6H8O6). The detailed procedure
was reported in Long et al. [6].
Gold nanorods were synthesised from metallic gold by sonoelectrochemical
technique as well. A gold metal plate (1 cm × 1 cm × 0.05 cm) was used as the anode and
a platinum plate (1 cm × 1 cm × 0.05 cm) was used as the cathode. These two electrodes
were placed in a glass containing 25 ml of electrolytic solution consisting of 0.08 M
CTAB and 83 mg tetradodecylammonium-bromide (TCAB). 2 ml of acetone and 1 ml of
cyclohexane were added into the above-mentioned mixed solution prior to electrolysis.
Then, the glass with the electrolytic solution was put in an ultrasonic bath (Ultrasonic
LC 30H) and ultrasonicated throughout the electrolysis time.
230
N.H. Luong et al.
Co-Pt NPs were synthesised by an electrochemical method. The electrolytes were
prepared by using grade chemical reagent and were composed of 0.1 M/l CoCl2 ⋅ 6H2O,
0.01 M/l H2PtCl6 and 0.525 M/l Na2SO4. The pH of 3 of the electrolyte was adjusted
by H2SO4. Poly(vinyl-pyrrolidone) (PVP) was added as a surfactant. Electrodeposition
has been conducted at room temperature. A platinum plate with a square of 1 cm2 was
used as a counter electrode. A titanium cathode has the same area. The current pulse J
was changed from 13 mA/cm2 to 40 mA/cm2. The duration of the current pulse was 0.5 s,
then the current was turned off for a fixed duration of 0.3 s. The electrodeposition was
carried out in a nitrogen atmosphere. After 1 h deposition, a black solution was obtained
and as-prepared nanoparticle powder was collected by using centrifuging at 9000 rpm
for 30 min. The powder was annealed at 700°C for 1 h under a mixture of 5% H2 and
95% Ar atmosphere.
The sonoelectrochemical method has been used for the synthesis of Fe-Pt NPs.
The sonoelectrochemical device employed is similar to that described in Zhu et al. [7].
A titanium horn with a diameter of 1.3 cm acted as both the cathode and the ultrasound
emitter (Sonics VCX 750). The electroactive part of the sonoelectrode was the planar
circular surface at the bottom of the Ti horn. This sonoelectrode produced a sonic pulse
that immediately followed a current pulse. A platinum plate with a square of 1 cm2 was
used as a counter electrode. The current pulse was changed from 15 mA/cm2 to
30 mA/cm2. The ultrasound power density was 100 W/cm2. The duration ton of the
current pulse was 0.5 s, then the current was turned off for a fixed duration of 0.5 s.
During ton, Fe-Pt NPs were deposited on the surface of the electrode. When the current
was switched off, an ultrasound was activated to remove the nanoparticles from the
electrode. The duration of ultrasound was 0.2 s for all samples. The temperature during
the reaction was room temperature. After deposition, FePt NPs were collected by using a
centrifuge (Hettich Universal 320) at 9000 rpm for 20 min. All samples were annealed
at 700°C for 1 h under a mixture of 5% H2 and 95% Ar atmosphere.
The obtained products were characterised by X-ray diffraction (XRD) by using a
Brucker D5005 diffractometer and transmission electron microscopy (TEM) by using a
JEOL JEM1010 electron microscope. UV-vis absorption spectra of the nanoparticle
solutions were collected with a Shimadzu UV 2450 PC spectrometer. The chemical
composition of the Co-Pt and Fe-Pt NPs was studied by using an energy dispersion
spectroscopy (EDS OXFORD-ISIS 300). Magnetic measurement was conducted by using
a DMS-880 sample vibrating magnetometer (VSM) with maximum magnetic field of
13.5 kOe at room temperature.
3
Results and discussion
3.1 Gold nanoparticles
Figure 1 illustrates a typical XRD pattern of the gold NPs obtained from the solution
with 400 µl of trisodium citrate solution. It can be seen from the figure that all the
diffraction peaks corresponding to the diffraction planes (111), (200) and (220) were
indexed to the gold metal with face-centred cubic (fcc) structure. The lattice constant
determined from XRD pattern is a = 4.078 ǖ, in good agreement with the standard
diffraction pattern of cubic gold metal (Pattern 4-784) [6]. Surface plasmon absorption
spectra of spherical gold NPs prepared with different amounts of 1% trisodium citrate
Metallic nanoparticles: synthesis, characterisation and application
231
solution are shown in Figure 2. As seen from the figure, the maximum of the absorption
spectrum is shifted to the short wavelength side (from 539.9 nm to 521.1 nm) and the full
width at half maximum (FWHM) of the spectrum is decreased with increasing amount of
trisodium citrate from 200 µl to 400 µl. Thus, the amount of citrate solution determines
the size of the NPs. The faster the capping of the NPs by the citrate, the smaller the
resulting NPs.
Figure 1
XRD pattern of the gold NPs prepared by chemical reduction technique
Figure 2
Surface plasmon absorption spectra of spherical gold NPs prepared with different
amounts of 1% trisodium citrate solution: 200, 240, 280, 320, 360 and 400 µl
(see online version for colours)
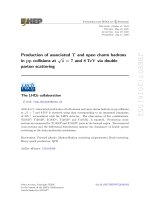
Typical TEM images of the gold NPs prepared with different amounts of 1% trisodium
citrate solution are shown in Figure 3. From the figure, one can see that when the amount
of trisodium citrate increases from 200 µl to 400 µl, the size of the synthesised gold NPs
decreases from 60 nm to 30 nm. That means the more amount of trisodium citrate,
the smaller obtained NPs.
Gold NPs were also synthesised via a photochemical approach by using X-ray
irradiation as mentioned earlier. The TEM image [6] showed that the addition of TX-100
as a particle stabiliser and reducing agent into HAuCl4 solution tremendously affected the
formation and growth of the gold NPs.
232
N.H. Luong et al.
Gold nanorods were synthesised according to the seed-mediated growth method.
A typical TEM image of gold NPs for the as-prepared sample (not shown) showed
that two major components of the sample are spherical NPs and nanorods. After
centrifugation at 3000 rpm for 10 min, the nanorods were separated from spherical NPs.
Figure 3
TEM images of the gold NPs prepared with different amounts (200, 280 and 400 µl)
of 1 % trisodium citrate solution. All the scale bars are 100 nm. On the pictures are
shown the size of the NPs and the wavelength of the maximum of surface plasmon
absorption spectra
Surface plasmon absorption spectra of anisotropic gold nanorods prepared with different
amounts of 4 mM silver acetate solution are shown in Figure 4. As seen from the figure,
when the shape of the NPs changes from nanospheres to nanorods, the surface plasmon
absorption spectra also change. The surface plasmon absorption spectra of the gold
nanorods have two bands: one band in the blue-green region around 525 nm due to the
transverse oscillation of electrons and another band in the red-nearinfrared region due to
the longitudinal electronic oscillation. In addition, the position of the band due to the
transverse electronic oscillation is almost unvaried; meanwhile with increasing the silver
acetate content from 70 µl to 120 µl, the position of the band due to the longitudinal
oscillation is increased from 654 nm to 830 nm, which corresponds to the enhanced
aspect ratio (the length-to-width ratio: AR) of the gold nanorods.
Figure 4
Surface plasmon absorption spectra of the gold nanorods prepared with different
amounts (70, 80, 100 and 120 µl) of 4 mM silver acetate solution
(see online version for colours)
Metallic nanoparticles: synthesis, characterisation and application
233
Gold nanorods were synthesised from metallic gold by sonoelectrochemical technique
as well. Typical TEM images of the gold nanorods shown in Figure 5 indicate that the
nanorods are of uniform size. The aspect ratio (AR) distribution histogram presented in
the inset of Figure 5 shows that the size of the nanorods has a narrow distribution: the
nanorods with an AR of 3 make up 55% and those with an AR of 4 make up 25%.
Figure 5
TEM images of the gold nanorods prepared by sonoelectrochemical method.
Inset is an aspect ratio distribution histogram (see online version for colours)
3.2 Co-Pt nanoparticles
Before annealing, the XRD patterns for Co-Pt NPs (not shown) showed the reflections
of pure Pt structure, which is similar to other CoPt thin films produced by
electro-deposition [8]. The reflections from Co are very weak due to the fact that their
atomic weight is much less than that of Pt. The Pt peaks in the as-prepared samples
are broad due to the small size of the particles. Using the Scherrer formula with the
FWHM of the strongest peak (111), the mean particle size of the particles was deduced to
be 6 nm.
The positive Pt4+ and Co2+ ions went to the cathode surface and received electrons
to make Pt and Co NPs. If there was no PVP surfactant, Co and Pt atoms would be
continuously deposited on the particles and at the end we would have a film of CoPt.
The presence of PVP around NPs created steric forces that limited the growth of NPs and
we obtained Co and Pt NPs well dispersed in the solution.
Figure 6 is the TEM images of typical as-prepared and annealed samples. Particle size
of the as-prepared Co-Pt sample was about 5 nm, which is consistent with the size
obtained from the broad XRD peaks. Particle size (5–20 nm) depends on the
concentration of PVP (1–5 g/l). After annealing, the particle size increased to 100 nm
due to the diffusion and aggregation between particles to form face-centred tetragonal
(fct) Co-Pt NPs.
234
Figure 6
N.H. Luong et al.
TEM images of the as-prepared (left) and annealed (right) Co-Pt NPs
Magnetic measurements revealed low saturation magnetisation (Ms) and coercivity (Hc)
in all as-prepared samples (data not shown). The low value of Ms of the as-prepared NPs
may be explained by the oxidation or hydroxidation of Co atoms in NPs, which can result
in the antiferromagnetic cobalt oxides and weak magnetic cobalt hydroxides.
This is in agreement with the suggestion of separated Co and Pt domains in as-prepared
NPs. After annealing, the hard magnetic CoPt phase was formed. Figure 7 presents
the magnetic curves of the annealed samples with current density J of 13, 20
and 40 mA/cm2. The curves for J of 15, 25, 30 mA/cm2 (not shown) are similar to that of
20 mA/cm2. The curves show typical hard magnetic hysteresis loops of multiphase
materials with high Hc. (For Hc in the multiphase materials, the reader is referred to
discussion below for Fe-Pt NPs). Coercivity gets maximum value (around 11 kOe) in the
samples with the chemical composition of the particles close to the equiatomic
composition, i.e., samples with J of 15–30 mA/cm2. The atomic percent of Co increased
with J, which resulted in high Ms. However, the magnetic squareness Mr/Ms reduced with
J because of the presence of the Co3Pt.
Figure 7
Magnetic curves for the annealed Co-Pt samples with current density J of 13, 20,
and 40 mA/cm2
Metallic nanoparticles: synthesis, characterisation and application
235
3.3 Fe-Pt nanoparticles
The chemical composition of the Fe-Pt NPs was controlled by adjusting the
current density (corresponding to the applied voltage). When the current density was
15–20 mA/cm2, the composition of NPs was close to the expected equiatomic
composition, namely for J of 15 mA/cm2 and 20 mA/cm2, Fe45Pt55 and Fe52Pt48 NPs were
obtained, respectively. At higher current densities, the atomic percent of Fe was higher
because the standard electrode potential Fe2+/Fe (–0.44 V [9]) was more negative than
that of Pt4+/Pt (0.742 V [10]).
As in the case of CoPt NPs, before annealing, the XRD results (not shown) showed
the reflections of pure Pt structure, which is similar to other FePt thin films produced
by electrodeposition [11]. Upon annealing, the formation of the ordered L10 fct phase
happened by the diffusion process between Fe and Pt domains. Figure 8 is the TEM
images of typical as-prepared and annealed samples. Particle size of the as-prepared
FePt sample was 5–10 nm, compared with 5.2 nm obtained from the XRD results by
using the Scherrer formula. After annealing, the particle size increased to 10–25 nm due
to the aggregation and particle growth. In addition, the size distribution of the annealed
particles was larger than that of the as-prepared samples.
Figure 8
TEM images of the as-prepared (left) and annealed (right) Fe-Pt NPs
Magnetic measurements revealed low Ms and Hc in all as-prepared samples.
The saturation magnetisation of the unannealed particles was a few emu/g and the
coercivity was 20–80 Oe. The low value of Ms of the as-prepared NPs may be explained
by the oxidation or hydroxidation of Fe atoms in NPs, which can result in the weak
magnetic iron oxides and iron hydroxides. This is in agreement with the suggestion of
separated Fe and Pt domains in as-prepared NPs.
After annealing, the hard magnetic FePt phase was formed. Figure 9 presents the
magnetic curve of the annealed Fe45Pt55 sample as an example. The curve shows a typical
hard magnetic hysteresis loop with high Hc. Note that, because of the limit of maximum
applied field of 13.5 kOe, the curve is a minor loop. Therefore, the real coercivity must
be higher than those obtained from the hysteresis curves. However, the loop shows
a kink at low reversed magnetic field of 500 Oe, which indicates that there was a small
soft magnetic phase. Classically, the coercivity is defined as the field for which
236
N.H. Luong et al.
the magnetisation (M) vanishes ( H c′ ). In a more physically meaningful definition,
the coercivity Hc may be defined as the field where the largest number of moments
reverses, i.e., the maximum of susceptibility (dM/dH). In most cases, both definitions of
the coercivity are almost equivalent. However in multiphase materials, two definitions
are significantly different [12]. From Figure 9, H c′ was 6 kOe whereas Hc was 8.5 kOe.
The atomic percent of Fe increased with J, which resulted in the high Ms. However,
the magnetic squareness Mr / Ms reduced with J because of the presence of the Fe3Pt.
Figure 9
Magnetic curves of Fe45Pt55 sample. The maximum applied field was 13.5 kOe
3.4 Application of gold nanoparticles for detecting breast cancer cells
In order to detect breast cancer cells, we have conjugated the sodium borohydride
(or sodium citrate) reduced gold NPs with anti-HER2 antibody (trastuzumab)
through either non-covalent or covalent linkages. The procedure consists of the following
steps:
Functionalising gold NPs with 4-ATP (C6H7NS)
Different volumes of 4-ATP 2 mM were added into 20 ml of the gold NPs containing
solution. The colours of the solutions changed from dark red to dark blue, and then were
incubated for 2 days.
Conjugation of trastuzumab to gold NPs
Trastuzumab was non-covalently conjugated to colloidal gold NPs, prepared by citrate
reduction (named as Ci*GNPs) and NaBH4 reduction (named as BH4*GNPs).
The colloidal gold suspension was adjusted with 0.1 M NaOH to pH 6.5 to react with a
mixture of 6 µg/ml non-labelled trastuzumab and FITC-trastuzumab (480 nm/520 nm)
at mole ratio 10 : 1 at room temperature for 5 min. Trastuzumab was covalently linked
to amino-GNPs through EDC connection. Briefly, the above-prepared amino-GNPs
were reacted with EDC 0.2 mM in MOPS buffer with pH 6.0, for 20 min at
room temperature. Then, the EDC*GNPs were reacted with 6 µg/ml non-labelled
trastuzumab and FITC-trastuzumab (480 nm/520 nm) at mole ratio 10 : 1, for 30 min
Metallic nanoparticles: synthesis, characterisation and application
237
at room temperature. The absorbance profile of trastuzumab-GNPs was measured and
compared with that of GNPs using Spectrophotometer (Nanodrop).
Culture of KPL4 and Hela cells
KPL4 and Hela cells were cultured in 24-well ELISA plates containing DMEM
(Difco Modified Eagle Medium) plus 10% FBS (Fetal Bovine Serum). Glass coverslips
were added in each well and the cells were incubated at 37°C, 5% CO2 to reach a
population of about 4 × 10⁵ to 106 cells/ml. The coverslips were picked out to new
24-well ELISA plate for further immuno-nanogold incubation.
Incubation of trastuzumab-conjugated gold NPs with KPL4, Hela cells and imaging of
the cells
Coverslips containing KPL4 and Hela cells were incubated with trastuzumab-BH4*GNPs,
trastuzumab-Ci*GNPs or trastuzumab-EDC*GNPs at a concentration of 3 µg/ml at
room temperature, for 60 min. The coverslips were observed under epifluorescence
microscope. The KPL4 cells incubated with trastuzumab-EDC*GNPs were observed
under a FESEM (Field Emission Scanning Electron Microscope).
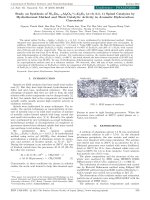
The results are shown in Figure 10. We could observe the 10 times higher fluorescent
intensity of FITC (green) on KPL4 cells than that of FITC on Hela cells in all the
three types of trastuzumab-conjugated gold NPs. Because KPL4 has high level of
HER2-expression, while Hela has HER2 expressed normally, the remarkable difference
in the fluorescent intensity between KPL4 and Hela indicated the specific binding of all
the three types of trastuzumab-GNPs on KPL4 membranes. However, the covalently
linked trastuzumab-EDC*GNPs is shown to be the most stable in fluorescent intensity
after a long time of stocking (several months).
Figure 10 Typical luminescent microscopy images of breast cancer cells indicating the specific
binding of trastuzumab-GNPs on KPL4 cells, and weak binding on Hela cells
(for comparison): FITC fluorescent signal (green) emitted from KPL4 (upper panel)
and from Hela (lower panel) after incubation with trastuzumab-BH4*GNPs (A1-A2),
trastuzumab-Ci*GNPs (A3-A4) and trastuzumab-EDC*GNPs (A5-A6) (see online
version for colours)
238
N.H. Luong et al.
We also tried to conjugate the gold NPs with trastuzumab without FITC fluorescent
dye. As seen from Figure 11, no signal was observed when KPL4 was incubated
with the non-conjugated gold NPs (A2). However, trastuzumab-conjugated gold
NPs concentrated on KPL4 and these cancer cells were clearly observed in the
dark-field microscopy image (A4) by means of the scattering light of the gold NPs.
When the amino-GNPs were covalently conjugated with trastuzumab through EDC
connection, the gold NPs concentrated on the cancer cells as well, but these cancer
cells were observed with slightly lower intensity in the dark-field microscopy
image (A6) in comparison with those in the image A4. However, the non-covalent
trastuzumab-conjugated GNPs were able to be stored in freezer for only two weeks
before they lost their activity, while the trastuzumab-EDC*GNPs were stable for storage
for about two months.
Figure 11 Typical bright-field (A1, A3, A5) and dark-field (A2, A4, A6) microscopy images
of breast cancer cells after incubation with the gold NPs non-conjugated with
trastuzumab (A1-A2), the gold NPs conjugated with trastuzumab (A3-A4) and the
amino-GNPs covalently conjugated with trastuzumab through EDC connection (A5-A6)
(see online version for colours)
The images of the cancer cells labelled with the trastuzumab-conjugated gold NPs were
obtained by the EDX scanning technique for the gold element. These EDX scanning
images for the gold element and normal SEM images of the cancer cells labelled with the
trastuzumab-conjugated gold NPs are shown in Figure 12. As seen from the figure,
the trastuzumab-conjugated gold NPs have concentrated with high density on the
cancer cells.
Metallic nanoparticles: synthesis, characterisation and application
239
Figure 12 SEM images of the cancer cells labelled with gold NPs (A1 and A3) and EDX scanning
images of the gold NPs labelling the cancer cells (A2 and A4), respectively.
The scale bars in all the images are 20 µm (see online version for colours)
4
Conclusions
Gold NPs as well as Co-Pt and Fe-Pt NPs have been prepared. After annealing,
Co-Pt and Fe-Pt NPs showed a high coercivity. We succeeded in conjugating
trastuzumab to gold NPs for specific detection of HER2 over-expressed breast
cancer cells, here is KPL4 cell line. Among three types of conjugation, the covalently
linked trastuzumab-EDC*GNPs showed long-time stability and strong binding towards
breast cancer cell KPL4.
Acknowledgements
The authors thank the Ministry of Science and Technology of Vietnam (Contract
No. 38/355/2008/HD-NDT for Task of Protocol with Israel) and National Foundation
for Science and Technology Development – NAFOSTED (Project 103.02.72.09) for
financial support.
References
1
2
3
Eustis, S. and El-Sayed, M.A. (2006) ‘Why gold nanoparticles are more precious than pretty
gold: Noble metal surface plasmon resonance and its enhancement of the radiative
and nonradiative properties of nanocrystals of different shapes’, Chem. Soc. Rev., Vol. 35,
pp.209–217.
Liz-Marzan, L.M. (2004) ‘Nanometals: formation and color’, Mater. Today, Vol. 7, pp.26–31.
Jain, P.K., El-Sayed, I.H. and El-Sayed, M.A. (2007) ‘Au nanoparticles target cancer’,
NanoToday, Issue 1, Vol. 2, pp.18–29.
240
4
N.H. Luong et al.
Sun, S., Murray, C.B., Weller, D., Folks, L. and Moser, A. (2000) ‘Monodisperse FePt
nanoparticles and ferromagnetic FePt nanocrystal superlattices’, Science, Vol. 287,
pp.1989–1992.
5
Huang, Y., Okumura, H. and Hadjipanayis, G.C. (2001) ‘CoPt nanoparticles for high density
magnetic recording media’, in Hadjipanayis, G.C. (Ed.): Magnetic Storage Systems Beyond
2000, Kluwer Academic Publishers, Dordrecht, pp.171–176.
6
Long, N.N., Vu, L.V., Kiem, C.D., Doanh, S.C., Nguyet, C.T., Hang, P.T., Thien, N.D. and
Quynh, L.M. (2009) ‘Synthesis and optical properties of colloidal gold nanoparticles’,
J. Phys.: Conf. Ser., Vol. 187, pp.012026 (8 pages).
7
Zhu, J.J., Aruna, S.T., Koltypin, V. and Gedanken, A. (2000) ‘A novel method for the
preparation of lead selenide: pulse sonoelectrochemical synthesis of lead selenide
nanoparticles’, Chem. Mater., Vol. 12, pp.143–147.
8
Zana, I. and Zangari, G. (2004) ‘Magnetic properties of electrodeposited Co-Pt thin films with
very high perpendicular magnetic anisotropy’, J. Magn. Magn. Mater., Vols. 272–276,
pp.1698–1699.
9
Atkins, P. (1997) Physical Chemistry, 6th ed., W.H. Freeman and Company, New York.
10 Bard, A.J. and Faulkner, L.R. (2001) Electrochemical Methods. Fundamentals and
Applications, 2nd ed., John Wiley and Sons Inc., New York.
11 Zeng, Q., Zhang, Y., Wang, H.L., Papaefthymiou, V. and Hadjipanayis, G.C. (2004)
‘Magnetic properties and microstructure of fine Fe-Pt nanoparticles prepared by chemical
reduction’, J. Magn. Magn. Mater., Vols. 272–276, pp.e1223–e1225.
12 Givord, D. and Rossignol, M.F. (1996) ‘Coercivity’, in Coey, J.M.D. (Ed.): Rare-earth Iron
Permanent Magnets, Clarendon Press, Oxford, pp.218–285.