Synthesis and Characterization of Polymeric Graphene Quantum Dots Based Nanocomposites for Humidity Sensing
Bạn đang xem bản rút gọn của tài liệu. Xem và tải ngay bản đầy đủ của tài liệu tại đây (2.13 MB, 7 trang )
Hindawi Publishing Corporation
Journal of Nanomaterials
Volume 2016, Article ID 5849018, 6 pages
/>
Research Article
Synthesis and Characterization of Polymeric Graphene
Quantum Dots Based Nanocomposites for Humidity Sensing
Lam Minh Long,1,2 Nguyen Nang Dinh,1 and Tran Quang Trung3
1
University of Engineering and Technology, Vietnam National University Hanoi, 144 Xuan Thuy, Hanoi 10000, Vietnam
Ho Chi Minh City Vocational College, 38 Tran Khanh Du, District 1, Ho Chi Minh City 10001, Vietnam
3
University of Natural Science, Vietnam National University, Ho Chi Minh City, 227 Nguyen Van Cu Road, District 5,
Ho Chi Minh City 10001, Vietnam
2
Correspondence should be addressed to Nguyen Nang Dinh;
Received 22 January 2016; Accepted 27 March 2016
Academic Editor: Mingqiang Li
Copyright © 2016 Lam Minh Long et al. This is an open access article distributed under the Creative Commons Attribution License,
which permits unrestricted use, distribution, and reproduction in any medium, provided the original work is properly cited.
Graphene quantum dots (GQDs) were synthesized and incorporated with polyethylenedioxythiophene:poly(4-styrenesulfonate)
(PEDOT:PSS) and carbon nanotube (CNT) to form a composite that can be used for humidity sensors. The 600 nm thick composite
films contained bulk heterojunctions of CNT/GQD and CNT/PEDOT:PSS. The sensors made from the composites responded well
to humidity in a range from 60 to 80% at room temperature and atmospheric pressure. With a CNT content of 0.4 wt.% (GPC-1) to
0.8 wt.% (GPC-2) and 1.2 wt.% (GPC-3), the sensitivity of the humidity sensing devices based on CNT-doped graphene quantum
dot-PEDOT:PSS composites was increased from 4.5% (GPC-1) to 9.0% (GPC-1) and 11.0% (GPC-2), respectively. The fast response
time of the GPC sensors was about 20 s and it was much improved due to CNTs doping in the composites. The best value of the
recovery time was found to be of 40 s, for the GPC composite film doped with 1.2 wt.% CNT content.
1. Introduction
Nanocomposites are known as materials mixing two or more
different materials, where at least one of these has a nanodimensional phase, for example, conjugate polymers embedded with metallic, semiconducting, and dielectric nanoparticles. In comparison with devices made from standard materials, the nanocomposites-based devices usually possess enhanced efficiency and service life [1–4]. This is because inorganic nanoparticles embedded in conducting polymers can
improve the mechanical, electrical, and optical properties
such as nonlinear optical behavior, photoluminescence, electroluminescence, and photoconductivity [5–7]. Nanostructured composites or nanohybrid layers containing numerous heterojunctions can be utilized for optoelectronics,
organic light emitting diodes (OLEDs), organic solar flexible
cells (OSC) [8, 9], and so forth. Among conducting polymers, polyethylenedioxythiophene:poly(4-styrenesulfonate)
(abbreviated to PEDOT:PSS) as a p-type organic semiconductor is well used for the hole transport layer in OLED [10]
and OSC [4] as well as for the matrices materials in various
sensors [11]. Various nanocomposite films consisting of conducting polymers mixed with carbon nanotubes (CNTs) as
an active material have been prepared for application in gas
thin film sensors. Recently, Olenych et al. [12] used hybrid
composites based on PEDOT:PSS-porous silicon-CNT for
preparation and characterization of humidity sensors. The
value of the resistance of the hybrid films was as large as
10 MΩ that may have caused a reduced accuracy in monitoring the resistance change versus humidity.
It is known that graphene possesses many excellent
electrical properties, since it is an allotrope of carbon with
a structure of a single two-dimensional (2D) layer of sp2
hybridized carbon atoms. Graphene quantum dots (GQDs),
as seen in [13, 14], are a kind of 0D material made from small
pieces of graphene. GQDs exhibit new phenomena due to
quantum confinement and edge effects, which are similar to
semiconducting QDs [15]. Graphene and related materials
like graphene oxide (GO) or reduced graphene oxide (rGO)
as materials used for chemical sensing have significant application potential. This is due to the 2-dimensional structure
2
Journal of Nanomaterials
Ag
l
GPC film
A
Ag electrode
V
L
(a)
(b)
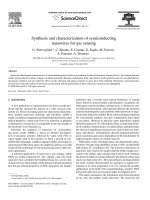
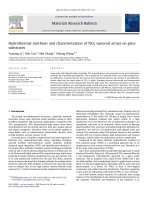
Figure 1: Image of a humidity sensor made from a single layer of PEDOT:PSS+GQDs+CNT composite film (a) and the schematic drawing
of the device with the two planar electrodes (b). Humidity change is detected by the change in the current with a constant Dc-bias applied to
the two electrodes.
that results in a high sensing area per unit volume and a
low noise compared to other solid state sensors. There were
many works reporting on the use of graphene or graphene
related materials for monitoring gases and vapors [16, 17].
Particularly, some of the works attempted to connect the
advantages of nanoscale metals with that of graphene for the
improvement of gas sensor applications [18, 19]. GQDs were
mainly used in a single electron transistor (SET). Besides
detecting charge in SETs, GQDs have also been recruited to
build electronic sensors for the detection of humidity and
pressure [20].
In this work we report results of our investigation on the
fabrication of graphene quantum dots and nanocomposites of
PEDOT:PSS+GQDs+CNT. The humidity sensing properties
of the PEDOT:PSS+GQDs+CNT composite based thin film
sensors are also presented.
2. Experimental
2.1. Preparation of GQDs and CNT-Doped GQDs+PEDOT:PSS
Composites. To prepare GQDs, a solution of graphite
flake (GF), KMnO4 , and HNO3 with a weight ratio of
0.2 g : 0.2 g : 0.4 mL was prepared and put in a Pt crucible.
This solution was then put in a microwave oven for heating
for 1 min to separate GF into laminar form (EG). The second
solution was made from 0.2 g NaNO3 + 9.6 mL H2 SO4 (98%)
+ 1,2 g KMnO4 (called as NKH). EG was mixed with NKH
solution and carefully stirred by use of a magnetic device
for 2 h to have a GO solution. Adding to the GO solution
30 mL distilled water and then 10 mL H2 O2 allowed us to get
a dark-yellow solution. By spinning with a rate of 7000 rpm
for 5 min, a GO powder was obtained and it was diluted
in deionized water. In the next step, NH3 was added in the
solution and stirred at 100∘ C for 5 h until a solution with a
uniform dispersion of GQDs was reached. Finally, the GQDs
dispersed solution was filtrated by using the “Dialysis” funnel
to collect a GQDs powder with a volume of 0.2 g. This powder
then was dissolved in 20 mL of twice-distilled water to get a
GQDs-dispersion solution of 10 wt.% GQDs (abbreviated to
GQD10).
To prepare the GQDs+PEDOT:PSS composite solution,
firstly a powder of multiple wall carbonate tubes (shortly
abbreviated to CNT) with an average size of 30 nm in
diameter and 2 𝜇m in length was embedded in 10 mL of
the GQD10 solution without CNT and with three contents
of CNT, respectively, 0.5 mg, 1.0 mg, and 1.5 mg. All of the
solutions obtained are called GQC solutions. These solutions
were treated by plasma in a microwave oven. Then 2 mL of
PEDOT:PSS (1.25 wt.% in H2 O) was poured into each GQC
solution. The solutions of GQDs-PEDOT:PSS without and
with CNT of the three abovementioned volumes of CNT
were stirred by ultrasonic wave for 1 hour. Using spin-coating,
four GQC solutions were deposited onto glass substrates
which were coated by two silver planar electrode arrays with
a length (𝐿) of 10 mm and separated from one another by
a distance (𝑙) of 5 mm, as shown in Figure 1. In the spincoating technique used for preparing composite films, the
following parameters were chosen: a delay time of 100 s, a rest
time of 45 s, a spin speed of 1500–1800 rpm, an acceleration
of 500 rpm, and finally a drying time of 3 min. To dry the
composite films, a flow of dried gaseous nitrogen was used
for 10 hours. For a solidification avoiding the use of solvents,
the film samples were annealed at 120∘ C for 8 h in a “SPT200” vacuum drier. From all the volumes of chemicals such as
GQDs, PEDOT:PSS, and CNT used for the films preparation,
the CNT weight contents (wt.%) in the GQDs-PEDOT:PSS
matrix have been calculated. It is seen that the samples
embedded with the CNT volume of 0.5 mg, 1.0 mg, and 1.5 mg
consist of 0.4 wt.%, 0.8 wt.%, and 1.2 wt.%, respectively. For
simplicity in further analysis, the samples without and with
CNT of 0.4 wt.%, 0.8 wt.%, and 1.2 wt.% were abbreviated
to GPC-0, GPC-1, GPC-2, and GPC-3, respectively. Finally,
these film samples were kept in a dry Ar glove-box until the
measurements.
2.2. Characterization Techniques. The thickness of the films
was measured on a “Veeco Dektak 6M” stylus profilometer.
The size of GQDs and the surface morphology of the
films were characterized by using “Hitachi” Transmission
Electron Microscopy (TEM) and Emission Scanning Electron
Journal of Nanomaterials
3
Microscopy (FE-SEM), respectively. For humidity sensing
measurements, the samples were put in a 10 dm3 -volume
chamber; a humidity value could be fixed in a range from
20% to 80% by the use of a “EPA-2TH” moisture profilometer
(USA). The adsorption process is controlled by insertion
of water vapor, while the desorption process was done by
extraction of the vapor followed by insertion of dry gaseous
Ar. The measurement system that was described in [21]
consists of an Ar gas tank, gas/vapor hoses and solenoids
system, two flow meters, a bubbler with vapor solution, and
an airtight test chamber connected with collect-store data
DAQ component. The Ar gas played a role as carrier gas,
dilution gas, and purge gas.
For each sample, the number of measuring cycles was
chosen to be at least 10 cycles. The humidity flow taken for
measurements was of ∼60 sccm mL/min. The sheet resistance
of the samples was measured on a “KEITHLEY 2602” system
source meter.
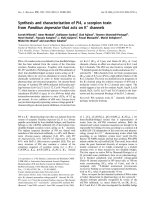
100 nm
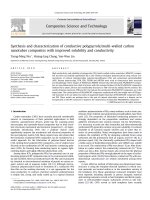
Figure 2: TEM micrograph of a GQDs sample.
3. Results and Discussion
3.1. Electrical Properties and Morphology. From a TEM
micrograph of a GQDs sample (Figure 2), it is seen that the
size distribution of the dots is considerably homogenous;
as evaluated in this micrograph, the dots size ranged from
10 nm to 15 nm. Figure 3 is a FE-SEM micrograph of the
GPC-3 sample where the CNT and GQDs clearly appeared
while the conjugate polymer PEDOT:PSS exhibited a transparent matrix. This SEM micrograph also shows that in
the GPC composite film there are mainly heterojunctions
of the GQD/PEDOT-PSS and CNT/PEDOT:PSS, whereas
CNT/GQD junctions are rarely formed.
From the thickness measurements, it can be seen that
embedding CNT made the GPC samples considerably
thicker. However, for the CNT-embedded GPC films, the
CNT concentration was not much affected by the film
thickness, so that the change in the thickness versus CNT
concentration could be neglected. Indeed, for GPC-0 samples
(i.e., the samples without CNT) the value of the film thickness
was found to be ∼5% smaller than that of the GPC + CNT
samples (Table 1). This can be explained by the lower viscosity
of GPC solution in comparison with the viscosity of GPC
composite solutions. The results of measurements of the sheet
resistance (𝑅) of the samples are listed in Table 1.
For thin films, the sheet resistance in the investigated
samples can be expressed as follows:
𝜌
𝑙
𝑙
(1)
=
,
𝑅𝑠 = 𝜌 = 𝜌
𝑆
2𝑙 × 𝑑 2𝑑
where 𝑙 is the separation distance between two Ag electrodes,
𝑆 = 𝐿 × 𝑑 = 2𝑙 × 𝑑.
Thus from the sheet resistance one can determine the
resistivity (𝜌) of the films as follows:
𝜌 = 2𝑅𝑠 × 𝑑.
(2)
Thus, the conductivity (𝜎) is
𝜎∼
1
1
=
.
𝜌 2𝑅𝑠 𝑑
(3)
100 nm
Figure 3: FE-SEM micrograph of the GPC-3 composite sample.
Table 1: Thickness and resistance at room temperature of graphene
quantum dots/CNT composite films.
Samples
CNT
content
(wt%)
Thickness,
𝑑 (nm)
𝑅𝑠 (kΩ)
Conductivity, 𝜎
(S/cm)
GPC-0
GPC-1
GPC-2
GPC-3
0
0.4
0.8
1.2
460
485
487
490
2.180
2.160
0.814
0.356
4.98
4.76
7.93
27.52
The values of the conductivity of the composited films calculated by formula (3) are shown in Table 1. The conductivity
of the GPC-3 film is the largest and can be compatible to
the conductivity of a pure PEDOT-PSS film as reported in
[22]. Embedding GQDs and CNT into PEDOT-PSS has made
the conductivity of PEDOT-PSS decrease, leading to the
expectation that the sensitivity of the GPC composite films
would be enhanced.
The temperature dependence of the conductivity of GPC
samples is shown in Figure 4. For GPC-1 sample, 𝜎 versus
𝑇 curves exhibit a typical property of the inorganic semiconductors: with increases in temperature the conductivity
increases. With increases in the CNT content, the composite
4
Journal of Nanomaterials
240
40
GQDs-PEDOT:PSS
235
32
230
28
Resistance (kΩ)
Conductivity, 𝜎 (S/cm)
36
24
12
8
CNT-PEDOT:PSS
220
215
4
0
225
30
40
50
60
70
80
Temperature (∘ C)
90
100
GPC-1
GPC-2
GPC-3
Figure 4: Temperature dependence of the conductivity of GPC-1,
GPC-2, and GPC-3 films.
exhibited a clearer semiconductor behavior; and when it
reached a value as large as 1.2 wt.% (namely, in GPC-3
sample), the conductivity of the films maintained an almost
unchanged value of 37.2 S/cm under elevated operating temperatures. This thermal stability property is a desired factor
for materials that are used in sensing applications.
3.2. Humidity Sensing Characterization. To characterize humidity sensitivity of the GPC samples, the devices were placed
in a test chamber and device electrodes were connected
to electrical feedthroughs. The measurements included two
processes: adsorption and desorption. In the adsorption
process, the humidity flow consisting of Ar carrier and
H2 O vapor from a bubbler was introduced into the test
chamber for an interval of time, following which the change
in resistance of the sensors was recorded. In the desorption
process, a dried Ar gas flow was inserted in the chamber
in order to recover the initial resistance of the GPC films.
Through the recovering time dependence of the resistance
one can obtain information on the desorption ability of the
sensor in the desorption process.
Figure 5 demonstrates the adsorption and desorption
processes of the GQDs-PEDOT:PSS and CNT-PEDOT:PSS
sensors. This figure shows that in the first 60 s Ar gaseous
flow eliminated the contamination agents from the GQDsPEDOT:PSS surface; consequently the surface resistance
increased. After the cleaning of the sensor surface during
30 s, the introduced humidity vapor was adsorbed onto the
sensor surface, resulting in the decrease of the resistance. In
the subsequent cycles, the humidity desorption/adsorption
process led, respectively, to increase and decrease of the
resistance of sensors, with results similar to those reported
in [11]. However, through each cycle, the resistance of the
GQDs-PEDOT:PSS film did not recover/restore to its initial
value but increased in 1 to 2 kΩ, to a final value of 235 kΩ
after 1000 s from 220 kΩ. The increase in the initial resistance
210
205
0
200
400
600
800
1000
Time (s)
Figure 5: Sheet resistance change versus humidity of GQDsPEDOT:PSS and CNT-PEDOT:PSS composite films during adsorption/desorption processes.
of the GQDs-PEDOT:PSS mainly related to the decrease of
the major charge carriers in PEDOT:PSS. This is due to the
elimination of holes (as the major carriers in PEDOT:PSS)
by electrons that were generated from the H2 O adsorption.
The more desorption/adsorption cycles, the more holes
eliminated in the deeper distances in the composite films. The
similar feature in the sheet resistance change versus humidity
was observed for the CNT-PEDOT:PSS, but the sensitivity of
the last was much less than the one of the GQDs-PEDOT:PSS
sensor. This proves the advantage of GQDs embedded in
PEDOT:PSS polymer for the humidity sensing.
To appreciate better the sensing performance of the GPC
composite films used for the sensors, a sensitivity (𝜂) of the
devices was introduced. It is determined by the following
equation:
𝜂=
𝑅 − 𝑅0
(%) .
𝑅0
(4)
The absolute magnitude of the sensitivity of the GPC-0
calculated by formula (4) is of ca. 2.5%.
Plots of time dependence of the sensitivity of the CNTdoped GPC composite films are shown in Figure 6. From
this figure one can see that, for the GPC samples, opposite
to the GQDs-PEDOT:PSS, the humidity (i.e., H2 O vapor)
adsorption process led to increase in the resistance of the
films. Moreover the resistance increased at a much faster rate
than when it decreased.
Looking at the humidity sensing curves in Figure 6, one
can distinguish two phenomena: the “rapid” (steep slope) and
“slow” (shallow slope) response. The rapid response arises
from H2 O molecular adsorption onto low-energy binding
sites, such as sp2 -bonded carbon, and the slow response arises
from molecular interactions with higher energy binding sites,
such as vacancies, structural defects, and other functional
groups [23, 24].
For the next step, the sensitivity ability of GPC composite
was studied and the whole experiment process as described
5
6
12
5
10
4
8
(R − R0 )/R0 (%)
(R − R0 )/R0 (%)
Journal of Nanomaterials
3
2
1
6
4
2
0
0
200
400
600
800
0
1000
0
200
400
600
Time (s)
Time (s)
(a)
(b)
800
1000
14
12
(R − R0 )/R0 (%)
10
8
6
4
2
0
0
200
400
600
800
1000
Time (s)
(c)
Figure 6: Comparison of the humidity sensing of the GPC composite based sensors versus CNT content; (a) GPC-1 (0.4 wt.%), (b) GPC-2
(0.8 wt.%), and (c) GPC-3 (1.2 wt.%).
above was repeated. The data in Figure 6 show that the
presence of CNT can improve the sensing properties of GPC
sheets. With increase in the CNT content, the resistivity
increased, from 4.5% (for GPC-1) to 9.0% (for GPC-2) and
11.0% (for GPC-3).
The response time (i.e., the duration for 𝑅0 raising up to
𝑅max in the adsorption process) for all three GPC sheets is
almost the same value of 20 s, whereas the recovery time (the
duration for 𝑅0 lowering to 𝑅max in the desorption process)
decreased from 70 s (GPC-1, Figure 6(a)) to 60 s (GPC-2,
Figure 6(b)) and 40 s (GPC-3, Figure 6(c)). In addition, the
complete H2 O molecular desorption on the surface of GPC
composites took place at room temperature and atmospheric
pressure. One can guess that connecting together individual
GPC sheets by CNTs caused the increase of the mobility
of carriers in GPC composite films, consequently leading to
higher H2 O vapor sensing ability of the CNT-doped GQDsPEDOT:PSS composites. Indeed, due to the appearance of
CNTs bridges, the number of the sites with high binding
energies in GPC sheets decreases, while the number of
those with low binding energies increases. Since the H2 O
molecules was mainly adsorbed at the sites with low binding
energies, the appearance of CNTs bridges led to the complete
desorption ability of GPC composites.
4. Conclusion
The synthesized graphene quantum dots (GQDs) and spincoated composite thin films of GQDs, PEDOT:PSS, and CNT
(GPC) were used for preparing humidity sensors. The sensors
had extremely simple structure and they responded well to
the humidity change at room temperature and atmospheric
pressure. With the CNT content increase, from 0% (GPC-0)
to 0.4 wt.% (GPC-1), 0.8 wt.% (GPC-2), and 1.2 wt.% (GPC3), the sensitivity of the humidity sensing devices based on
CNT-doped graphene quantum dot-PEDOT:PSS composites
improved from 2.5% (GPC-0) to 4.5% (GPC-1), 9.0% (GPC1), and 11.0% (GPC-2), respectively. The response time the
6
Journal of Nanomaterials
GPC sensors was as fast as 20 s; and the recovery time of the
sensors lowered from 70 s (0.4 wt.% CNT) to 60 s (0.8 wt.%
CNT) and 40 s (1.2 wt.% CNT).
Competing Interests
[12]
The authors declare that there are no competing interests
related to this paper.
[13]
Acknowledgments
This research was funded by the Vietnam National Foundation for Science and Technology (NAFOSTED) under Grant
no. 103.02-2013.39. The authors express sincere thanks to
Professor Vo-Van Truong (Department of Physics, Concordia
University, Canada) for useful discussion.
[14]
[15]
References
[1] T. P. Selvin, J. Kuruvilla, and T. Sabu, “Mechanical properties of
titanium dioxide-filled polystyrene microcomposites,” Materials Letters, vol. 58, no. 3-4, pp. 281–289, 2004.
[2] J. M´ocz´o and B. Puk´anszky, “Polymer micro and nanocomposites: structure, interactions, properties,” Journal of Industrial &
Engineering Chemistry, vol. 14, no. 5, pp. 535–563, 2008.
[3] S. A. Choulis, M. K. Mathai, and V.-E. Choong, “Influence
of metallic nanoparticles on the performance of organic electrophosphorescence devices,” Applied Physics Letters, vol. 88,
Article ID 213503, 2006.
[4] T. T. Thao, T. Q. Trung, V.-V. Truong, and N. N. Dinh,
“Enhancement of power efficiency and stability of P3HT-based
organic solar cells under elevated operatingeratures by using
a nanocomposite photoactive layer,” Journal of Nanomaterials,
vol. 2015, Article ID 463565, 7 pages, 2015.
[5] W. U. Huynh, J. J. Dittmer, and A. P. Alivisatos, “Hybrid
nanorod-polymer solar cells,” Science, vol. 295, no. 5564, pp.
2425–2427, 2002.
[6] A. Petrella, M. Tamborra, P. D. Cozzoli et al., “TiO2 nanocrystals—MEH-PPV composite thin films as photoactive material,”
Thin Solid Films, vol. 451-452, pp. 64–68, 2004.
[7] V. M. Burlakov, K. Kawata, H. E. Assender, G. A. D. Briggs,
A. Ruseckas, and I. D. W. Samuel, “Discrete hopping model of
exciton transport in disordered media,” Physical Review B, vol.
72, Article ID 075206, 2005.
[8] J. Ouyang, Q. Xu, C.-W. Chu, Y. Yang, G. Li, and J. Shinar,
“On the mechanism of conductivity enhancement in poly(3,4ethylenedioxythiophene):poly(styrene sulfonate) film through
solvent treatment,” Polymer, vol. 45, no. 25, pp. 8443–8450,
2004.
[9] P. Tehrani, A. Kanciurzewska, X. Crispin, N. D. Robinson,
M. Fahlman, and M. Berggren, “The effect of pH on the
electrochemical over-oxidation in PEDOT:PSS films,” Solid
State Ionics, vol. 177, no. 39-40, pp. 3521–3527, 2007.
[10] M. Sain, S. Ummartyotin, J. Juntaro, C. Wu, and H. Manuspiya,
“Deposition of PEDOT: PSS nanoparticles as a conductive
microlayer anode in OLEDs device by desktop inkjet printer,”
Journal of Nanomaterials, vol. 2011, Article ID 606714, 7 pages,
2011.
[11] J. N. Gavgani, H. S. Dehsari, A. Hasani et al., “A room
temperature volatile organic compound sensor with enhanced
[16]
[17]
[18]
[19]
[20]
[21]
[22]
[23]
[24]
performance, fast response and recovery based on N-doped
graphene quantum dots and poly(3,4-ethylenedioxythiophene)–poly(styrenesulfonate) nanocomposite,” RSC Advances,
vol. 5, no. 71, pp. 57559–57567, 2015.
I. B. Olenych, O. I. Aksimentyeva, L. S. Monastyrskii, Y. Y. Horbenko, and L. I. Yarytska, “Sensory properties of hybrid composites based on poly(3,4-ethylenedioxythiophene)-porous silicon-carbon nanotubes,” Nanoscale Research Letters, vol. 10,
article 187, 2015.
J. Shen, Y. Zhu, X. Yang, and C. Li, “Graphene quantum
dots: emergent nanolights for bioimaging, sensors, catalysis and
photovoltaic devices,” Chemical Communications, vol. 48, no. 31,
pp. 3686–3699, 2012.
Z. P. Zhang, J. Zhang, N. Chen, and L. T. Qu, “Graphene quantum dots: an emerging material for energy-related applications
and beyond,” Energy and Environmental Science, vol. 5, no. 10,
pp. 8869–8890, 2012.
L. Li, G. Wu, G. Yang, J. Peng, J. Zhao, and J.-J. Zhu, “Focusing
on luminescent graphene quantum dots: current status and
future perspectives,” Nanoscale, vol. 5, no. 10, pp. 4015–4039,
2013.
S. Basu and P. Bhattacharyya, “Recent developments on
graphene and graphene oxide based solid state gas sensors,”
Sensors and Actuators B: Chemical, vol. 173, pp. 1–21, 2012.
P. T. Yin, T.-H. Kim, J.-W. Choi, and K.-B. Lee, “Prospects for
graphene-nanoparticle-based hybrid sensors,” Physical Chemistry Chemical Physics, vol. 15, no. 31, pp. 12785–12799, 2013.
B. H. Chu, J. Nicolosi, C. F. Lo, W. Strupinski, S. J. Pearton, and
F. Ren, “Effect of coated platinum thickness on hydrogen detection sensitivity of graphene-based sensors,” Electrochemical and
Solid-State Letters, vol. 14, no. 7, pp. K43–K45, 2011.
M. Zhang and Z. Wang, “Nanostructured silver nanowiresgraphene hybrids for enhanced electrochemical detection of
hydrogen peroxide,” Applied Physics Letters, vol. 102, no. 21, pp.
213104–213106, 2013.
T. S. Sreeprasad, A. A. Rodriguez, J. Colston et al., “Electrontunneling modulation in percolating network of graphene
quantum dots: fabrication, phenomenological understanding,
and humidity/pressure sensing applications,” Nano Letters, vol.
13, no. 4, pp. 1757–1763, 2013.
Q. T. Tran, M. H. H. Tran, D. T. Tong, V. T. Tran, and
N. D. Nguyen, “Synthesis and application of graphene-silver
nanowires composite for ammonia gas sensing,” Advances in
Natural Sciences: Nanoscience and Nanotechnology, vol. 4, no.
4, 2013.
J. Ouyang, C.-W. Chu, F.-C. Chen, Q. Xu, and Y. Yang, “Highconductivity poly(3,4-ethylenedioxythiophene):poly(styrene
sulfonate) film and its application in polymer optoelectronic
devices,” Advanced Functional Materials, vol. 15, no. 2, pp.
203–208, 2005.
G. Lu, S. Park, K. Yu et al., “Toward practical gas sensing with
highly reduced graphene oxide: a new signal processing method
to circumvent run-to-run and device-to-device variations,” ACS
Nano, vol. 5, no. 2, pp. 1154–1164, 2011.
J. T. Robinson, F. K. Perkins, E. S. Snow, Z. Wei, and P. E.
Sheehan, “Reduced graphene oxide molecular sensors,” Nano
Letters, vol. 8, no. 10, pp. 3137–3140, 2008.
Journal of
Nanotechnology
Hindawi Publishing Corporation
Volume 2014
International Journal of
International Journal of
Corrosion
Hindawi Publishing Corporation
Polymer Science
Volume 2014
Hindawi Publishing Corporation
Volume 2014
Smart Materials
Research
Hindawi Publishing Corporation
Journal of
Composites
Volume 2014
Hindawi Publishing Corporation
Volume 2014
Journal of
Metallurgy
BioMed
Research International
Hindawi Publishing Corporation
Volume 2014
Nanomaterials
Hindawi Publishing Corporation
Volume 2014
Submit your manuscripts at
Journal of
Materials
Hindawi Publishing Corporation
Volume 2014
Journal of
Nanoparticles
Hindawi Publishing Corporation
Volume 2014
Nanomaterials
Journal of
Advances in
Materials Science and Engineering
Hindawi Publishing Corporation
Volume 2014
Journal of
Hindawi Publishing Corporation
Volume 2014
Journal of
Nanoscience
Hindawi Publishing Corporation
Scientifica
Hindawi Publishing Corporation
Volume 2014
Journal of
Coatings
Volume 2014
Hindawi Publishing Corporation
Crystallography
Volume 2014
Hindawi Publishing Corporation
Volume 2014
The Scientific
World Journal
Hindawi Publishing Corporation
Volume 2014
Hindawi Publishing Corporation
Volume 2014
Journal of
Journal of
Textiles
Ceramics
Hindawi Publishing Corporation
International Journal of
Biomaterials
Volume 2014
Hindawi Publishing Corporation
Volume 2014
![Tài liệu Báo cáo khoa học: Specific targeting of a DNA-alkylating reagent to mitochondria Synthesis and characterization of [4-((11aS)-7-methoxy-1,2,3,11a-tetrahydro-5H-pyrrolo[2,1-c][1,4]benzodiazepin-5-on-8-oxy)butyl]-triphenylphosphonium iodide doc](https://media.store123doc.com/images/document/14/br/vp/medium_vpv1392870032.jpg)