DSpace at VNU: Retardation of arsenic transport through a Pleistocene aquifer
Bạn đang xem bản rút gọn của tài liệu. Xem và tải ngay bản đầy đủ của tài liệu tại đây (849.46 KB, 5 trang )
LETTER
doi:10.1038/nature12444
Retardation of arsenic transport through a
Pleistocene aquifer
Alexander van Geen1, Benjamı´n C. Bostick1, Pham Thi Kim Trang2, Vi Mai Lan2, Nguyen-Ngoc Mai2, Phu Dao Manh2,
Pham Hung Viet2, Kathleen Radloff1{, Zahid Aziz1{, Jacob L. Mey1,3, Mason O. Stahl4, Charles F. Harvey4, Peter Oates5,
Beth Weinman6{, Caroline Stengel7, Felix Frei7, Rolf Kipfer7,8 & Michael Berg7
Groundwater drawn daily from shallow alluvial sands by millions of
wells over large areas of south and southeast Asia exposes an estimated population of over a hundred million people to toxic levels of
arsenic1. Holocene aquifers are the source of widespread arsenic
poisoning across the region2,3. In contrast, Pleistocene sands deposited in this region more than 12,000 years ago mostly do not host
groundwater with high levels of arsenic. Pleistocene aquifers are
increasingly used as a safe source of drinking water4 and it is therefore important to understand under what conditions low levels of
arsenic can be maintained. Here we reconstruct the initial phase of
contamination of a Pleistocene aquifer near Hanoi, Vietnam. We
demonstrate that changes in groundwater flow conditions and the
redox state of the aquifer sands induced by groundwater pumping
caused the lateral intrusion of arsenic contamination more than 120
metres from a Holocene aquifer into a previously uncontaminated
Pleistocene aquifer. We also find that arsenic adsorbs onto the aquifer sands and that there is a 16–20-fold retardation in the extent of
the contamination relative to the reconstructed lateral movement of
groundwater over the same period. Our findings suggest that arsenic
contamination of Pleistocene aquifers in south and southeast Asia as
a consequence of increasing levels of groundwater pumping may
have been delayed by the retardation of arsenic transport.
This study reconstructs the initial phase of contamination of an
aquifer containing low levels of arsenic (low-As) in the village of Van
Phuc, located 10 km southeast of Hanoi on the banks of the Red River. A
key feature of the site is the juxtaposition of a high-As aquifer upstream
of a low-As aquifer in an area where pumping for the city of Hanoi has
dominated lateral groundwater flow for the past several decades
(Fig. 1a). Many residents of the village of Van Phuc still draw water
from their 30–50-m-deep private wells. In the western portion of the
village, the wells typically contain less than 10 mg of As per litre of water
and therefore meet the World Health Organization guideline for As in
drinking water, whereas As in the groundwater from most wells in
eastern Van Phuc exceeds this guideline by a factor of 10–50 (ref. 5).
Drilling and sediment dating in the area has shown that low-As
groundwater is drawn from orange-coloured sands deposited over
12,000 years ago, whereas high-As groundwater is typically in contact
with grey sands deposited less than 5,000 years ago6,7. We examined to
what extent the boundary between the low-As and high-As aquifers of
Van Phuc has shifted in response to groundwater withdrawals in
Hanoi. This large-scale perturbation spanning several decades has
implications for low-As aquifers throughout Asia that are vulnerable
to contamination owing to accelerated groundwater flow.
The collection of sediment cores and the installation of monitoring
wells was concentrated along a transect trending southeast to northwest that extends over a distance of 2.2 km from the bank of the Red
River (Fig. 1b). Groundwater heads, and therefore the groundwater
velocity field, within Van Phuc respond rapidly to the daily and seasonal
cycles in the water level of the river (Supplementary Information).
Before large-scale groundwater withdrawals, rainfall was sufficient to
maintain groundwater discharge to the river, as is still observed elsewhere along the Red River8. In Van Phuc, however, the groundwater
level was on average 40 cm below that of the water level of the Red River
in 2010–11 and the hydraulic gradient nearly always indicated flow
from the river into the aquifer. The reversal of the natural head gradient
is caused by the large depression in groundwater level centred 10 km to
the northwest that induces groundwater flow along the Van Phuc
transect from the river towards Hanoi (Fig. 1a). This perturbation of
groundwater flow is caused by massive pumping for the municipal
water supply of Hanoi9–11, which nearly doubled from 0.55 million to
0.90 million cubic metres per day between 2000 and 2010 owing to the
rapid expansion of the city (Supplementary Fig. 1).
A change in the colour of a clay layer capping sandy sediment along
the transect defines a geological boundary between the two portions of
the Van Phuc aquifer. Up to a distance of 1.7 km from the river bank,
the clay capping the aquifer is uniformly grey with the exception of a
thin brown interval at the very surface (Fig. 2b). In contrast, a readily
identifiable sequence of highly oxidized bright yellow, red and white
clays was encountered between 12 m and 17 m depth at all drill sites
along the transect beyond a distance of 1.7 km from the river bank.
This oxidized clay layer is probably a palaeosol dating to the last sealevel low-stand about 20,000 years ago7,12.
The colour of aquifer sands below the upper clay layer also changes
markedly along the Van Phuc transect. Sand colour in fluvio-deltaic
deposits is controlled primarily by the extent to which Fe(III) has been
reduced to Fe(II) by the decomposition of organic carbon13. Up to a
distance of 1.6 km from the river bank, sandy drill cuttings within the
20–40 m depth range are uniformly grey. The predominance of orange
sands beyond 1.6 km indicates oxidation during the previous sea-level
low-stand. After the sea level rose back to its current level, the nature of
the remaining organic carbon precluded a new cycle of Fe(III) reduction14.
Independently of sediment colour, the calcium (Ca) content of sand
cuttings collected while drilling along the Van Phuc transect confirms
that a geological boundary extends to the underlying aquifer sands.
Within the southeastern portion of the aquifer that is not capped by the
presumed palaeosol, X-ray fluorescence measurements indicate Ca
concentrations of over 2,000 mg Ca per kg of sand in cuttings to a
depth of 30 m (Fig. 2a). The groundwater in this portion of the aquifer
is supersaturated with respect to calcite and dolomite6, suggesting that
authigenic precipitation is the source of Ca in the grey drill cuttings, as
previously proposed elsewhere12 (Supplementary Fig. 2). At a distance
of 1.7 km from the river and further to the northwest, instead, the Ca
1
Lamont-Doherty Earth Observatory (LDEO), Columbia University, Palisades, New York 10964, USA. 2Research Centre for Environmental Technology and Sustainable Development (CETASD), Hanoi
University of Science, Vietnam National University, Hanoi, Vietnam. 3Department of Physical Sciences, Kingsborough Community College, Brooklyn, New York 11235, USA. 4Massachusetts Institute of
Technology, Cambridge, Massachusetts 02139, USA. 5Anchor QEA, Montvale, New Jersey 07645, USA. 6Earth and Environmental Sciences, Vanderbilt University, Nashville, Tennessee 37235, USA. 7Eawag,
Swiss Federal Institute of Aquatic Science and Technology, 8600 Du¨bendorf, Switzerland. 8Institute of Geochemistry and Petrology, Swiss Federal Institute of Technology, Zurich ETHZ 8092, Switzerland.
{Present addresses: Gradient, Cambridge, Massachusetts 02138, USA (K.R.); Sadat Associates, Trenton, New Jersey 08610, USA (Z.A.); Earth and Environmental Sciences, California State University,
Fresno, California 93740, USA (B.W.).
2 0 4 | N AT U R E | VO L 5 0 1 | 1 2 S E P T E M B E R 2 0 1 3
©2013 Macmillan Publishers Limited. All rights reserved
LETTER RESEARCH
a
m
Re
dR
–14
ive
r
Hanoi
–12 m
–10 m
Van Phuc
N
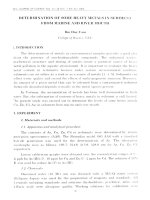
Figure 1 | Map of the Hanoi area extending south to the study site.
a, Location of the village of Van Phuc in relation to the cone of depression
formed by groundwater pumping for the municipal water supply of Hanoi
(white contours, adapted from ref. 10). Urbanized areas are shown in grey;
largely open fields are shown in green. b, Enlarged view of Van Phuc (box shows
location in a) from Google Earth showing the location of the transect along
which groundwater and sediment were collected, with tickmark labels
indicating distance from the Red River bank in kilometres. Symbol colour
distinguishes the uniformly grey Holocene aquifer (red), the Pleistocene aquifer
contaminated with As (yellow), the Pleistocene aquifer where the groundwater
conductivity and dissolved inorganic carbon concentrations are high but As
concentrations are not (green), and the Pleistocene aquifer without indication
of contamination (blue), all within the 25–30-m depth interval. Three white
asterisks identify the wells that were used to determine flow direction. Image
copyright 2012 Digital Globe Google Earth. c, Rose diagram frequency plot of
the head gradient direction based on data collected at 5-min intervals (numbers
indicate the number of observations) from these three wells from September
2010 to June 2011.
2 km
b
*
*
*
c
330º
0
30º
300º
60º
30,000
20,000
270º
90º
10,000
120º
240º
210º
180º
150º
content of orange sand cuttings systematically remains less than 100 mg
Ca per kg and the groundwater is undersaturated with respect to calcite
and dolomite. Unlike surficial shallow grey clays, the Ca content of the
presumed palaeosol is also very low (,100 mg Ca per kg) and consistent with extensive weathering.
The redox state of the aquifer has a major impact on the composition of groundwater in Van Phuc, as reported elsewhere in Vietnam15
and across south and east Asia more generally3. High but harmless
Fe(II) concentrations in groundwater (10–20 mg per litre) associated
with grey reducing sediments are apparent to residents of eastern Van
Phuc as an orange Fe(III) precipitate that forms in their water upon
exposure to air (Supplementary Fig. 3). In contrast, the high and toxic
concentrations of As in groundwater at 20–30 m depth within the
same portion of the transect, ranging from 200 mg per litre near the
river to levels as high as 600 mg per litre at 1.2–1.6 km from the river
bank, are invisible (Fig. 2c). The groundwater in contact with Pleistocene sands in northwestern Van Phuc is also anaerobic but contains
less than 0.5 mg Fe(II) per litre and less than 10 mg As per litre and
shows little indication of organic carbon mineralization compared to
the Holocene aquifer (Supplementary Fig. 4).
The Pleistocene portion of the Van Phuc aquifer adjacent to the
Holocene sediment is not uniformly orange or low in As. Of particular
interest is a layer of grey sand at 25–30 m depth extending to the
northwest at a distance of 1.7–1.8 km from the river bank (Fig. 2b).
The intercalation of grey sand between orange sands above and below,
combined with the low Ca content of sand cuttings within this layer,
indicate that it was deposited during the Pleistocene and therefore
until recently oxidized and orange in colour. Within the portion of
the Pleistocene aquifer that became grey and is closest to the geological
boundary, groundwater As concentrations are therefore presumed to
have been originally very low (,5 mg per litre). Actual As concentrations of 100–500 mg per litre, as high as in the adjacent Holocene
aquifer, indicate contamination extending over a distance of about
120 m into the Pleistocene aquifer (Fig. 3a).
A subset of the transect wells was sampled in 2006 and analysed for
tritium (3H) as well as noble gases in order to measure groundwater
ages and determine the rate of As intrusion into the Pleistocene aquifer. Atmospheric nuclear weapons testing in the 1950s and 1960s is the
main source of 3H that entered the hydrological cycle16. The distribution of 3H indicates that only groundwater in the southeastern highAs portion of the aquifer contains a plume of recharge dating from the
1950s and later. Concentrations of 3He, the stable decay product of 3H,
were used to calculate groundwater ages for eight wells in the 24–42-m
depth range with detectable levels of 3H. In 2006, the oldest water dated
by the 3H–3He method (Supplementary Fig. 5) was sampled at a distance of 1.6 km from the river, which is the most northwestern location
along the transect where the aquifer is uniformly grey (Fig. 2b, d).
Younger ages of 15 years and 17 years were measured closer to the
river at 1.3 km and 1.5 km, respectively. Concentrations of 3H, groundwater 3H–3He ages, and hydraulic head gradients consistently indicate
that the Holocene aquifer has been recharged by the river from the
southeast within the past few decades.
Drilling and geophysical data indicate that the main groundwater
recharge area extends from the centre of the Red River to the inland
area where a surficial clay layer thickens markedly, that is, from 100 m
southeast to 300 m northwest of the river bank (Supplementary Fig. 6).
The relationship between groundwater ages and travel distance from
the recharge area implies accelerating flow drawn by increased Hanoi
pumping (Supplementary Fig. 7). A simple transient flow model
for the Van Phuc aquifer yields average advection rates of 38 m yr21
and 48 m yr21 towards Hanoi since 1951 and 1971, respectively (Supplementary Discussion). According to these two pumping scenarios,
1 2 S E P T E M B E R 2 0 1 3 | VO L 5 0 1 | N AT U R E | 2 0 5
©2013 Macmillan Publishers Limited. All rights reserved
RESEARCH LETTER
6,000
4,000
40
2,000
0.6
20
0.4
40
60
0
0
600
Depth (m)
500
20
400
300
40
200
100
60
d
0
0
Depth (m)
40
20
30
20
40
10
60
0
2.0
1.8
1.6
Ground water age (yr)
50
1.4
Distance from river bank (km)
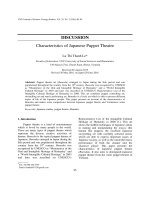
Figure 2 | Contoured sections of sediment and water properties based on
data collected between 1.3 km and 2.0 km from the Red River bank. The
location and number of samples indicated as black dots varies by type of
measurement. a, Concentration of Ca in sand cuttings measured by X-ray
fluorescence. Also shown are the boundaries separating the two main aquifers
and the palaeosol overlying the Pleistocene aquifer. ‘2000’ labels the contour for
2,000 mg Ca per kg. b, Difference in diffuse spectral reflectance between 530 nm
and 520 nm, indicative of the colour of freshly collected drill cuttings13. The
contour labels correspond to the percentage difference in reflectance shown by
the colour scale. c, Concentrations of As in groundwater collected in 2006 with
the needle sampler and in 2011 by monitoring wells along the transect. ‘10’
labels the contour for the WHO guideline, 10 mg As per litre. d, Groundwater
ages relative to recharge determined by 3H–3He dating of groundwater samples
collected from a subset of the monitoring wells in 2006. The portion of the
Pleistocene aquifer that became reduced and where As concentrations
presumably increased over time is located within the large white arrow pointing
in the direction of flow. The plot was drawn with Ocean Data View
( />
groundwater originating from the Holocene portion of the aquifer was
transported 2,000–2,300 m into the Pleistocene sands by 2011, when the
transect was sampled for analysis of As and other groundwater constituents.
The sharp decline in As concentrations between 1.60 km and
1.75 km from the river bank indicates that migration of the As front
across the geological boundary was retarded by a factor of 16 to 20
relative to the movement of the groundwater (Fig. 3a). Without
retardation, attributable to As adsorption onto aquifer sands, the entire
Pleistocene aquifer of Van Phuc would already be contaminated. The
retardation is derived from several decades of perturbation and is at the
low end of previous estimates by other methods, typically measured
within days to weeks17–22, and therefore predicts greater As mobility
than most previous studies. The retardation measured in Van Phuc
integrates the effect of competing ions typically present at higher concentrations in the Holocene aquifer (Supplementary Fig. 4) as well as
200
100
0
10
b
8
6
4
2
2.1
1.9
1.7
DOC concentration (mg per litre)
Depth (m)
0.8
Reflectance 530–520 nm Groundwater As (μg per litre)
0
0.2
c
300
0
60
b
400
R = 40
Holocene aquifer
Pleistocene aquifer
500
R = 20
Depth (m)
20
R=1
As concentration (μg per litre)
8,000
a
R = 16
10,000
Holocene clay
Palaeosol
R=5
0
Cuttings Ca (mg kg–1)
a
0
1.5
Distance from river (km)
Figure 3 | Distribution of arsenic and dissolved organic carbon in
groundwater within the 25–30-m depth interval along the Van Phuc
transect. Symbols are coloured according to the classification in Fig. 1. Grey and
orange shading indicates the extent of the grey Holocene aquifer and the portion
of the Pleistocene aquifer that is still orange, respectively. The intermediate area
without shading indicates the portion of the Pleistocene aquifer that became grey.
Shown as dotted lines are predicted As concentrations bracketing the
observations with retardation factors R of 16 and 20 and an average advection
velocity of 43 m yr21 over the 50 years preceding the 2011 sampling
(Supplementary Discussion). a, Also shown are predicted concentrations for As
assuming retardation factors of 1, 5 and 40 and the same average rate of advection.
b, For visual reference, predicted dissolved organic carbon concentrations are
shown as dotted lines according to the same advection velocity and retardation
factors of 16, 20 and 40, assuming there was no detectable dissolved organic
carbon in the Pleistocene aquifer before the perturbation.
the impact of Fe oxyhydroxide reduction. However, the extent to which
contamination was caused by either As transport from the adjacent
Holocene aquifer or reductive dissolution of Fe(III) oxyhydroxides and
in situ As release to groundwater cannot be determined from the
available data (Supplementary Fig. 8).
The sharp drop in dissolved organic carbon concentrations across
the geological boundary from 9 mg per litre to about 1 mg per litre
indicates rapid organic carbon mineralization coupled to the reduction
of Fe(III) oxyhydroxides and explains the formation of a plume of grey
sands within the Pleistocene aquifer (Fig. 3b). On the basis of a stoichiometric Fe/C ratio of 4 (ref. 15), the dissolved organic carbon supplied by flushing the aquifer 30 times with groundwater from the
Holocene aquifer would be required to turn Pleistocene sands from
orange to grey by reducing half of their 0.1% reactive Fe(III) oxyhydroxide content23, assuming a porosity of 0.25. Given that groundwater
was advected over a distance of 2,000–2,300 m across the geological
boundary over the past 40–60 years, we would predict that the plume of
grey sands extends 65–75 m into the Pleistocene aquifer. This is somewhat less than is observed (Fig. 3), possibly due to additional reduction
by H2 advected from the Holocene portion of the aquifer14. The Van
Phuc observations indicate that dissolved organic carbon advected
from a Holocene aquifer can be at least as important for the release
of As to groundwater as autochthonous organic carbon12,24–27.
Contamination of Pleistocene aquifers has previously been invoked
in the Red River and the Bengal basins11,12,28, but without the benefit of
2 0 6 | N AT U R E | VO L 5 0 1 | 1 2 S E P T E M B E R 2 0 1 3
©2013 Macmillan Publishers Limited. All rights reserved
LETTER RESEARCH
a well-defined hydrogeological context. The Pleistocene aquifer of Van
Phuc was contaminated under the conducive circumstances of accelerated lateral flow. Although downward groundwater flow and therefore penetration of As will typically be slower, the Van Phuc findings
confirm that the vulnerability of Pleistocene aquifers will depend on
the local spatial density of incised palaeo-channels that were subsequently filled with Holocene sediments12. Owing to retardation, concentrations of As in a Pleistocene aquifer will not increase suddenly but
over timescales of decades even in the close vicinity of a Holocene
aquifer. This is consistent with the gradual increase in groundwater
As concentrations documented by the few extended time series available from such a vulnerable setting29. However, concentrations of As
could rise more rapidly where flow accelerates beyond the rate documented in Van Phuc, closer to Hanoi for instance.
METHODS SUMMARY
A total of 41 wells were installed in Van Phuc in 2006–11. The water levels of the
river and in the wells were recorded from September 2010 to June 2011 using
pressure transducers and adjusted to the same elevation datum after barometric
corrections. The magnitude and direction of the head gradient within the 25–30-m
depth interval was calculated from water level measurements in three wells
(Fig. 1b). In 2006, a subset of the wells was sampled for noble gas and tritium
(3H) analysis at a high flow rate using a submersible pump to avoid degassing. The
samples were analysed by mass spectrometry in the Noble Gas Laboratory at ETH
Zurich. 3H concentrations were determined by the 3He ingrowth method30.
Groundwater As, Fe and Mn concentrations measured by high-resolution inductively coupled plasma mass spectrometry at LDEO represent the average for
acidified samples collected in April and May 2012. Further details are provided
in the Supplementary Information.
Full Methods and any associated references are available in the online version of
the paper.
Received 17 December 2012; accepted 11 July 2013.
1.
Ravenscroft, P., Brammer, H. & Richards, K. Arsenic Pollution: A Global Synthesis
(RGS-IBG Book Series, Wiley-Blackwell, 2009).
2. BGS/DPHE. (British Geological Survey, Department of Public Health Engineering)
Arsenic Contamination of Groundwater in Bangladesh Final Report,
(British Geological Survey, 2001).
3. Fendorf, S., Michael, H. A. & van Geen, A. Spatial and temporal variations of
groundwater arsenic in south and southeast Asia. Science 328, 1123–1127
(2010).
4. Ahmed, M. F. et al. Epidemiology: ensuring safe drinking water in Bangladesh.
Science 314, 1687–1688 (2006).
5. Berg, M. et al. Magnitude of arsenic pollution in the Mekong and Red River deltas—
Cambodia and Vietnam. Sci. Total Environ. 372, 413–425 (2007).
6. Eiche, E. et al. Geochemical processes underlying a sharp contrast in groundwater
arsenic concentrations in a village on the Red River delta, Vietnam. Appl. Geochem.
23, 3143–3154 (2008).
7. Funabiki, A., Haruyama, S., Quy, N. V., Hai, P. V. & Thai, D. H. Holocene delta plain
development in the Song Hong (Red River) delta, Vietnam. J. Asian Earth Sci. 30,
518–529 (2007).
8. Larsen, F. et al. Controlling geological and hydrogeological processes in an arsenic
contaminated aquifer on the Red River flood plain, Vietnam. Appl. Geochem. 23,
3099–3115 (2008).
9. Thu, T. M. & Fredlund, D. G. Modelling subsidence in the Hanoi City area, Vietnam.
Can. Geotech. J. 37, 621–637 (2000).
10. Berg, M. et al. Hydrological and sedimentary controls leading to arsenic
contamination of groundwater in the Hanoi area, Vietnam: the impact of ironarsenic ratios, peat, river bank deposits, and excessive groundwater abstraction.
Chem. Geol. 249, 91–112 (2008).
11. Winkel, L. H. E. et al. Arsenic pollution of groundwater in Vietnam exacerbated by
deep aquifer exploitation for more than a century. Proc. Natl Acad. Sci. USA 108,
1246–1251 (2011).
12. McArthur, J. M. et al. How paleosols influence groundwater flow and arsenic
pollution: a model from the Bengal Basin and its worldwide implication. Wat.
Resour. Res. 44, W11411 (2008).
13. Horneman, A. et al. Decoupling of As and Fe release to Bangladesh groundwater
under reducing conditions. Part I: evidence from sediment profiles. Geochim.
Cosmochim. Acta 68, 3459–3473 (2004).
14. Postma, D. et al. Groundwater arsenic concentrations in Vietnam controlled by
sediment age. Nature Geosci. 5, 656–661 (2012).
15. Postma, D. et al. Arsenic in groundwater of the Red River floodplain,Vietnam:
controlling geochemical processes and reactive transport modeling. Geochim.
Cosmochim. Acta 71, 5054–5071 (2007).
16. Kipfer, R., Aeschbach-Hertig, W., Peeters, F. & Stute, M. Noble gases in lakes and
ground waters. Rev. Mineral. Geochem. 47, 615–700 (2002).
17. Stollenwerk, K. G. et al. Arsenic attenuation by oxidized aquifer sediments in
Bangladesh. Sci. Total Environ. 379, 133–150 (2007).
18. van Geen, A. et al. Flushing history as a hydrogeological control on the regional
distribution of arsenic in shallow groundwater of the Bengal Basin. Environ. Sci.
Technol. 42, 2283–2288 (2008).
19. Nath, B. et al. Mobility of arsenic in the sub-surface environment: an integrated
hydrogeochemical study and sorption model of the sandy aquifer materials.
J. Hydrol. 364, 236–248 (2009).
20. Itai, T. et al. Variations in the redox state of As and Fe measured by X-ray absorption
spectroscopy in aquifers of Bangladesh and their effect on As adsorption. Appl.
Geochem. 25, 34–47 (2010).
21. Radloff, K. A. et al. Arsenic migration to deep groundwater in Bangladesh
influenced by adsorption and water demand. Nature Geosci. 4, 793–798 (2011).
22. Jessen, S. et al. Surface complexation modeling of groundwater arsenic mobility:
results of a forced gradient experiment in a Red River flood plain aquifer, Vietnam.
Geochim. Cosmochim. Acta 98, 186–201 (2012).
23. Dhar, R. K. et al. Microbes enhance mobility of arsenic in Pleistocene aquifer sand
from Bangladesh. Environ. Sci. Technol. 45, 2648–2654 (2011).
24. Islam, F. S. et al. Role of metal-reducing bacteria in arsenic release from Bengal
delta sediments. Nature 430, 68–71 (2004).
25. Polizzotto, M. L., Kocar, B. D., Benner, S. B., Sampson, M. & Fendorf, S. Near-surface
wetland sediments as a source of arsenic release to ground water in Asia. Nature
454, 505–508 (2008).
26. Neumann, R. B. et al. Anthropogenic influences on groundwater arsenic
concentrations in Bangladesh. Nature Geosci. 3, 46–52 (2010).
27. Mailloux, B. J. et al. Advection of surface-derived organic carbon fuels microbial reduction in Bangladesh groundwater. Proc. Natl Acad. Sci. USA 110, 5331–5335 (2013).
28. Mukherjee, A. et al. Elevated arsenic in deeper groundwater of the western Bengal
basin, India: extent and controls from regional to local scale. Appl. Geochem. 26,
600–613 (2011).
29. McArthur, J. M. et al. Migration of As, and 3H-3He ages, in groundwater from West
Bengal: implications for monitoring. Water Res. 44, 4171–4185 (2010).
30. Beyerle, U. et al. A mass spectrometric system for the analysis of noble gases and
tritium from water samples. Environ. Sci. Technol. 34, 2042–2050 (2000).
Supplementary Information is available in the online version of the paper.
Acknowledgements This study was supported by NSF grant EAR 09-11557, the Swiss
Agency for Development and Cooperation, grant NAFOSTED 105-09-59-09 to
CETASD, and NIEHS grants P42 ES010349 and P42 ES016454. This is
Lamont-Doherty Earth Observatory contribution number 7698.
Author Contributions A.v.G., M.B., P.T.K.T., P.O. and B.C.B. conceived the study. V.M.L.,
N.-N.M, P.D.M., P.T.K.T. and P.H.V. were responsible for organizing the field work and
carrying out the monitoring throughout the study. K.R., Z.A. and B.W. participated in the
field work in 2006. M.O.S. processed the hydrological data and carried out the flow
modelling under the supervision of C.F.H. and P.O. J.L.M. was responsible for
groundwater analyses at LDEO, C.S. for those at Eawag, and F.F. for noble gas
measurements in R.K.’s laboratory. A.v.G. drafted the paper, which was then edited by
all co-authors.
Author Information Reprints and permissions information is available at
www.nature.com/reprints. The authors declare no competing financial interests.
Readers are welcome to comment on the online version of the paper. Correspondence
and requests for materials should be addressed to A.v.G.
().
1 2 S E P T E M B E R 2 0 1 3 | VO L 5 0 1 | N AT U R E | 2 0 7
©2013 Macmillan Publishers Limited. All rights reserved
RESEARCH LETTER
METHODS
Drilling. A first set of 25 wells, including two nests of nine and ten wells tapping
the depth range of the Holocene and Pleistocene aquifers, respectively, were
installed in Van Phuc in 2006 (ref. 6). Another 16 monitoring wells were installed
between December 2009 and November 2011. Three additional holes were drilled
to collect cuttings without installing a well. All holes were drilled by flushing the
hole with water through a rotating drill bit.
Needle sampling. In 2006, drilling was briefly interrupted at seven sites to increase
the vertical resolution of both sediment and groundwater data using the needle
sampler31. Groundwater was pressure-filtered under nitrogen directly from the
sample tubes. As a measure of the pool of mobilizable As, sediment collected with
the needle sampler was subjected to a single 24-hour extraction in a 1 M PO4
solution at pH 5 (ref. 32).
Water level measurements. A theodolite elevation survey of the well and river
measurement points were carried out in June 2010 by a surveying team from
Hanoi University of Science. Water level data in both the wells and river were
recorded using Solinst Levelogger pressure transducers. A barometric pressure
logger was also deployed at the field site. Water level and barometric data were
recorded at 5-min intervals and all water level data was barometrically corrected.
The barometrically corrected water level data from each logger was then adjusted
to the surveyed elevation of their respective measurement point so that all of the
data was referenced to the same elevation datum.
Groundwater flow. The magnitude and direction of the head gradient within the
25–30-m depth of the aquifer at Van Phuc was calculated using the barometrically
adjusted and survey-referenced water level data collected at 5-min intervals from
September 2010 to June 2011 in three wells located near the centre of the transect
(Fig. 1b). A least-squares fit of a plane was calculated for each set of simultaneous
water levels at these three wells, and from this set of planes the magnitude and
direction of the head gradient at 5-min intervals was directly computed.
Groundwater analysis. In 2006, a subset of the monitoring wells was sampled
along a vertical transect for noble gas and tritium (3H) analysis. After purging the
wells, the samples were taken using a submersible pump. To avoid degassing of the
groundwater owing to bubble formation during sampling the water was pumped
at high rates to maintain high pressure. The samples for noble gas and 3H analysis
were put into copper tubes and sealed gastight using pinch-off clamps. All samples
were analysed for noble gas concentrations and the isotope ratios 3He/4He,
20
Ne/22Ne and 36Ar/40Ar using noble gas mass spectrometry in the Noble Gas
Laboratory at ETH Zurich30,33. 3H concentrations were determined by the 3He
ingrowth method using a high-sensitivity compressor-source noble gas mass
spectrometer. 3H–3He ages were calculated according to the equations listed in
ref. 34, taking into account an excess air correction. When comparing the reconstructed original 3H content of each sample as a function of 3H–3He age with the
3
H input function for south and southeast Asia (Supplementary Fig. 5), most
samples follow the trend expected from simple plug flow34,35.
Several days before analysis by high-resolution inductively coupled plasma
mass spectrometry at LDEO, groundwater was acidified to 1% Optima HCl in
the laboratory36. This has been shown to re-dissolve entirely any precipitates that
could have formed37. In most cases, the difference between duplicates was within
the analytical uncertainty of ,5%. With the exception of needle-sample data and
the nest of ten wells in the Holocene portion of the aquifer, which had to yield to
construction, groundwater As, Fe and Mn concentrations reported here represent
the average for samples collected without filtration in April and May 2012. Groundwater data from 2006 were previously reported in refs 6 and 31.
Dissolved organic carbon samples were collected in 25-ml glass vials combusted
overnight at 450 uC and acidified to 1% HCl at the time of collection. Dissolved
inorganic carbon samples were also collected in 25-ml glass vials with a Teflon
septum but were not acidified. Both dissolved organic carbon (‘‘NPOC’’) and
dissolved inorganic carbon (by difference of ‘‘TC-NPOC’’) were analysed on a
Shimadzu TOC-V carbon analyser calibrated with K phthalate standards.
Ammonium samples were collected in polypropylene bottles after passing
through 0.45 mm cellulose acetate membrane filters and preserved by acidifying
to pH , 2 with HNO3. NH41 concentrations were analysed on a spectrophotmeter (UV-3101, Shimadzu) at a wavelength of 690 nm after forming a complex
with nitroferricyanide38.
Methane (CH4) samples were filled up to about half of the pre-vacuumed glass
vials and immediately frozen in dry ice. The analyses were performed no longer
than ten days after sampling. Headspace CH4 in the vials was measured on a
Shimadzu 2014 gas chromatograph with a Porapak T packed column14.
Sediment analysis. As a measure of the redox state of Fe in acid-leachable oxyhydroxides, the diffuse spectral reflectance spectrum of cuttings from all sites was
measured on samples wrapped in Saran wrap and kept out of the sun within 12
hours of collection using a Minolta 1600D instrument13. Starting in 2009, the
coarse fractions of the drill cuttings were analysed by X-ray fluorescence for a
suite of elements including Ca using an InnovX Delta instrument. The drill cuttings were resuspended in water several times to eliminate the overprint of Caenriched clays contained in the recycled water used for drilling. The washed
samples were run as is, without drying or grinding to powder. Analyses of NIST
reference material SRM2711 (28,800 6 800 mg Ca per kg) analysed by X-ray
fluorescence at the beginning and end of each run averaged 30,200 6 400 mg Ca
per kg (n 5 16).
31.
32.
33.
34.
35.
36.
37.
38.
van Geen, A. et al. Comparison of arsenic concentrations in simultaneouslycollected groundwater and aquifer particles from Bangladesh, India, Vietnam,
and Nepal. Appl. Geochem. 23, 3244–3251 (2008).
Zheng, Y. et al. Geochemical and hydrogeological contrasts between shallow and
deeper aquifers in two villages of Araihazar, Bangladesh: implications for deeper
aquifers as drinking water sources. Geochim. Cosmochim. Acta 69, 5203–5218
(2005).
Frei, F. Groundwater dynamics and arsenic mobilization near Hanoi (Vietnam)
assessed using noble gases and tritium. Diploma thesis, ETH Zurich (2007).
Klump, S. et al. Groundwater dynamics and arsenic mobilization in Bangladesh
assessed using noble gases and tritium. Environ. Sci. Technol. 40, 243–250
(2006).
Stute, M. et al. Hydrological control of As concentrations in Bangladesh
groundwater. Wat. Resour. Res. 43, W09417 (2007).
Cheng, Z., Zheng, Y., Mortlock, R. & van Geen, A. Rapid multi-element analysis of
groundwater by high-resolution inductively coupled plasma mass spectrometry.
Anal. Bioanal. Chem. 379, 512–518 (2004).
van Geen, A. et al. Monitoring 51 deep community wells in Araihazar, Bangladesh,
for up to 5 years: implications for arsenic mitigation. J. Environ. Sci. Health A 42,
1729–1740 (2007).
Koroleff, F. In Methods of Seawater Analysis (ed. Grasshoft, K.) 126–133 (Chemie,
1974).
©2013 Macmillan Publishers Limited. All rights reserved