Determination of the activity concentration of plant samples by gammaray spectrometrometry
Bạn đang xem bản rút gọn của tài liệu. Xem và tải ngay bản đầy đủ của tài liệu tại đây (1.32 MB, 42 trang )
VIETNAM NATIONAL UNIVERSITY, HANOI
VNU UNIVERSITY OF SCIENCE
FACULTY OF PHYSICS
----------------
Nguyen Thi Diem
Determination of the activity concentration of
plant samples by gamma-ray spectrometrometry
Submitted in partial fulfillment of the requirements for the degree
of Bachelor of Science in Nuclear Technology
(Advanced program)
Supervisors: Bui Văn Loat Assoc.Prof
Vu Thi Kim Duyen,MSc
Ha Noi - 2017
ACKNOWLEDGEMENT
I would like to express my gratitude to my supervisor, Assoc.Prof. Bui Van
Loat and Master Vu Thi Kim Duyen for their trust in me which encouraged me to
know the strength in myself and motivated me to work harder and achieve this
success.
My sincere thanks are also extended to Center for Technology Environment
Treatment where has helps me to finish the practical part of my research.
Besides, I would like to thank all teachers, lecturers, researchers and other
seniors in Faculty of Physics, particularly Department of Nuclear Technology, VNU
University of Science, who always create good conditions for students to study and
research.
I would like to give special thanks to my family and all my friends who have
supported and promoted me in studying and researching. They have become my
faith and motivation throughout a hard time.
Student,
Nguyen Thi Diem
List of Figure
Fig.1.1 Schematic of the exponential decay of activity for 210Pb.............................. 4
Fig.1.2 Radioactive decay chains of 232Th ................................................................6
Fig.1.3 Radioactive decay chains of 238U.................................................................7
Fig.1.4 Radioactive decay chains of 235U.................................................................7
Fig.1.5 The pathway of radionuclides to man .........................................................10
Fig.2.1 The diagram of gamma -ray spectrometry system ......................................13
Fig 3.1 Graph of the energy-channel dependence ..................................................18
Fig 3.2 The TN1 spectroscopy was measured in counting time t=197058s ..........19
Fig 3.3 Establishment of efficiency calibration curve ............................................21
Fig.3.4 Comparison of 226Ra among plant samples in the present work ................26
Fig.3.5 Comparison of 232Th among plant samples in the present work .................27
Fig.3.6 Comparison of 40K among plant samples in the present work ....................28
List of Table
Table 1.1 Some common cosmogenic nuclides..........................................................8
Table 1.2 Some Man-made radionuclides................................................................ 9
Table 2.1 Sampling stations....................................................................................12
Table 3.1 The energy-channel dependence .............................................................18
Table 3.4 The efficiency at full-absorption peak of gamma radiation ...................20
Table 3.2 Minimum Detectable Activity of gamma-ray system.............................. 21
Table 3.3 The activity value of radioactive isotopes ..............................................22
Table 3.4 Activity concentration of analytical samples .........................................23
Table 3.5 Average activity concentration of 226Ra, 232Th, 40K.............................. 25
Table 3.6 Compare of activity concentration of 226Ra, 232Th, 40K (in Bq/kg) in some
vegetable ..................................................................................................................26
Contents
CHAPTER 1................................................................................................................2
LITERATURE REVIEWS .........................................................................................3
1.1. Phenomenon and the radioactive decay law .....................................................3
1.1.1. The radioactive decay law .............................................................................3
1.1.2. The radioactive decay chains ........................................................................4
1.2. Radioactive in nature .......................................................................................5
1.2.1. Primordial Radioisotopes ..............................................................................5
1.2.2. Cosmogenic radioisotopes .............................................................................8
1.3. Artificial radioisotopes .....................................................................................8
1.4 Transfer of the radioactive isotopes from soil into plant .................................9
1.5 Characteristic of radioactive concentration in plant samples ..........................11
1.5.1 The original of radionuclides in plant samples ............................................11
CHAPTER 2..............................................................................................................12
MATERIALS AND EXPERIMENTAL METHODS ..............................................12
2.1 Collecting samples ...........................................................................................12
2.1.1 Sampling stations ..........................................................................................12
2.1.2 Preparation of samples ................................................................................12
2.2 Equipment .......................................................................................................13
2.3 Analytical Methods ..........................................................................................14
2.3.1 Gamma spectrum analysis ............................................................................14
CHAPTER 3..............................................................................................................18
RESULTS AND DISCUSSION ...............................................................................18
3.1 Establishment of energy calibration and efficiency calibration curve ............18
3.1.1 Establishment of energy calibration .............................................................18
3.1.2. Establishment of efficiency calibration curve .............................................19
3.2 Results of the activity concentration in plant samples ....................................22
3.2.1 Calculation of Radionuclides .......................................................................22
3.1.2 Results and Discussion .................................................................................26
Conclusion.................................................................................................................30
REFERENCES ......................................................................................................31
APPENDICES ...........................................................................................................33
Determination of the activity concentration of plant samples by gamma-ray
spectrometry
Student: Nguyen Thi Diem
Student ID:13000151
Course: QH.2013.T.CQ
Faculty: Physics
Supervisors: Bui Van Loat
Vu Thi Kim Duyen
Abstract
This study is aimed at the determination of contamination of natural
radionuclides such as 226Ra, 232Th, 40K in plants. This present work determined of
activity concentration of radionuclides in plant samples (rice, bean, corn, potato),
which was collected at Ha Noi, Hai Duong-Viet Nam, and Laos. The samples were
dried, sealed and kept in a cylindrical container and stored for a period of 30 days.
They were counted and quantified using high purity germanium (HPGe) detector to
analyze spectrometer at respective progeny energy then calculated activity
concentation of plant samples in analytical areas. Radionuclides in analytical
samples observed include
226
Ra,
232
Th,
40
K. The activity concentration of these
radionuclides was found in the following ranges: 0.21 to 2.47; 0.19 to 1.98; 27.66 to
382.87 (Bq/kg) respectively. The data is discussed and compared with those given
in another study such as USA, Iran, Southern Serbia.
40
K,
Keywords: Natural radionuclides, activity concentration, HPGe detector,
Ra, 232Th.
226
1
Introduction
Radioactivity has always existed in the environment. The radioactive sources in
the environment can be divided into two main categories: Natural radioactivity
include radioactive isotopes from Earth’s surface or the primordial radioactive
isotopes ( the radioactive isotopes of decay chains of 40K, 238U, 232Th) and
cosmogenic radioisotopes which produced as a result of the interaction of cosmic
rays with the Earth’s material; artificial radioactive isotopes (137Cs) which produced
by man-made such as medical and industrial uses of radioisotopes, nuclear testing
weapon, nuclear accidents, the operation of nuclear power plants and mining….
The radioisotopes in upper layers of the atmosphere have polluted the Earth. The
process depends on the meteor, the climate, the geochemist... Besides, the other
man-made also makes the change of distributing of radioisotopes as by- produced
from nuclear fuel cycle and other from mining, fuel enrichment, fuel airborne
particles may be intercepted by plants or return to the top soil. These radioisotopes
can be transferred to human through the food chain, so it caused danger to their
health. There are two ways to absorb radioactive into the plant,which is: deposition
on leaves and fruit and deposition onto soil and uptake by plants through the roots.
Evaluation of the process radioisotopes moves from soil to plants is very
importance. Internal exposure and external exposure in the human body may grow
up the probability of induced cancer and various radiation-induced problems in the
body of human and may be detrimental to the whole population. In particular, this
study can estimate of radioisotopes in Ha Noi’s surface and compare it with near
areas, such as Hai Duong province and Laos.
The content of the thesis includes three chapters:
Chapter 1: Literature Reviews
Chapter 2: Material and Methods
Chapter 3: Results and Discussion
2
CHAPTER 1
LITERATURE REVIEWS
1.1. Phenomenon and the radioactive decay law
1.1.1. The radioactive decay law
The radioactive atoms in a radioactive substance decay according to a
random process. The probability of a nucleus decaying in a time is independent of
time. It was noted three years after the discovery of radioactive that decay rate of a
pure radioactive substance decreases in time according to an exponential law which
is called the Radioactive decay law [6]. In fact, the radioactive decay law transfers
the nucleus unstable into another nucleus by emitting alpha, beta, gamma ray. If no
new nuclide are introduced into a given radioactive substance, this law predicts how
the number of radioactive nuclide which are present at time t decreases with time.
The number dN, decaying in a time interval dt is proportional to N, and so:
-dN Ndt
(1.1)
where λ is the decay constant which equals the probability per unit time for decay of
an atom. From equation (1.1), so:
N (t ) Ne-t
(1.2)
where N, represents the original number of nuclide present at t=0. The half-life is
the time requires for one-half of the original nuclide to decay, denoted by the
symbol T1/2. Putting N=No/2, it follows that:
T1/2
ln 2
0.693
ln 2
(1.3)
where the mean lifetime is the average time that a nucleus is likely to survive before
it decays and equals 1/λ, the reciprocal of the decay constant. The activity, A is the
rate at which decays occur in a sample and can be obtained by differentiating
equation (1.2). From (1.2) we have (1.4) equation:
A(t) = λN(t) = Ao e-λt
where Ao N0 is the initial activity at t=0, A is the activity at time t [6].
3
(1.4)
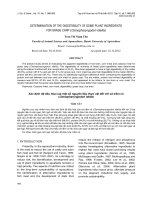
Fig.1.2 Schematic of the exponential decay of activity for 210Pb [6]
1.1.2. The radioactive decay chains
N1(t) is the number of nuclide of the original radioactivity (the mother) and
λ1 is its decay constant. N2(t) is the number of nuclide of the radioactive product
(the daughter) and λ2 is its decay constant. The radioactive decay chain was
described by two equation:
dN1 (t) = -λ1N1 (t)dt
(1.6)
dN2 (t) = λ1N1 (t) - λ2 N2 (t)dt
(1.7)
From two equation, we use differentiating equation to get:
(1.8)
dN1 (t )
1 N1 (t )
dt
dN 2 (t )
2 N 2 (t ) 1 N1 (t )
dt
(1.9)
The number of nuclide was called at t=0: N1(0)=N10 and N2(0)=N20. It
follows that:
N1 (t ) N10et
N 2 (t )
(1.10)
N101 1t 2t
(e e ) N 20e 2t
2 1
(1.11)
By integrating equation (1.10) and (1.11) and using the initial condition
N2(0)=0 the following results are obtained [1]:
4
N 2 (t )
N101 1t 2t
(e e )
2 1
(1.12)
1.2. Radioactive in nature
The Radioactive elements which can be found to occur in nature divided into
two main: Cosmogenic and Primordial Radioisotopes [6].
1.2.1. Primordial Radioisotopes
Terrestrial radionuclides are common in the rocks, soil, water and ocean and
also in building materials used for homes. These radionuclides at the creation of
planet. Since some of these radionuclides have long decay half-life, significant
quantities of these radionuclides are still present on the earth today. These
radionuclides can be categorized into two types: (1)Singly Occurring Radionuclides
and (2) Decay Chains [6].
1. Singly Occurring Radionuclides
About 20 naturally occurring single primordial radionuclides have been
identified. Most are radioactive isotopes with half-life are more 1010 and usually
around 1015 years [6].
Potassium is commonly distributed in the Earth’s crust. 40K has half-life of
1.277 109 yr. 40K decays through decay to stable 40Ca 80% of the time. The
remaining 10.72% of 40K undergoes decay by electron capute to stable 40Ar. This
latter decay branch also emits a characteristic gamma-ray at 1.461 MeV. The mean
activity concentration of 40K found in the crustal rock is about 0.62 Bq/g, Soil have
lower concentration of 40K activity, with the mean found to be around 440 Bq/kg.
The concentration of potassium in sea water is also significant, averaging about 11
Bq/l [6].
2. Decay Chain
There are three main decay series. These are the natural decay chains heads
by U (4,5 billion year half-life), 232Th (14,1 billion year half-life), and 235U (700
million year half-life) respectively. These each then decays through complex decay
chains of alpha and beta decays and end at the stable 208Pb, 207Pb, 206Pb nuclides
respectively [6].
238
5
238
U,
235
U and
232
Th are the parents of three natural decay series, called the
uranium series (238U), the actinium series (235U) and the thorium (232Th) series,
respectively. Natural uranium is a composite of the isotopes 238U (99,28%), 234U
(0,0057%) and 235U (0,72%). The decays chain of 238U includes 8 alpha decays and
6 beta decays respectively. The decays chain of 235U includes 7 alpha decays and 4
beta decays respectively. Natural thorium has only one primordial isotope that of
232
Th having a natural isotopic ratio of 100%. The decays chain of 232Th includes 6
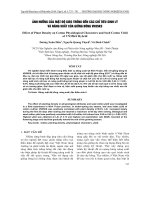
alpha decays and 4 beta decays respectively [7]. Besides, 238U, 235U, 232Th include
Radon (Rn) which is gas-radiation.
Fig.1.2 Radioactive decay chains of 232Th [18]
6
Fig.1.3 Radioactive decay chains of 238U [18]
Fig.1.4 Radioactive decay chains of 235U [18]
7
1.2.2. Cosmogenic radioisotopes
Cosmic radiation permeates all of space, the sources, the sources being
primarily outside of our solar system. The radiation is in many forms, from highspeed heavy particles to high energy photons and muons. The upper atmosphere
interacts with many of the cosmic radiation, and produces radioactive nuclides.
Here is a table with some common cosmogenic nuclides: [19]
Table 2.1 Some common cosmogenic nuclides [19]
Nuclide
Carbon 14
Hydrogen 3
Symbol
14
3
C
H
Souces
Half-life
Activity
5730 years
12.3 years
Cosmic-ray interactions
14
N(n,p)14C
0.22
(Bq/kg)
Cosmic-ray interactions
with N and O, spallation
from cosmic-rays,
1.2 10-3
6
Beryllium 7
7
Be
Natural
Li(n, )3H
Cosmic-ray
interaction with N and O
53.28 days
(Bq/kg)
0.01
(Bq/kg)
1.3. Artificial radioisotopes
The artificial radioactive isotopes were made from the activity of human
such as mining, weapon testing, nuclear accidents, the operation of nuclear power
plants… Table 1.2 presents a few human produced or enhance nuclides.
8
Table 1.2 Some Man-made radionuclides [19]
Nuclide
Symbol
Half-life
Source
Produced from weapons testing and
3
Tritium 3
H
12.3 years
fission reactor; reprocessing
facilities, nuclear weapons
manufacturing
Fission product produced from
weapons testing and fission
Iodine 131
131
Iodine 129
129
I
8.04 days
reactors, use in medical treatment
of thyroid problems
Fission product produces from
Cesium 137
137
I
Cs
7
1.57 10 years weapons testing and fission
reactors
30.17 years
Fission product produced from
weapons testing and fission
reactors
Strontium 90
90
Technetium 99
99
Plutonium 239
239
Sr
Tc
Pu
28.79 years
5
2.1 10 years
2.41 104 years
Fission product produced from
weapons testing and fission
reactors
Decay product of 99Mo, use in
medical diagnosis
Product by neutron bombardment
of 238U:
238
U +n 239U 239Np+
239
Pu +
1.4 Transfer of the radioactive isotopes from soil into plant
The main radioactive isotopes released into the environment by human
activities such as nuclear weapon testing or detonation; the nuclear fuel cycle,
including the mining and production of nuclear materials for use nuclear power
plants or nuclear bombs; accidental release of radioactive material from nuclear
9
power plants [8]. After radioactivity released into the environment, radioactive
nuclides formed clouds that moved across the global world and settled down as
radioactive fallout. Radioactive fallout contaminated the entire environment.
Besides, Radioactivity concentrated in water then transferred radioactive isotopes
into soil and plant system. These radioactive elements are concentrated mostly in
the surface layers of soil. The low mobility of radioactive elements in soil holds
them in the root zone. Plants assimilate the radioactive substances with others
necessary for their growth, then dangerous isotopes may get into animal tissues and
finally as food into organisms of human beings [9]. In here, This radioactive
contamination formed internal dose through ingestion or external exposure then it
pervaded into the human body, so it caused danger to human’s health.
This model is “ Major pathways of radionuclides to man in the event of an
uncontrolled release of radioactivity."
Fig.1.5 The pathway of radionuclides to man [10]
10
1.5 Characteristic of radioactive concentration in plant samples
1.5.1 The original of radionuclides in plant samples
Naturally radioactive isotopes exist widely spread in the earth’s environment
such as soil, water, air, or human body.Gamma radiations emitted from naturally
occurring radioactive materials such as uranium-238 (238U), thorium-232 (232Th)
and potassium-40 (40K) are generally known as terrestrial background radiation
[11]. Besides, Radioactive isotopes which produced as a result of the interaction of
cosmic rays with the Earth’s materials such as 14C called cosmogenic radioactive
isotopes. After production in the upper atmosphere, 14C combined with oxygen to
form carbon dioxide, CO2. Plants absorbed 14CO2 through photosynthesis [2].
Nowadays, Artificial radioactivity was formed by human-made from
medicine radiation (X-ray), accident nuclear reactor, mining, fuel enrichment… The
process of forming radioactive elements (natural or artificial) takes place in the
crust of the earth where the radioactive decay of the original radioactive nucleus
occurs in the soil or radioactive fallout into the air [3].
Since the growing of plant system related to environmental conditions (soil,
water, air), Plants contain an amount of radioactivity (natural radioactivity or
artificial radioactivity). Plants contacts directly with waste radioactivity in air.
Besides, it is absorbed radioactivity contamination from soils and water through
root system. Nowadays, In some places, soil was contaminated by artificial
radioactivity then vegetables were grown in this soil, so it became food chain of
human [3].
1.5.2 The radioactive isotope of plant samples
Vegetables and fruits have amount of radioactive element. Its concentration
depends on different factors such as radioactive soil system, water, air pollution, the
level of radioactive uptake of each species plants... The results of scientific research
use to analysis the component, concentration, the property of radioactive elements
in plant samples: fruit, vegetable, plants contain heavy metal or elements emit
gamma radiation [3,9]. The vegetable, fruits, pea, rice, the plant has grown up from
sugar, coffee, flour… in Earth’s surface, containing natural radioactivity, such as
232
Th, 238U, 210Pb, 226Ra, 228Ra. Eating vegetables can seriously damage health
because of the consumption amount of natural radioactive elements equal to halflife long 14,5µSv [3,14].
11
CHAPTER 2
MATERIALS AND EXPERIMENTAL METHODS
2.1 Collecting samples
2.1.1 Sampling stations
Samples were collected and set the characteristic symbol. It follows that by
table 2.1:
Table 2.1 Sampling stations
Symbol
Sample
Location of study
M1
Ordinary rice
An Phu- Hoa Phu- Ung Hoa- Ha Noi - VN
M2
Sticky rice
An Phu- Hoa Phu- Ung Hoa- Ha Noi -VN
K1
Potato
Co Phap- Cong Hoa- Nam Sach- Hai Duong - VN
K2
Potato
An Phu- Hoa Phu- Ung Hoa- Ha Noi - VN
M4
Corn
An Phu- Hoa Phu- Ung Hoa- Ha Noi - VN
M5
Bean
An Phu- Hoa Phu- Ung Hoa- Ha Noi - VN
G3
Sticky rice
Co Phap- Cong Hoa- Nam Sach- Hai Duong - VN
G2
Ordinary rice
Co Phap- Cong Hoa- Nam Sach- Hai Duong - VN
G1
Sticky rice
Huaphan - Laos
2.1.2 Preparation of samples
Samples were cleaned by water for removing sands and/ or soil, dried in air,
and weighed for determining the corresponding fresh mass in kilogram. After that,
they were oven-dried at approximately 105 C until a constant weight was reached.
The dried samples were then crushed. A portion of each dried sample was taken at
random, weighed, sealed, and kept in a cylindrical plastic container in high of 3cm,
the geometrical dimensions of the samples was kept identically [12]. The prepared
samples were stored for a period more than 30 days. The activity concentration of
each sample was measured using an HPGe Detector to analyze samples.
12
2.2 Equipment
-Low level gamma spectrometer (CANBERRA) using the ultrapure
semiconductor detector (HPGe) with the relative efficiencies of 15%, the energy
resolution of 1332 keV,the peak of 60Co of 1.66 keV connecting to the lead box for
reducing gamma radiation background and meeting environment standards to below
0.9 pulse/seconds in the energy region from 100 keV to 3000 KeV [4].
- FH40-F2 dose rate meter with the measurement range from 0.1 Sv/h to
0.99 mSv/h in the energy range from 45 keV to 1.3 MeV [4].
- An analytical balance is 0.1 mg accuracy [4].
- Drying oven.[4]
- Grinder is 0.1 µm accuracy
System Components
A typical analog HPGe detector includes high voltage power supply,
Preamplifier, Amplifier, Analogue to Digital Converter (ADC) and Multi-Channel
Analyzers (MCA).
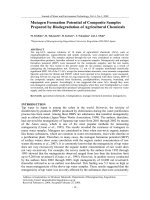
Fig.2.1 The diagram of gamma -ray spectrometry system [2]
1: HPGe Detector
5: Amplifier
2: High Voltage Power Supply
6: Multi-Channel Analyzers
3: Preamplifier
7: Computer
4: Pulse generator
13
2.3 Analytical Methods
2.3.1 Gamma spectrum analysis
The main purpose of the gamma spectrum analysis is to determine energy
and area of the peak of spectrometry as the basic for element identification and
determination of radioactivity. The gamma spectrum recorded consist of a number
of peak on a background. The best important peak is photoelectric peak. This peak
is the result of interaction of gamma radiation with the detector’s material through
photoelectric effect. The result of the interaction process is that the full energy of
gamma radiation is released in the volume of the detector.
In the gamma radiation, the peak position corresponding to the energy of
gamma ray and activity are determined by the area of the peak. With gamma ray
greater than 1022keV appear backscatter peaks about 200:300 keV, 511 keV peak,
(Eγ 511 keV) peak, (Eγ 1022 keV) peak. The large size detector sill appears
additional peak of the total of two gamma radiation cascade. This peak of energy
make gamma spectrometry become complex and some case can interfere with each
other.
The background in gamma spectrum of the contribution of the Compton
scattering takes place in the detector and in the natural radiation from the detector’s
material, the soil, all around the detector and from cosmic ray. In many cases, The
background has a great influence on gamma spectrum quality, so shielding is very
necessary. Normally people use lead as a shielding material to limit the natural
radiation background.
In the experiment, The energy of gamma radiation corresponding to
photoelectric peak is determined by energy calibration. Radioactivity is determined
based on the peak which subtracted background at full-absorption peak of the
characteristic radiation. The result of the measurement area of spectral peaks impact
on the result of determination the half-life of radioactive isotopes. To determine of
spectral peaks, there are is two methods: number method and joint method.
Nowadays, most of the amplitude analysis of spectrum are done with the
help of computer programs. This program was set based on private computer and it
can both record and dispose of spectroscopy. Spectrum analysis can be partially
automated once process after it had been performed such as setting parameters,
14
energy calibration, resolution, efficiency ... However, In many cases, it is necessary
to have direct interventions such as to detect spectral irregularities, to decide which
spectral region or spectral to be handled, for overlap that need special treatment.
From these reason that the spectrum analysis programs are separate steps with many
options for the flexible program, compatible with all the most of the request in
setting to record and analyze gamma spectrometry. The spectrum analysis is which
uses computer programs can identify and hand all most peak with good quality.The
collecting data provide complete information about gamma spectrum such as
position, energy, resolution, the background counts corresponding with error,
information about dead time, the parameter of energy calibration, efficiency
calibration… In automated gamma-ray processing programs that contain radioactive
isotopes, it is possible to directly identify and calculate the activity of radioactive
isotopes from gamma spectrum [2,3].
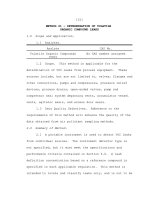
2.3.2 Determination of radioactivity:
In the case, daughter nuclide was made up of the excited state, it releases
energy in the form of characteristic radiation to return a lower excited state or basic
state.
The probability of nuclide at excited state has high energy Ei which transfer
gamma into low energy state Ej depends on the quantum state of the first and last
state.
The Count rate of characteristic gamma radiation of energy Eγ decay from
the sample in the unit time:
n I H
(2.1)
where: nγ is count rate of characteristic gamma ray
H is radioactivity of sample
Iγ is the intensity of energy Eγ
With certain gamma ray energy, Iγ known, when we determine the number
of gamma ray of energy Eγ which decays in the unit time, we will know the activity
of radioactivity H. We determine nγ based on the area at full-absorption peaks.
15
Count rate at full absorption peaks which subtracted background in the unit
time were calculated based on the following formula:
n n
(2.2)
where: n is count rate
Ԑ is absolute intensity record
From (2.1), (2.2) Activity was determined by (2.3) equation:
H0
n
I
(2.3)
where: Ho is radioactivity of sample
From (2.4), if we know the absolute efficiency and definite n0, we will
calculate radioactivity of sample. The intensity of full absorption peak was
determined based on efficiency calibration curve [1,3].
Activity concentration were calculated based on the following formula: [4]
H
n
I .M .
(2.4)
in which:
H is Activity concentration
M is mass of sample
Accuracy is determined by the following formula:
dH
dM 2 dC 2 dI 2 d 2
(
) ( ) ( ) ( )
H
M
C
I
(2.2)
- Minimum Detectable Activity (MDA)
To measure activity concentration of nuclides in samples, each sample was
counted for a time about 100000s for effective peak area statistics of above 0,1%.
Spectra were analyzed off-line using Gamma vision software, including peak search
nuclide identification activity and uncertain calculation and MDA of gamma ray
system at 95% confidence level calculation modules software [15]. This was as
followed:
16
MDA
4.66 B
I T M
(2.5)
where B is the background counts, 𝜀 is the absolute efficency of the detector,
is
the gamma emission probability, T is the counting time, M is the mass of the same
assuming an average of all samples equal to 0,1 kg [15].
- Using Gamma vision software is applied to analyze and determine the
activity of radioactive isotopes 226Ra, 232Th, 40K. 226Ra isotopes and identify through
295.2 keV gamma ray (19.2%) and 351.9 keV (36.7%) of
(46.1%) of
214
Bi. The 186 keV ray of isotopes
226
214
Pb and 609.3 keV
Ra was not used because there has
235
an overlapping with 185.75 keV ray of isotopes U. Calculating isotopes 232Th is
based on 238.6 keV ray (43.6%) of 212Pb and 338,3 (11,3%) ray of 228Ac and
583,19 (30,44%) of
ray (10.7%) [4].
208
Tl.
40
K isotopes have been identified by 1461 keV gamma
17
CHAPTER 3
RESULTS AND DISCUSSION
3.1 Establishment of energy calibration and efficiency calibration curve
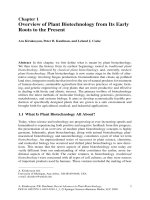
3.1.1 Establishment of energy calibration
To establish of energy calibration, Standard source 226Ra is used for low
energy by Gamma vision software at Center for Technology Environment
Treatment. Table 3.1 shows the energy depends on channel.
Table 3.1 The energy-channel dependence
Isotopes
Energy (keV)
Channel
214
Pb
295.22
450
214
Pb
351.93
560
214
Bi
609.31
1056
214
Bi
768.356
1362
214
Bi
934.061
1683
214
Bi
1120.29
2042
214
Bi
1764.49
3284
1400
y = 0.5184x + 61.879
R² = 1
1200
Energy (keV)
1000
800
600
400
200
0
0
500
1000
1500
2000
Channel
Fig 3.1 Graph of the energy-channel dependence
18
2500
3.1.2. Establishment of efficiency calibration curve
The gamma spectra measured and analyzed by using the Gamma Vision
program.The standard samples were established from IAEA-156 of 57.32g IAEA
156 and 8.84 g by IAEA sources which called TN1 sample. The TN1 spectroscopy
was measured in the counting time 197058 s to make sure that the statistical error at
full-absorption peak is less 2%.
The spectrum of TN1 sample was measured in counting time 197058s was
described by Fig 3.2
Fig 3.2 The TN1 spectroscopy was measured in counting time t=197058s
Using Gamma Vision analyzes the spectrum of sample analysis and
background then determine the net count at analytical peak. The results were
calculated in Table 3.4 then determined absolute efficiency at full-absorption peak.
19