cf phuong
Bạn đang xem bản rút gọn của tài liệu. Xem và tải ngay bản đầy đủ của tài liệu tại đây (49.19 KB, 3 trang )
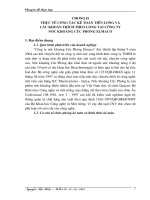
Evaluation of the Sources and Uses of Cash
Triệu đồng
Net income
Net cash inflows(outflows)
from operating activities
Net cash flow from investing
activities
Net cash inflows/(outflows)
from financing activities
2010
149,04
2011
111,87
2012
84,93
2013
87,55
2014
95,56
2015
120,95
-83,65
67,05
259,69
159,15
41,35
146,73
14,41
-147
-79,65
-179,45
24,51
-63,62
211,26
65,87
-147,83
136,55
-65,14
-152,09
The primary source of cash for the company was operating activities. Most of this cash
flow spent in investing and financing activities. Operating cash flow was higher than
capital expenditure, indicating that Pinaco could easily fund capital expenditures from
operating.
The company had generated investing cash flow by interest, dividends, share profit.
In the financing category, company spent cash by short term borrowing.
Positive operating activities, negative investment and financing activities: mature, and
stable business. Cash flow from healthy business, earning more than the investment
needs. Surplus from operating segment was used to pay for undertaken investments or
pay to owners and creditors.
From 2012 to 2015, Pinaco was a mature company, it is desirable that operating cash
flow exceeded net income.
Common – size Analysis (Vertical)
Cash flow statement
I. Cash flow from operating activities
1. Net income
2. Adjustments:
- Depreciation and Amortization
- Provisions
- Unrealized foreign exchange (gain)/loss
- (Profit)/loss from investing activities
- Interest expenses
3. Operating profit/(loss) before changes in
WC
- (Increase)/decrease in receivables
2011
2012
2013
2014
2015
%
%
%
%
%
8.95
5.65
4.54
4.66
4.72
5.71
0.00
0.00
0.00
0.00
0.00
0.00
1.41
1.78
2.81
3.09
3.19
3.12
0.10
0.25
-0.18
0.33
-0.22
0.60
-0.53
0.01
-0.07
-0.09
0.07
-0.04
-1.31
-0.61
-0.32
-0.74
-0.91
-0.72
1.03
1.39
1.18
0.80
0.92
0.45
9.65
8.48
7.96
8.04
7.77
9.11
1.05
-3.18
-0.80
2.46
3.01
-1.60
2010
%
- (increase)/decrease in inventories
- Increase/(decrease) in payables
- Interest paid
- (Increase)/decrease in other short term
assets
- Business Income Tax paid
- Other Incomes/Losses
Net cash inflows(outflows) from operating
activities
II. Cash flow from investing activities
1. Capital Expenditure (CAPEX)
2. Proceeds from disposal of fixed assets
3. Change in Short term and Long term
Financial Investment
4. Interest, dividends, shared profit from
investments
5. Change in other Long term assets
Net cash flow from investing activities
III. Cash flow from financing activities
1. Proceeds from shares issue
2. Payments for share repurchases
4. Increase/decrease short term borrowings
5. Increase/decrease long term borrowings
6. Dividends paids
Net cash inflows/(outflows) from financing
activities
Net Increase/Decrease in cash and cash
equivalents
Cash and cash equivalents at the beginning of
period
Effect of exchange rate
Cash and cash equivalents at the ending of
period
19.59
-2.16
6.58
-4.23
2.39
-0.04
6.79
2.58
2.62
6.70
-8.50
3.46
-2.11
5.73
16.37
12.98
4.67
9.27
-0.98
-1.37
-1.22
-0.79
-0.94
-0.45
0.10
-0.1
0.02
-0.22
0.14
-1.66
-1.53
-0.70
-0.94
-3.18
-1.34
-1.65
-0.50
-0.14
-0.34
-0.32
-0.50
-0.23
-5.02
3.39
13.89
8.47
2.04
6.93
0.00
0.00
0.00
0.00
0.00
0.00
-9.98
-8.18
-2.02
-3.07
-1.25
-0.95
0.00
0.01
0.00
0.00
0.00
0.02
9.70
0.00
-2.41
-6.99
1.45
0.00
1.14
0.73
0.17
0.51
1.00
0.52
0.00
0.00
0.00
0.00
0.00
-2.60
0.86
-7.43
-4.26
-9.55
1.21
-3.01
0.00
0.00
0.00
0.00
0.00
0.00
0.00
0.00
0.00
0.13
0.00
0.00
0.00
0.00
0.00
0.00
0.00
0.00
14.02
-1.01
-3.65
9.98
0.33
84.49
1.27
-1.80
-0.53
0.00
0.00
-87.61
-2.61
-0.51
-3.73
-2.83
-3.55
-4.06
12.68
-3.33
-7.91
7.27
-3.21
-7.18
8.53
7.37
1.72
6.19
0.04
-3.26
3.34
9.97
2.75
4.47
9.87
9.48
-0.02
0.00
0.01
-0.01
0.00
0.05
11.84
2.60
4.49
10.64
9.90
6.27
In recent years, operating activity was the main cash flows of the company and
increased from -5.02% to 6.93% in 2015. Net income and operating profit before
change in working capital accounted large proportion.
Pinaco’s level of capital expenditure was relatively small, less than 1 percent of
revenues in most years, but this increased in the most recent years.
Comparing with other company
PAC
Net cash inflows (outflows) from operating activities
Net cash flow from investing activities
Net cash inflows (outflows) from financing activities
1.21
TBS
-8.82
15.20
-3.21
-6.42
2.04
In contact, TBS tried to cover negative net cash flow from operating activity and pay
its financial liabilities. Cash comes from selling of long-term assets and financial
investments. Such case could indicate serious financial troubles, because of shortage of
cash flow from core business. The liabilities are paid thanks to selling off assets.
Generally, Pinaco’s business is stable.
Cash flow analysis ratio
FCFF = NI + NCC + Int(1-Tax rate) – FCInv – WCInv
Where
NI: Net income
NCC: Noncash charge (such as depreciation and amortization)
Int: Interest expense
FCInv: Capital expenditure (fixed capital, such as equipment)
WCInv: Working capital expenditures
Cash flow to revenue = CFO : Net revenue
Cash flow analysis
CFO/ Short term borrowings
FCFF/ Short term borrowings
FCFF/ Debt
CFO/ Revenue
2010
2011
2012
2013
-23.94%
-67.69%
-37.98%
-5.02%
18.52%
0.07%
0.04%
3.39%
88.72%
-0.45%
-0.21%
13.89%
33.17%
-0.35%
-0.18%
8.47%
2014
2015
8.48%
0.29%
0.19%
2.04%
34.82%
-0.18%
-0.10%
6.93%