Hiệu quả Thiết bị Tổng thể (OEE).
Bạn đang xem bản rút gọn của tài liệu. Xem và tải ngay bản đầy đủ của tài liệu tại đây (314.4 KB, 27 trang )
Sự bất ổn thương mại toàn cầu và cạnh tranh khốc liệt hiện tại,
hơn bao giờ hết, nhà sản xuất thực phẩm cần tối đa hóa hiệu quả
quy trình và rà soát kỹ chi phí sản xuất. Nó sẽ giúp cân nhắc các
phương pháp đã chứng minh để chạy dây chuyền của bạn với hiệu
suất tối đa và một mô hình được sử dụng rộng rãi là Hiệu quả
Thiết bị Tổng thể (OEE).
Trong tài liệu này, chúng tôi sử dụng Mô hình OEE để xác định các
thách thức năng suất cụ thể và thảo luận cách cải tiến mới trong việc
kiểm tra sản phẩm đã cung cấp cho nhà sản xuất một lợi thế cạnh
tranh.
Các tính toán OEE bắt đầu khi sản phẩm nhập vào cửa sổ vận hành
theo kế hoạch nhưng năng suất bắt đầu bằng cách mở rộng cửa sổ.
Trước khi xem các hướng cụ thể để cải thiện Tính sẵn có, Hiệu
suất và Chất lượng bạn cần trước tiên tập trung tăng tổng công suất
sản xuất.
6 thách thức chính được thảo luận trong tài liệu này là:
1. Tăng thời gian sản xuất khả dụng
2. Giảm thời gian nghỉ không mong muốn (Tính sẵn có)
3. Đảm bảo việc sản xuất vận hành ở tốc độ tối ưu (Hiệu suất)
4. Ngăn chặn các khoảng dừng nhỏ (Hiệu xuất)
5. Giảm lãng phí sản phẩm bằng cách phát hiện các vấn đề sớm
hơn (Chất lượng)
6. Giảm loại bỏ sai (Chất lượng)
1) Tăng thời gian sản xuất khả dụng
Mặc dù thời gian nghỉ được lên kế hoạch không là phần cụ thể
trong Tính toán OEE nhưng nó có thể tác động lớn đến năng suất tổng
thể. Tác vụ như rửa sạch thiết bị, các chương trình bảo trì, chuyển đổi
dây chuyền và xác thực kiểm tra tất cả sản xuất giữ ở điểm dừng.
Kỹ thuật kiểm tra thế hệ kế tiếp mục đích để giải quyết các thách thức
này theo nhiều cách khác nhau. Ví dụ như thiết kế hợp vệ sinh được
cải thiện của Hệ thống tia X X37 mới đã đạt được thông qua cải tiến
kỹ thuật và kỹ thuật sản xuất tiên tiến. Bằng cách phát triển công
nghệ tia X có thể cung cấp hiệu suất cao nhất ở 20W cao hơn chuẩn
100W, việc làm mát không còn cần thiết . Cũng như làm giảm nhu
cầu bảo trì, nghĩa là việc thông gió không cần thiết, giúp vệ sinh
nhanh và đơn giản hơn.
Bảo dưỡng thiết bị là một đóng góp lớn khác cho thời gian chờ. Có
thiết bị kiểm tra ổn định và đáng tin cậy nhất là cần thiết nhưng tích
hợp phần mềm kiểm tra sức khỏe giúp việc bảo trì có thể thực hiện
trong khoảng thời gian hiệu quả hơn.
Phần mềm Giám sát Tình trạng bao gồm máy dò kim loại Profile
Advantage mới là một ví dụ về cách thiết kế thông minh có thể cung
cấp cho bạn yên tâm và tiết kiệm thời gian. Màn hình phần mềm thay
đổi trong các thông số máy dò và đưa các cảnh báo nâng cao nếu xu
hướng bất lợi được xác định, nhưng trước khi việc dừng dây chuyền
xảy ra. Cảnh báo bảo trì sớm nghĩa là việc bảo trì cần thiết có thể
được lên kế hoạch khi máy dò ngoại tuyến hơn là dừng quy trình sản
xuất.
Một đóng góp quan trọng khác với thời gian nghỉ theo kế hoạch là
chuyển đổi sản phẩm. Mặc dù yếu tố này thể hiện nhiều thách thức
khác nhau, từ góc kiểm tra một vấn đề chính là nhận dạng sản phẩm.
Máy dò kim loại Profile Advantage thực hiện phân nhóm trực quan,
cho phép thay đổi sản phẩm liên tục mà không cần điều chỉnh thiết lập
và quan trọng nhất là không mất hiệu suất phát hiện.
Thiết bị kiểm tra sản phẩm đúng có thể tăng thời gian sản xuất tổng
thể bằng nhiều cách và tác động tích lũy của những lợi ích gia tăng sẽ
khá lớn trong sản xuất và lợi nhuận của bạn.
2) Giảm thời gian nghỉ không mong muốn – Tính sẵn có
Hỏng hóc có thể gây ra các vấn đề lớn. Một dây chuyền sản xuất chỉ
tốt như liên kết yếu nhất của nó, đó là lý do có thiết bị mạnh mẽ và
đáng tin cậy nhất là rất quan trọng. Quan trọng không kém là có dịch
vụ phù hợp và các kế hoạch bảo trì dự phòngtại chỗ để đảm bảo thiết
bị vận hành tối đa.
Các hệ thống cảnh báo tiên tiến, như Giám sát Tình huống, cho phép
bạn lên kế hoặch bảo trì cho thiết bị khi ngoại tuyến. Tuy nhiên, các
tính năng khác làm giảm thời gian nghỉ và lãng phí bằng cách cảnh
bảo các lỗi nghiêm trọng hơn trong dây chuyền.
Phát hiện Lỗi Kế tiếp cảnh báo vận hành viên hoặc thậm chí kích hoạt
tắt băng tải nếu có quá nhiều sản phẩm không phù hợp. Bằng cách lập
trình một ngưỡng giữa 2 và 99 các sản phẩm lỗi liên tiếp, Cân kiểm tra
C3000 mới của METTLER TOLEDO Garvens cho phép bạn kiểm
soát các vấn đề trước khi chúng trở nên nghiêm trọng và tốn kém hơn.
3) Đảm bảo việc sản xuất vận hành ở tốc độ tối ưu - Hiệu suất
Một thách thức lớn trong kiểm tra sản phẩm là các cân kiểm tra trong
dây chuyền sử dụng các cảm biến tải cơ khí. Khoảng cách sản phẩm
trở nên rất quan trọng vì các cảm biến phải trở về 0 giữa các lượt đo
và chỉ một sản phẩm được cân tại một thời điểm. Thông thường kết
quả là sự dung hòa giữ tốc độ và chính xác khi lý tưởng là bạn sẽ có
cả hai tốt nhất.
Câm kiểm tra C3000 mới được xem là có thiết kế cơ học hoàn chỉnh
cho phép thực hiện cân chính xác nhanh hơn trước đây lên đến 33%.
Các bước nhảy vọt lớn trong hiệu xuất giúp C3000 có thể dễ dàng phù
hợp với công suất của dây chuyền tốc độ cao.
4) Ngăn chặn các khoảng dừng nhỏ - Hiệu suất
Thiết bị kiểm tra sản phẩm cho biết nhiều điều hơn là chỉ nói về
những thứ tốt hoặc xấu. Ví dụ như việc tạm ngừng dây chuyền do
điều chỉnh bộ lọc có thể tránh được bằng cách tích hợp Cân kiểm tra
C3000 với kiểm soát mức làm đầy tự động. Phản hồi theo chu kỳ từ
Cân kiểm tra tới bộ làm đầy có thể tự động kiểm tra và điều chỉnh
mức làm đầy, tiết kiệm thời gian và đảm bảo bạn đáp ứng các quy
định về làm đầy mà không lãng phí tiền bạc do bỏ đi sản phẩn.
5) Giảm lãng phí sản phẩm bằng cách phát hiện vấn đề sớm hơn
– Chất lượng
Việc bố trí thiết bị kiểm tra là quan trọng để phát hiện các vấn đề sớm
nhất có thể trong quy trình sản xuất và trước khi giá trị có ý nghĩa
được thêm vào sản phẩm. Kiểm toán HACCP sẽ xác định các điểm
kiểm soát chính cần thiết (CCP's) và thiết lập thiết bị kiểm tra tại các
điểm này sẽ giảm nhẹ nguy cơ sản phẩm bị ô nhiễm đến tay người tiêu
dùng. Bằng việc xác định các sản phẩm không tuân thủ sớm, bạn có
thể giảm thiểu lãng phí bằng cách thực hiện các hành động chính xác
sớm hơn.
Ví dụ như mảnh vỡ của dây lưới lọc kim loại hoặc mãnh dao rất khó
để phát hiện, đặc biệt là trong các ứng dụng mang tính thách thức.
Không giải quyết vấn đề mới ngay lập tức, bạn có nguy cơ lãng phí
cao hơn cũng như các chất ô nhiễm vỡ ra nhỏ hơn và khó khăn để phát
hiện các hạt hơn, khi đó bạn sẽ không có lựa chọn nào khác ngoài loại
bỏ tất cả sản phẩm trước đó. Độ nhạy tuyệt vời của công nghệ kiểm
tra sản phẩm thế hệ tiếp theo sẽ cho bạn tự tin loại bỏ chi phí lãng
phí.
Tuy nhiên việc kiểm tra sản phẩm không chỉ là tìm kiếm chất ô
nhiễm. Trong khi kiểm tra thủy tinh, kim loại, đá khoáng, nhựa mật
độ cao, xương hoặc cao su, Tia X Seri X37 của METTLER TOLEDO
Safeline có thể đồng thời chạy kiểm tra tính toàn vẹn của sản phẩm
như giám sát mức làm đầy, kiểm tra tính toàn vẹn của con dấu, phát
hiện chữ cái in hoa thiếu và thậm chí phát hiện sản phẩm hoặc đóng
gói bị hư hỏng .
Có khả năng giám sát và phát hiện sớm nhiều vấn đề ô nhiễm và tính
toàn vẹn trong quy trình cho bạn mức kiểm soát cao hơn đối với các
vấn đề hầu như thường xảy ra trong sản xuất.
6) Giảm loại bỏ sai - Chất lượng
Thiết bị kiểm tra sản phẩm ảnh hưởng trực tiếp đến mức loại bỏ sai có
thể hơn bất lỳ yếu tố nào khác trong Tính toán OEE. Công nghệ thế
hệ tiếp theo đã đưa ra cái nhìn rất nghiêm trọng trong việc giải quyết
nguyên nhân của vấn đề và không nhiều hơn so với Profile Advantage.
Hàm lượng độ ẩm trong thực phẩm có thể gây ra vấn đề được biết
như ảnh hưởng sản phẩm', một dấu hiện có thể được giải thích như là
sự nhiễm tạp chất từ máy dò kim loại. Kết quả điển hình là độ nhạy
phát hiện kém hoặc mức loại bỏ sai không thể chấp nhận được.
Mặc dù vấn đề phổ biến đối với hầu hết các máy dò kim loại chuẩn
công nghiệp, Máy dò kim loại Đa tần số (MSF), chẳng hạn như Profile
Advantag nhạy hơn 50%. Bước tiến rất lớn trong hiệu suất nghĩa là độ
ẩm không còn là vấn đề, do đó, mức độ loại bỏ sai được cải thiện cùng
với Hiệu quả thiết bị tổng thể (OEE).
Lướt qua Bề mặt những gì có thể
Lợi ích của việc chọn đúng thiết bị kiểm tra sản phẩm và tác động của
những quyết định này sẽ thể hiện trong năng suất và OEE nhiều hơn
những gì tài liệu này có thể bao gồm. Vì lý do đó, chúng tôi đã cũng
cấp các liên kết đến trang trắng và các nguồn hữu ích khác thông qua
trang này. Nếu bạn muốn nói chuyện với chuyên gia kiểm tra sản
phẩm tại địa phương và muốn thảo luận về các yêu cầu cụ thể, vui
long liên hệ với chúng tôi.
Overall equipment effectiveness
From Wikipedia, the free encyclopedia
[hide]This article has multiple issues. Please help improve
on the talk page. (Learn how and when to remove these tem
This article needs additional citations for verification. (M
This article includes a list of references, but its sources rem
Overall equipment effectiveness (OEE) is a term coined by Seiichi
Nakajima[1] in the 1960s to evaluate how effectively
a manufacturing operation is utilized. It is based on theHarrington
Emerson way of thinking regarding labor efficiency.[citation needed] The
results are stated in a generic form which allows comparison between
manufacturing units in differing industries. It is not however an
absolute measure and is best used to identify scope for process
performance improvement, and how to get the improvement.[2] If for
example the cycle time is reduced, the OEE will increase i.e. more
product is produced for less resource. Another example is if one
enterprise serves a high volume, low variety market, and another
enterprise serves a low volume, high variety market.
More changeovers (set-ups) will lower the OEE in comparison, but if
the product is sold at a premium, there could be more margin with a
lower OEE.
OEE measurement is also commonly used as a key performance
indicator (KPI) in conjunction with lean manufacturing efforts to
provide an indicator of success. OEE can be illustrated by a brief
discussion of the six metrics that comprise the system. The hierarchy
consists of two top-level measures and four underlying measures.
Contents
[hide]
•
1Top-level metrics
•
2Underlying metrics
•
3Calculations for OEE and TEEP
o
3.1Overall equipment effectiveness
o
3.2Total effective equipment performance
o
3.3Loading
o
3.4Availability
o
3.5Performance and productivity
o
3.6Quality
•
4"Six Big Losses"
•
5Heuristic
•
6Further reading
•
7See also
•
8References
•
Top-level metrics[edit]
Overall equipment effectiveness (OEE) and total effective equipment
performance (TEEP) are two closely related metrics that report the
overall utilization of facilities, time and material for manufacturing
operations. These top view metrics directly indicate the gap between
actual and ideal performance.
•
Overall equipment effectiveness quantifies how well a
manufacturing unit performs relative to its designed capacity,
during the periods when it is scheduled to run.
•
Total effective equipment performance (TEEP) measures OEE
against calendar hours, i.e.: 24 hours per day, 365 days per year.
Underlying metrics[edit]
In addition to the above measures, there are four underlying metrics
that provide understanding as to why and where the OEE and TEEP
gaps exist.
The measurements are described below
•
Loading: The portion of the TEEP Metric that represents the
percentage of total calendar time that is actually scheduled for
operation.
•
Availability: The portion of the OEE Metric that represents the
percentage of scheduled time that the operation is available to
operate. Often referred to as Uptime.
•
Performance: The portion of the OEE Metric that represents the
speed at which the Work Center runs as a percentage of its
designed speed.
•
Quality: The portion of the OEE Metric that represents the
Good Units produced as a percentage of the Total Units Started. It
is commonly referred to as the first pass yield(FPY).
Calculations for OEE and TEEP[edit]
What follows is a detailed presentation of each of the six OEE / TEEP
Metrics and examples of how to perform calculations. The
calculations are not particularly complicated, but care must be taken
as to standards that are used as the basis. Additionally, these
calculations are valid at the work center or part number level but
become more complicated if rolling up to aggregate levels.[3]
Overall equipment effectiveness[edit]
OEE breaks the performance of a manufacturing unit into three
separate but measurable components: Availability, Performance,
and Quality. Each component points to an aspect of the process that
can be targeted for improvement. OEE may be applied to any
individual Work Center, or rolled up to Department or Plant levels.
This tool also allows for drilling down for very specific analysis, such
as a particular Part Number, Shift, or any of several other parameters.
It is unlikely that any manufacturing process can run at 100% OEE.
Many manufacturers benchmark their industry to set a challenging
target; 85% is not uncommon.
•
OEE is calculated with the formula
(Availability)*(Performance)*(Quality)
•
Using the examples given below:
•
(Availability= 86.6%)*(Performance=93%)*(Quality=91.3%)=
(OEE=73.6%)
Alternatively, and often easier, OEE is calculated by dividing the
minimum time needed to produce the parts under optimal conditions
by the actual time needed to produce the parts. For example:
•
Total Time: 8 hour shift or 28,800 seconds, producing 14,400
parts, or one part every 2 seconds.
•
Fastest possible cycle time is 1.5 seconds, hence only 21,600
seconds would have been needed to produce the 14,400 parts. The
remaining 7,200 seconds or 2 hours were lost.
•
The OEE is now the 21,600 seconds divided by 28,800 seconds
(same as minimal 1.5 seconds per part divided by 2 actual seconds
per part), or 75%.
Total effective equipment performance[edit]
Where OEE measures effectiveness based on scheduled hours, TEEP
measures effectiveness against calendar hours, i.e.: 24 hours per day,
365 days per year.
TEEP, therefore, reports the 'bottom line' utilization of assets.
TEEP = Loading * OEE[3]
Loading[edit]
The Loading portion of the TEEP Metric represents the percentage of
time that an operation is scheduled to operate compared to the total
Calendar Time that is available. The Loading Metric is a pure
measurement of Schedule Effectiveness and is designed to exclude the
effects how well that operation may perform.
Calculation: Loading = Scheduled Time / Calendar Time
Example:
A given Work Center is scheduled to run 5 Days per Week, 24 Hours
per Day.
For a given week, the Total Calendar Time is 7 Days at 24 Hours.
Loading = (5 days x 24 hours) / (7 days x 24 hours) = 71.4%
Availability[edit]
The Availability portion of the OEE Metric represents the percentage
of scheduled time that the operation is available to operate. The
Availability Metric is a pure measurement of Uptime that is designed
to exclude the effects of Quality, Performance, and Scheduled
Downtime Events. The losses due to wasted availability are
called availability losses.[4]
Example: A given Work Center is scheduled to run for an 8-hour (480
minute) shift with a 30-minute scheduled break and experiences 60
minutes of unplanned (breakdown) time. In this case, the 30 minute
break should be considered "scheduled time" although it is planned
downtime.
Operating Time = 480 Minutes Scheduled – 30 Minutes Scheduled
Downtime – 60 Minutes Unscheduled Downtime = 390 Minutes
Calculation: Availability = operating time / scheduled time[5]
Availability = 390 minutes / 480 minutes = 81.25%
Performance and productivity[edit]
Also known as "process rate", the Performance portion of the OEE
Metric represents the speed at which the Work Center runs as a
percentage of its designed speed. The Performance Metric is a pure
measurement of speed that is designed to exclude the effects of
Quality and Availability. The losses due to wasted performance are
also often called speed losses. In practice it is often difficult to
determine speed losses, and a common approach is to merely assign
the remaining unknown losses as speed losses.
Calculation: Performance (Productivity) = (Parts Produced *
Ideal Cycle Time) / Operating time [6]
Example:
A given Work Center is scheduled to run for an 8-hour (480 minute)
shift with a 30-minute scheduled break.
Operating Time = 450 Min Scheduled – 60 Min Unscheduled
Downtime = 390 Minutes
The Standard Rate for the part being produced is 40 Units/Hour or 1.5
Minutes/Unit
The Work Center produces 242 Total Units during the shift. Note: The
basis is Total Units, not Good Units. The Performance metric does not
penalize for Quality.
Time to Produce Parts = 242 Units * 1.5 Minutes/Unit = 363 Minutes
Performance (Productivity) = 363 Minutes / 390 Minutes = 93.0%
Quality[edit]
The Quality portion of the OEE Metric represents the Good Units
produced as a percentage of the Total Units Started. The Quality
Metric is a pure measurement of Process Yield that is designed to
exclude the effects of Availability and Performance. The losses due to
defects and rework are called quality losses.
Calculation: Quality = (Units produced - defective units) / (Units
produced)[5]
Example:
242 Units are produced. 21 are defective.
(242 units produced - 21 defective units) = 221 units
221 good units / 242 total units produced = 91.32%
"Six Big Losses"[edit]
Example of OEE and Six Loss calculation
To be able to better determine what is contributing to the greatest loss
and so what areas should be targeted to improve the performance,
these categories (Availability, Performance and Quality) have been
subdivided further into what is known as the ‘Six Big Losses’ to OEE.
These are categorized as follows:
Planned Downtime
Breakdowns
The reason for identifying the losses in these categories is so that
specific countermeasures can be applied to reduce the loss and
improve the overall OEE.
Heuristic[edit]
OEE is useful as a heuristic, but can break down in several
circumstances. For example, it may be far more costly to run a facility
at certain times. Performance and quality may not be independent of
each other or of availability and loading. Experience may develop
over time. Since the performance of shop floor managers is at least
sometimes compared to the OEE, these numbers are often not reliable,
and there are numerous ways to fudge these numbers.[7]
OEE has properties of a geometric mean. As such it
punishes variability among its subcomponents. For example, 20% *
80% = 16%, whereas 50% * 50% = 25%. When there are asymmetric
costs associated with one or more of the components, then the model
may become less appropriate.
Consider a system where the cost of error is exceptionally high. In
such a condition, higher quality may be far more important in a proper
evaluation of effectiveness than performance or availability. OEE also
to some extent assumes a closed system and a potentially static one. If
one can bring in additional resources (or lease out unused resources to
other projects or business units) then it may be more appropriate for
example to use an expected net present value analysis.
Variability in flow can also introduce important costs and risks that
may merit further modeling. Sensitivity analysis and measures of
change may be helpful.
Further reading[edit]
•
Hansen, Robert C (2005). Overall Equipment Effectiveness
(OEE). Industrial Press. ISBN 978-0-8311-3237-8.
•
Koch, Arno (2007). OEE for the Production Team.
Makigami. ISBN 978-90-78210-08-5. (English). ISBN 978-9078210-07-8 (Dutch)., ISBN 978-3-940775-04-7 (German).
•
Productivity Press Development Team (1999), OEE for
Operators: Overall Equipment Effectiveness, Productivity
Press, ISBN 978-1-56327-221-9
See also[edit]
•
Total productive maintenance
SIMPLE CALCULATION
The simplest way to calculate OEE is as the ratio of Fully Productive
Time to Planned Production Time. Fully Productive Time is just
another way of saying manufacturing onlyGood Parts as fast as
possible (Ideal Cycle Time) with no Stop Time. Hence the calculation
is:
OEE = (Good Count × Ideal Cycle Time) / Planned
Production Time
Although this is an entirely valid calculation of OEE, it does not
provide information about the three loss-related
factors: Availability, Performance, and Quality. For that – we use the
preferred calculation.
From our sponsor…
PREFERRED CALCULATION
The preferred OEE calculation is based on the three OEE
Factors: Availability, Performance, and Quality.
OEE is calculated by multiplying the three OEE factors: Availability,
Performance, and Quality.
Availability
Availability takes into account all events that stop planned production
long enough where it makes sense to track a reason for being down
(typically several minutes).
Availability is calculated as the ratio of Run Time to Planned
Production Time:
Availability = Run Time / Planned Production Time
Run Time is simply Planned Production Time less Stop Time, where
Stop Time is defined as all time where the manufacturing process
was intended to be running but was not due to Unplanned
Stops (e.g., Breakdowns) or Planned Stops (e.g., Changeovers).
Run Time = Planned Production Time − Stop Time
Performance
Performance takes into account anything that causes the
manufacturing process to run at less than the maximum possible
speed when it is running (including both Slow Cycles and Small
Stops).
Performance is the ratio of Net Run Time to Run Time. It is
calculated as:
Performance = (Ideal Cycle Time × Total Count) / Run Time
Ideal Cycle Time is the fastest cycle time that your process can
achieve in optimal circumstances. Therefore, when it is multiplied
by Total Count the result is Net Run Time (the fastest possible time
to manufacture the parts).
Since rate is the reciprocal of time, Performance can also be
calculated as:
Performance = (Total Count / Run Time) / Ideal Run Rate
Performance should never be greater than 100%. If it is, that usually
indicates that Ideal Cycle Time is set incorrectly (it is too high).
Quality
Quality takes into account manufactured parts that do not meet
quality standards, including parts that need rework. Remember, OEE
Quality is similar to First Pass Yield, in that it defines Good Parts as
parts that successfully pass through the manufacturing process the
first time without needing any rework.
Quality is calculated as:
Quality = Good Count / Total Count
This is the same as taking the ratio of Fully Productive Time (only
Good Parts manufactured as fast as possible with no Stop Time)
to Net Run Time (all parts manufactured as fast as possible with no
stop time).
OEE
OEE takes into account all losses, resulting in a measure of truly
productive manufacturing time. It is calculated as:
OEE = Availability × Performance × Quality
If the equations for Availability, Performance, and Quality are
substituted in the above and reduced to their simplest terms the result
is:
OEE = (Good Count × Ideal Cycle Time) / Planned
Production Time
This is the “simplest” OEE calculation described earlier. And, as
described earlier, multiplying Good Count by Ideal Cycle
Time results in Fully Productive Time (manufacturing only Good
Parts, as fast as possible, with no Stop Time).
Why the Preferred OEE Calculation?
OEE scores provide a very valuable insight – an accurate picture of
how effectively your manufacturing process is running. And, it
makes it easy to track improvements in that process over time.
What your OEE score doesn’t provide is any insights as to the
underlying causes of lost productivity. This is the role
of Availability,Performance, and Quality.
In the preferred calculation you get the best of both worlds. A single
number that captures how well you are doing (OEE) and three
numbers that capture the fundamental nature of your losses
(Availability, Performance, and Quality).
Here is an interesting example. Look at the following OEE data for
two sequential weeks.
OEE Factor
OEE
Availability
Performance
Quality
OEE is improving. Great job! Or is it? Dig a little deeper and the
picture is less clear. Most companies would not want to increase
Availability by 5.0% at the expense of decreasing Quality by 4.5%.
CALCULATION EXAMPLE
Now let’s work through a complete example using the
preferred OEE calculation. Here is data recorded for the first shift:
Item
Shift Length
Breaks
Down Time
Ideal Cycle Time
Total Count
Reject Count
Planned Production Time
As described in the OEE Factors page, the OEE calculation begins
with Planned Production Time. So first, exclude any Shift
Time where there is no intention of running production
(typically Breaks).
Formula: Shift Length − Breaks
Example: 480 minutes − 60 minutes = 420 minutes
Run Time
The next step is to calculate the amount of time that production was
actually running (was not stopped). Remember that Stop Time should
include both Unplanned Stops (e.g., Breakdowns) or Planned
Stops (e.g., Changeovers). Both provide opportunities for
improvement.
Formula: Planned Production Time − Stop Time
Example: 420 minutes − 47 minutes = 373 minutes
Good Count
If you do not directly track Good Count, it also needs to be
calculated.
Formula: Total Count − Reject Count
Example: 19,271 widgets − 423 widgets = 18,848 widgets
Availability
Availability is the first of the three OEE factors to be calculated. It
accounts for when the process is not running (both Unplanned
Stops andPlanned Stops).
Formula: Run Time / Planned Production Time
Example: 373 minutes / 420 minutes = 0.8881 (88.81%)
Performance
Performance is the second of the three OEE factors to be calculated.
It accounts for when the process is running slower than its theoretical
top speed (both Small Stops and Slow Cycles).
Formula: (Ideal Cycle Time × Total Count) / Run Time
Example: (1.0 seconds × 19,271 widgets) / (373 minutes × 60
seconds) = 0.8611 (86.11%)
Performance can also be calculated based on Ideal Run Rate. The
equivalent Ideal Run Rate in our example is 60 parts per minute.
Formula: (Total Count / Run Time) / Ideal Run Rate
Example: (19,271 widgets / 373 minutes) / 60 parts per
minute = 0.8611 (86.11%)
Quality
Quality is the third of the three OEE factors to be calculated. It
accounts for manufactured parts that do not meet quality standards.
Formula: Good Count / Total Count
Example: 18,848 widgets / 19,271 widgets = 0.9780 (97.80%)
OEE
Finally, OEE is calculated by multiplying the three OEE factors.
Formula: Availability × Performance × Quality
Example: 0.8881 × 0.8611 × 0.9780 = 0.7479 (74.79%)
OEE can also be calculated using the simple calculation.
Formula: (Good Count × Ideal Cycle Time) / Planned
Production Time
Example: (18,848 widgets × 1.0 seconds) / (420 minutes × 60
seconds) = 0.7479 (74.79%)
The result is the same in both cases. The OEE for this shift is
74.79%.
OEE (overall equipment effectiveness) là thuật ngữ và là thông số rất
phổ biến trong bảo trì năng suất toàn diện (Total Productive
Maintenance). OEE được dùng để đo lường hiệu quả hoạt động
(effectiveness) của một thiết bị (equipment) một cách tổng thể
(overall) thông qua cả 3 mặt nguồn lực– thời gian, chất lượng, và tốc
độ vận hành – và qua đó giúp chỉ ra các vùng cơ hội để cải tiến.
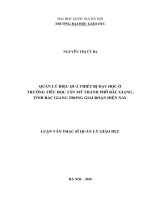
Mô hình OEE
o
Availability, tạm dịch là tỷ lệ hữa dụng, đo lượng tổn thất
thời gian vận hành (downtime)
Availability = (Thời gian hoạt động thực tế)/(Thời gian chạy máy theo
kế hoạch) x 100%
o
Quality, tạm dịch là tỷ lệ chất lượng, đo lượng tổn thất chất
lượng
Quality = (Tổng sản phẩm đạt chất lượng)/(Tổng sản phẩm sản xuất)
x 100%
o
Performance, tạm dịch là tỷ lệ hiệu suất, đo lượng tổn thất
tốc độ vận hành
Performance = (Tổng sản phẩm sản xuất)/(Thời gian chạy máy thực
tế x công suất thiết kế) x 100%
o
Overall Equipment Effectiveness (OEE), tạm dịch là hiệu
quả sử dụng thiết bị tổng thể, đo lường hiệu quả hoạt động
(effectiveness) của một thiết bị (equipment) một cách tổng
thể (overall)
OEE= Availability x Quality x Performance
Phương pháp tính OEE cho chuyền sản xuất trong lĩnh vực giày/dép
Công thức OEE được thiết kế thuần túy cho việc tính hiểu quả hoạt
động của một máy và được sử dụng phổ biến trong các lĩnh vực sản
xuất tự động cơ khí hóa cao. Vì vậy OEE cần phải được điều chính và
linh hoạt thay đổi cho phù hợp với lĩnh vực sản xuất giày/dép như mô
hình sau:
Mô hình tính toán OEE
Trong đó:
Tỷ lệ hữa dụng (Avaiability): là tỷ số giữa thời gian sản xuất thực tế
và thời gian mà chuyền sản xuất được lên kế hoạch (bao gồm thời gian
tăng ca)
Availability = (Thời gian sản xuất thực tế)/(Thời gian sản xuất theo kế
hoạch) x 100%
Tỷ lệ chất lượng (Quality): là tích của RFT (Right First Time) của các
công đoạn Cắt, May, và Lắp Ráp
Quality= (Tổng sản phẩm hạng A)/(Tổng sản phẩm kiểm tra) x 100%
Tỷ lệ năng suất (Performance): là tỷ số giữa hiệu quả sản xuất thực tế
tạo ra sản phẩm theo giờ (bao gồm cả hàng lỗi) và thời gian sản xuất
thực tế:
Performance = (Hiệu quả sản xuất thực tế theo giờ)/(Thời gian sản
xuất thực tế) x 100%
Và Hiệu quả sản xuất tổng thể (OEE) : là tích của các thông số trên:
OEE=Availability x Quality x Perforamnce
Ứng dụng
Để nắm rõ cách sử dụng mô hình tinh OEE trên, bạn đọc cần tham
khảo bảng tính OEE được đính kèm ở cuối phần trình bày này.
Kết quả các thông số của OEE nên được trực quan hóa như biểu đồ
minh họa sau:
Bảng hiển thị OEE
Một cách để diễn giải ý nghĩa của biểu đồ OEE của chuyền như sau:
Avaiability = 97%: nguôn lực về mặt thời gian được tận dụng 97% và
3% còn lại là khoảng thời gian chết (tất nhiên con số này là không