- Trang chủ >>
- Sư phạm >>
- Sư phạm hóa
Efficient reduction of chitosan molecular weight by high intensity ultrasound
Bạn đang xem bản rút gọn của tài liệu. Xem và tải ngay bản đầy đủ của tài liệu tại đây (760.92 KB, 8 trang )
5112
J. Agric. Food Chem. 2008, 56, 5112–5119
Efficient Reduction of Chitosan Molecular Weight by
High-Intensity Ultrasound: Underlying Mechanism
and Effect of Process Parameters
TAO WU,† SVETLANA ZIVANOVIC,*,† DOUGLAS G. HAYES,‡
AND JOCHEN
WEISS§
Food Biopolymers Research Group, Department of Food Science and Technology, The University of
Tennessee, 2509 River Drive, Knoxville, Tennessee 37996-4539; Department of Biosystems
Engineering and Soil Science, The University of Tennessee, 2506 E. J. Chapman Drive, Knoxville,
Tennessee 37996-4531; and Food Biophysics and Nanotechnology Laboratory, Department of Food
Science, Chenoweth Laboratory 234, University of Massachusetts, Amherst, Massachusetts 01003
The degradation of chitosan by high-intensity ultrasound (HIU) as affected by ultrasound parameters
and solution properties was investigated by gel permeation chromatography coupled with static light
scattering. The molecular weight, radius of gyration, and polydispersity of chitosan were reduced by
ultrasound treatment, whereas chitosan remained in the same random coil conformation and the
degree of acetylation did not change after sonication. The results demonstrate that (1) the degradation
of chitosan by ultrasound is primarily driven by mechanical forces and the degradation mechanism
can be described by a random scission model; (2) the degradation rate is proportional toMw3 ; and (3)
the degradation rate coefficient is affected by ultrasound intensity, solution temperature, polymer
concentration, and ionic strength, whereas acid concentration has little effect. Additionally, the data
indicate that the degradation rate coefficient is affected by the degree of acetylation of chitosan and
independent of the initial molecular weight.
KEYWORDS: Chitosan; molecular weight; degradation; high-intensity ultrasound; random scission model
INTRODUCTION
Commercial application of chitosan is closely associated with
its functional properties and biological activities, which are
primarily governed by two structural properties: the molecular
weight (MW) and degree of acetylation (DA). However, the
MW of commercially available chitosan is greatly affected by
the source and the extraction and production methods. It varies
widely between manufacturers and even between batches of the
same manufacturer. With the aim of producing chitosan of
desired MW, various methods, including acid and enzyme
hydrolysis, microwave, UV, and γ irradiation, as well as highintensity ultrasound (HIU), have been investigated (1–4).
HIU has received much attention as a rapid, environmentally
friendly, and byproduct-free method. The mechanism, kinetics,
and application of ultrasound in the degradation of various
synthetic polymers have been widely investigated (5–8). Cleavage of polymer chains by HIU with frequencies ranging from
20 to 100 kHz has been attributed mainly to the action of shear
forces formed due to the relative movement between solvent
* Corresponding author [telephone (865) 974-0844; e-maillanaz@
utk.edu].
†
Department of Food Science and Technology, The University of
Tennessee.
‡
Department of Biosystems Engineering and Soil Science, The
University of Tennessee.
§
University of Massachusetts.
and polymer molecules during the collapse of cavitation bubbles
and the formation of microjets (5). Thus, the underlying cause
of degradation of a polymer by ultrasound is considered to be
primarily of a mechanical nature. However, at frequencies higher
than 100 kHz, free HO* radicals formed by ultrasound in an
aqueous solution have a significant role in the polymer degradation (9). Czechowska et al. used 360 kHz ultrasound treatment
to degrade chitosan and found that the chain scissions were
induced by both mechanical forces and free radicals (10). At
the same time, side reactions leading to the formation of
carbonyl groups were observed (10).
Two types of factors, ultrasound parameters (including frequency and intensity) and solution properties (solvent, temperature,
nature of dissolved gas, nature of polymer, etc.) have been found
to affect the degradation process of polymers (5, 8). Due to the
polydisperse nature of most polymers, an accurate analysis of the
degradation kinetics is almost impossible without information about
the location of chain scission and the dependence of rate coefficients
on the molecular weight of the polymer (5). Two simplified models,
based on different assumptions of the location of chain scission,
have been proposed to quantitatively describe the degradation
process of polymers.
(I) Random Scission Polymer Degradation Model. One of
the earliest models was developed by Schmid; the author
assumed that the scission of polymer chains occurs randomly
and that the rate of degradation decreases with decreasing chain
10.1021/jf073136q CCC: $40.75 2008 American Chemical Society
Published on Web 06/13/2008
Reduction of Chitosan Molecular Weight by HIU
J. Agric. Food Chem., Vol. 56, No. 13, 2008
length (11). By the same assumption, the rate of degradation
reaches zero at Me, the final limiting molecular weight, below
which no further degradation can occur. Thus
(
(
) ( )
Me
k1 Me 2
Me
Me
Me
+ ln 1 )×t+
+ ln 1 Mt
Mt
c m
Mi
Mi
)
(1)
where Mi, Me, and Mt represent the initial and final numberaverage molecular weights and the number-average molecular
weight after sonication time (t), respectively; m refers to the
molecular weight of the monomer, c to the initial molar concentration of the polymer, and k1 to the degradation rate
coefficient.
(II) Midpoint Chain Scission Polymer Degradation Model.
Assuming the degradation occurs at the midpoint of the polymer chain, a continuous distribution model has recently been
developed (12). For a polymer with chain length x, the overall
degradation with a rate constant k2 can be described as
k2
( 2x )
P(x) 98 2P
(2)
The evolution of the number-average molecular weight with
sonication time is thus given by
[
ln
]
Mi - Me
) k3Met
Mt - Me
(3)
where k3 refers to the degradation rate coefficient. Baxter et al.
suggested that the chain scission of chitosan by ultrasound
occurs randomly and follows the Schmid model (13), whereas
Trzcinski and Staszewska argued that a bimodal molecular
distribution is obtained at early stages of degradation, suggesting
that the chain scission is not random but occurs at the midpoint
of the chain (14). However, in both studies kinetics of ultrasonic
degradation has been determined by using the viscosity-average
molecular weight, although both models (eqs 1 and 3) require
that molecular weights are expressed as number-average.
High-intensity ultrasound has been widely investigated for
the degradation of chitosan. In general, it has been found that
HIU reduces the molecular weight, radius of gyration, and
polydispersity of chitosan efficiently without affecting its DA
values (1, 13, 15). Interestingly, it has also been reported that
with intensive sonication, the degree of acetylation of chitosan
increases (i.e., chitosan is actually being acetylated) if the initial
DA is >10% and stays unchanged if it is <10% (16). Similarly
to the degradation behavior of synthetic polymers, chitosan
degrades more rapidly in dilute solutions and at low temperatures (1, 14, 15), whereas the type of solvent has no significant
influence on the degradation rate (1). However, Trzcinski et al.
found that the increase of acetic acid concentration from 0.1 to
1 M results in a higher rate coefficient (14), whereas Li et al.
stated that optimal degradation conditions occur at the lowest
acetic acid concentration (15). The initial molecular weight and
degree of deacetylation have been found to affect the degradation
processschitosan samples with high molecular weight and low
DA are easily degradable by HIU (16, 17).
In summary, despite significant efforts in this area, contradictory results can be found in the literature. In most studies, the
actual ultrasound intensity has not been determined and,
consequently, these results are not only hard to compare but
are of little use for industry to scale up the process. Additionally,
most of the published studies have monitored the degradation
process by determination of the viscosity-average molecular
5113
weight, which lacks information of absolute molecular weight
and cannot be used to analyze kinetics mechanisms. This is
possibly the main reason for the conflicting results in the
literature. A comprehensive study was conducted here with the
objective to determine the effects of HIU parameters (intensity
and treatment time) and solution properties (temperature,
chitosan concentration, acetic acid concentration, ionic strength,
and chitosan initial DA and molecular weight) on the ultrasound
degradation of chitosan using gel permeation chromatography
(GPC) derived values of molecular weight. Additionally, a
simplified approach to predict the change of molecular weight
has been derived, which can be used as a guideline for the
industrial application of HIU in the degradation of chitosan.
EXPERIMENTAL DETAILS
Materials. Chitosan samples with various degrees of acetylation (19,
29, and 39% DA as labeled by the manufacturer) were kindly donated
by Primex (Primex Co., Iceland). Water-soluble chitosan was purchased
from EZ Life Science Co. Ltd. (Seoul, South Korea). Other chemicals
were purchased from Fisher Scientific (Pittsburgh, PA). All chitosan
samples were analyzed for weight-average molecular weight (Mw) and
DA according to methods described below.
Chitosan Solution Preparation. Chitosan solutions, 0.25, 0.5, 1,
and 2% (w/v), were freshly prepared in 1% (v/v) aqueous acetic acid.
Ionic strength of 1% chitosan solution was adjusted to 0.1 and 0.2 M
by adding suitable amounts of sodium chloride. All chitosan solutions
were filtered through Miracloth (rayon-polyester; EMD Bioscience, San
Diego, CA) and kept in a refrigerator prior to sonication. Chitosan with
20.2% DA was used to investigate the effects of acoustic intensity and
time, and 32.5% DA chitosan was used to investigate the effects of
solution properties.
Ultrasound Treatment Procedure. One hundred milliliters of each
chitosan solution was sonicated by a 20 kHz ultrasound generator
(Sonics and Materials VC-750, Newton, CT) with a 0.5 in. titanium
probe in pulse mode (30 s on, 30 s off) in 100 mL glass beakers. For
evaluation of effects of sonication time and amplitude, the temperature
control of the generator was set at 30 °C and the sample was kept in
an ice-water bath during the experiment. For evaluation of effects of
temperature, the temperature control was set at 30, 50, and 80 °C and
the beakers with samples were placed in an iced water bath, an ambient
temperature water bath, and ambient air, respectively. The sample temperature was monitored by a temperature probe during the entire
ultrasound process. The temperature of solution increased when the
sonication was on and dropped a few degrees when the sonication was
off, but the maximum temperature did not exceed 30, 50, and 80 °C,
corresponding to the preset values of the generator. The sonication time
ranged from 5 to 60 min. A 1.0 mL aliquot of sonicated sample solution
was taken at specified time intervals, diluted with the solvent, and
analyzed by gel permeation chromatography (GPC). All of the presented
data points were averages of at least two independent sonication
experiments.
The ultrasonic intensity can be measured calorimetrically by measuring the time-dependent increase in temperature of sample in the
ultrasonic reactor (18). However, the intensity of ultrasound can be
simply controlled by setting the displacement (PA) of the ultrasound
generator probe. As PA increases, both the number and size of cavities
increase, resulting in an increased overall chemical and mechanical
activity. On the basis of the manufacturer’s manual, for a 13 mm
threaded probe with a replaceable tip, the PA set at 100% results in an
amplitude of 124 µm and maximum power output. Four ultrasound
intensities, 47, 57, 67, and 87%, were chosen for this study, which
corresponded to PA values of 58, 70, 83, and 108 µm, respectively.
The ultrasonic wave intensities at these four amplitudes were measured
calorimetrically by determining the time-dependent change of sample
temperature in the ultrasonic reactor as 31, 37, 48, and 62 W/cm2
according to
5114
J. Agric. Food Chem., Vol. 56, No. 13, 2008
I)
mCp dT
dT
A
dt a
dt
[( ) ( ) ]
b
Wu et al.
(4)
where (dT/dt)a is the slope of the initial temperature rise and (dT/dt)bis
the slope of heat loss after the ultrasonic reactor was turned off; m
is the sample mass, Cp is the heat capacity of the solvent, and A is
the end surface area of sonicator probe. Unless specified, all
experiments were carried out at an intensity of 48 W/cm2, a
temperature of 30 °C, a chitosan concentration of 1%, and acetic
acid concentration of 1%.
GPC Coupled with Multiangle Laser Light Scattering Detector
(MALLS). GPC separations were performed by a Waters 2596 module
on three columns (Ultrahydrogel 500, 1000, and 2000; Waters, Milford,
MA) with aqueous buffer (0.15 M ammonium acetate/0.2 M acetic
acid, 0.02% sodium azide, pH 4.5) as mobile phase at a flow rate of
0.8 mL/min. The column effluent was analyzed by a miniDAWN light
scattering detector (Wyatt, Santa Barbra, CA) in series with a refractive
index detector (Waters), with the detector outputs analyzed by ASTRA
4 software (Wyatt). The former detector provided measurements of Mw,
and the latter detector provided measurements of concentration. The
cumulative and differential molecular weight distributions were obtained
by ASTRA 5 software. Results from the light scattering detector were
analyzed by Zimm plots, and known dn/dc and AUX calibration
constants were used for the calculation of molecular weight and radius
of gyration. The dn/dc values were adopted from the literature as
approximately 0.184, 0.184, 0.185, and 0.187 (L/g) for chitosan samples
of 32.5, 30.3, and 20.2% DA and water-soluble chitosan, respectively
(19). The GPC samples were prepared as follows: For chitosan samples
with Mw > 100 kDa the concentration was 0.1% and for samples with
Mw < 100 kDa the concentration was 0.2%; injection volumes were
100 µL. The column and RI detector temperature was 30 °C, and the
detector cells of MALLS were kept at ambient temperature. Sample
solution and mobile phase were filtered through a 0.45 µm slightly
hydrophobic poly(vinylidene difluoride) (PVDF) membrane (Whatman,
Clifton, NJ) before use.
Overlap and Entanglement Concentrations. Overlap and entanglement concentrations for chitosan of 32.5% DA were estimated following
the method of Cho et al., where the former and latter were defined to
be the concentrations at which η equaled 2ηs and 50ηs, respectively,
where ηs is the viscosity of the solvent (20). The viscosity of chitosan
solutions was determined by a Cannon-Fenske viscometer at 25 °C
with a minimum of three replications performed.
Purification of Sonicated Chitosan for DA Measurement. After
30 min of sonication, the pH of chitosan solutions was adjusted to 10
using 1 M NaOH. The precipitated chitosan was collected by
centrifugation, dispersed in deionized water, and centrifuged again. The
whole process was repeated three or four times until the pH of the
supernatant was 7. The pellets were freeze-dried and stored in a
desiccator until further analysis.
DA Measurement. The DA analysis was performed according to
the modified first-derivative UV method (21). In short, 100 mg of
sample was dissolved by 20 mL of 85% phosphoric acid at 60 °C with
stirring for 40 min. The solution was diluted with deionized water (100:1
v/w) and incubated at 60 °C for 2 h before UV analysis. Standard
solutions of acetylglucosamine (GlcNAc) and glucosamine (GlcN) were
prepared in 0.85% phosphoric acid at concentrations of 0, 10, 20, 30,
40, and 50 µg/mL. The calibration curve was made by plotting the
first derivative of UV values at 203 nm (H203) as a function of the
concentrations of GlcNAc and GlcN.
UV Spectra Measurement. UV spectra of solutions of chitosan
sonicated at 62 W/cm2 for 30 min were collected using a Shimadzu
2010 (Shimadzu, Columbia, MD) double-beam UV-vis spectrophotometer under scan mode in the range from 400 to 190 nm. Sampling
interval and slit width were both set at 1.0 nm. Chitosan samples at a
concentration of 1% in 1% acetic acid were diluted with deionized
water (25:1 v/v) before the UV measurement.
Statistical Analysis and Mathematical Estimation of Me, k1, and
k2 Values. All experiments were repeated three times. ANOVA analysis
and significant difference between treatments were determined using
Duncan’s multiple-range test by SAS program 9.13 (SAS Institute Inc.,
2003). Mathcad (PTC, Needham, MA) was used to perform least-
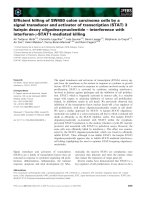
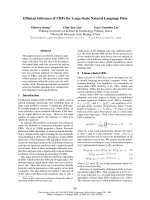
Figure 1. Variation of number-average molecular weight (Mn) with time
of sonication for chitosan with different degrees of acetylation and initial
molecular weights. Values are represented as mean ( standard deviation
(n ) 3).
squares analysis to estimate Me, k1 (eq 1), and k3 (eq 3) for random
scission and midpoint scission models applied to the Mt versus t data.
The best-fit values of Me, k1, and k3 were found at local minima in the
plot of error versus k1 and Me and error versus k3 and Me, respectively.
RESULTS
Investigation of Models That Describe Sonolysis of Chitosan. As shown in Figure 1, the number-average molecular
weight, Mn for all chitosan samples decreased with the sonication
time at an intensity of 62 W/cm2. The determined values of Mn
had relatively large standard deviations compared to the values
of Mw described later. This is commonly attributed to the
interaction between polymer and GPC column stationary
phase (22, 23).
To determine which model describes sonolysis of chitosan
best, it is necessary to find the final limiting molecular weight
Me of chitosan. To achieve it, a 31 kDa chitosan was sonicated
for 3 h, resulting in a final Mn of 17 kDa, which was used as
the experimental Me value to calculate the experimental
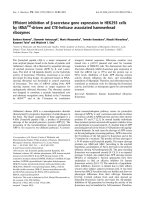
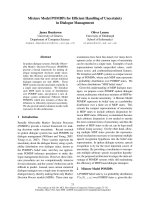
degradation kinetics. Plots of ln[(Me - Mi)/(Mt - Mi)] versus
sonication time for the midpoint scission model and -(Me/Mt)
- ln[(1 - (Me/Mt) versus sonication time for the random scission
model are shown in panels A and B, respectively, of Figure 2.
Plotting the values for the midpoint scission model, only the
9.10% DA chitosan gave a straight line (Figure 2A), whereas
all of the analyzed chitosans gave straight line plots (R2 > 0.99)
based on the random scission model (Figure 2B).
Because Me may vary between sonication treatments and the
experimentally derived value of 17 kDa might not be universal
for all cases, a least-squares analysis was employed to find the
best-fit values of Me for each model and chitosan sample. The
results presented in Table 1 demonstrate that applying numerically derived values of Me did not affect the correlation
coefficients. These results indicated that the ultrasonic degradation of chitosan was not midpoint scission based but rather
happened randomly along the chitosan molecule, independent
of the method used to estimate the Me values. Similarly, Baxter
et al. found that chitosan was randomly degraded by sonolysis
(13); likewise, Tayal and Khan found that ultrasonic degradation
of a water-soluble guar galactomannan also followed the random
scission model (24). However, another study suggested that the
degradation of chitosan by ultrasound was not truly random but
was related to the sequence of bond energies: GlcN-GlcN >
Reduction of Chitosan Molecular Weight by HIU
J. Agric. Food Chem., Vol. 56, No. 13, 2008
5115
Table 1. Degradation Rate Coefficients and Regression Coefficients as a
Function of Degree of Acetylation (DA) for Random Chain and Middle
Chain Scission Models Using Experimental and Least-Squares Analysis
Estimated Final Number-Average Molecular Weight (Me)
Random Scission (Equation 1)
DA
(%)
Me (kDa)
k1a × 1011
(Da min-1)
30.3
20.2
32.5
9.10
17.0
17.0
17.0
17.0
1.34
1.75
2.89
35.2
R12
Me′b
(kDa)
k1′ × 1011
(Da1- min-1)
R12
0.999
0.990
0.991
0.979
36.2
36.8
26.0
1.95
2.27
3.30
3.88
13.2
0.991
0.997
0.986
0.991
k3′ × 104
(Da1- min-1)
R22
Middle Chain Scission (Equation 3)
DA
(%)
30.3
20.2
32.5
9.10
Me(kDa)
k3a × 106
(Da min-1)
17.0
17.0
17.0
17.0
Me′b
(kDa)
R12
2.47
2.34
2.35
1.69
0.901
0.885
0.923
0.991
0.161
0.161
0.161
8.50
c
2.03
1.86c
1.77c
1.76
0.874
0.856
0.893
0.992
a
k1 and k3 were obtained using the experimentally derived value of Me at 17.0
kDa. b Values of Me′ were estimated for the random scission and midpoint scission
models by least-squares analysis. c Least-squares analysis resulted in negative
Me and a Me ) 0.161 kDa (Me equals 1 glucosamine monomeric unit) was used
to recalculate the calculate the k3′; R12 and R22 were correlation coefficients of the
regression lines plotted in Figure 11 using the experimentally determined value of
Me and regression lines (data not shown) using least-squares analysis estimated
Me, respectively.
Table 2. Degree of Acetylation (DA) before and after Sonication (30 min,
62 W/cm2) and Initial Weight-Average Molecular Weight (Mw) of Chitosan
Samples Used in This Studya
Figure 2. Evaluation of the midscission model (A) and random scission
model (B) of chitosan degradation. [H ) (Mi - Me)/(Mt - Me)] applied to
the data plotted in Figure 1 using experimentally determined values of
Me.
GlcNAc-GlcN ≈ GlcN-GlcNAc > GlcNAc-GlcNAc (27).
Because the exact distribution of these bonds in a chitosan chain
is unknown, the precise site of chain scission cannot be
determined. Therefore, our data fit the random scission model
better than the midpoint scission model due to the unique
copolymer structure of chitosan.
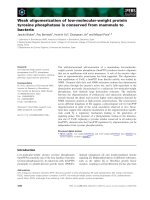
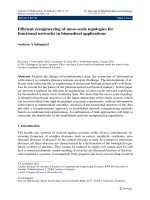
Effect of Molecular Weight on Chitosan Degradation by
HIU. The weight-average molecular weights (Mw) before sonication are presented in Table 2. The Mw decreased exponentially
during sonication for samples with high initial Mw, whereas it
decreased linearly for samples with low molecular weight (Figure
3). These results indicated that the ultrasound treatment was more
efficient for the degradation of high molecular weight chitosan,
which was in agreement with previous results (1, 16). Earlier studies
has developed the following equation to predict the change of
polymer Mw during ultrasonic degradation ( 17, 29):
k4′
1
1
1
)
+ t)
+ k4t
(Mw)t (Mw)i m
(Mw)i
(5)
(Mw)t is Mw of the polymer after sonication time t, (Mw)i is the
initial Mw of the polymer, m is the molecular weight of the
monomer, and k4′ and k4 are general rate coefficients. A plot of
1/(Mw)t versus the sonication time resulted in a nonlinear
relationship (data not shown). However, plots of 1/(Mw)t2 versus
sonication time were all linear (inset in Figure 3), indicating
sample
40% DA chitosan
30% DA chitosan
20% DA chitosan
water-soluble chitosan
a
nominal measured measured DA (%) measured Mw
DA (%) DA (%)
after sonication
(kDa)
32.5 ( 0.8
30.3 ( 0.2
20.2 ( 0.1
9.10 ( 0.6
39
29
19
30.0 ( 0.1
28.0 ( 0.7
20.4 ( 0.5
9.00 ( 0.1
221.8 ( 3.3
420.9 ( 1.3
306.8 ( 1.8
53.34 ( 0.5
Values are represented as mean ( standard deviation (n ) 3).
that the change of molecular weight could be predicted by the
following equation:
1
2
(Mw)t
-
1
2
(Mw)i
) k5t
(6)
Thus, the rate of Mw reduction was actually proportional to
the cube of initial molecular weight and could be described by
dMw
k5 3
) - Mw
dt
2
(7)
It is worth noting that the rate coefficient k5 is not an absolute
rate constant to describe the rate of chitosan chain scission, but
rather refers to processing parameters that are associated with
the particular reaction conditions, geometry, and ultrasound
frequency.
Effect of Degree of Acetylation on Chitosan HIU Degradation. The general rate coefficients k5 (eq 6) for 32.5, 30.3,
and 20.2% DA chitosan were similar, whereas the rate coefficient of 9.10% DA water-soluble chitosan was a factor of 2-3
higher (Table 3, experiments 1-4). In contrast, the study of
Trzcinski and Staszewska showed that the general rate coefficient decreased with the decrease of degree of acetylation (14).
However, a low-intensity ultrasound generator was used in the
5116
J. Agric. Food Chem., Vol. 56, No. 13, 2008
Wu et al.
Figure 3. Variation of Mw with sonication time for chitosan with different
initial molecular weights and degrees of acetylation. (Inset) 1/(Mw)2 versus
sonication time. Values are represented as mean ( standard deviation
(n ) 3).
Table 3. Degradation Rate Coefficients (k5, Equation 6) as Affected by
Ultrasonic Parameters, Solution Properties, and Degree of Acetylationa
chitosan
NaCl
DA intensity concn temperature added acetic acid k5 × 1012
(°C)
(M) concn (v/v) (Da-2 min-1)
expt (%) (W/cm2) (%, m/V)
1
2
3
4
5
6
7
8
9
10
11
12
13
14
15
16
17
18
19
20
21
9.10
20.2
30.3
32.5
20.2
20.2
20.2
20.2
32.5
32.5
32.5
32.5
32.5
32.5
32.5
32.5
32.5
32.5
32.5
32.5
32.5
a
62
62
62
62
31
37
48
62
48
48
48
48
48
48
48
48
48
48
48
48
48
1.00
1.00
1.00
1.00
1.00
1.00
1.00
1.00
0.25
0.50
1.00
2.00
1.00
1.00
1.00
1.00
1.00
1.00
1.00
1.00
1.001
30
30
30
30
30
30
30
30
30
30
30
30
80
50
30
30
30
30
30
30
30
0.10
0.20
1.00
1.00
1.00
1.00
1.00
1.00
1.00
1.00
1.00
1.00
1.00
1.00
1.00
1.00
1.00
1.00
1.00
1.00
1.00
2.00
4.00
13.3 ( 0.4
5.35 ( 1.32
5.59 ( 0.24
7.62 ( 0.11
2.03 ( 0.16
2.63 ( 0.03
3.35 ( 0.03
5.35 ( 1.32
11.0 ( 0.4
10.1 ( 0.1
6.75 ( 0.78
3.23 ( 0.12
3.01 ( 0.12
4.66 ( 0.07
6.75 ( 0.78
6.75 ( 0.78
3.71 ( 0.29
3.44 ( 0.31
6.75 ( 0.78
6.26 ( 0.14
6.48 ( 0.20
Values are represented as mean value ( standard error.
cited study, and results might not be directly comparable to the
results of Table 3, which employed high-intensity ultrasound.
In another study the authors observed that the rate coefficients
of ultrasound degradation increased with the decrease of chitosan
DA and interpreted their results to reflect that highly deacetylated chitosan molecules were more expanded and thus more
vulnerable to breakage by shear forces (17). The same study
also suggested that the difference in bond energy of -1,4glucosidic linkages among different monomer units may be
responsible for the experimental observation (17). A recent
study, in fact, showed that the hydration energies in the 1,4- glucosidic bonds were in the order of GlcNAc-GlcNAc >
GlcN-GlcNAc ≈ GlcNAc-GlcN > GlcN-GlcN, and the
authors proposed that the higher the hydration energy of the
bond, the more energy would be needed to break the bond (27).
According to the latter, chitosan with lower DA values was more
vulnerable to degradation by ultrasound due to lower bond
energy (27).
Figure 4. Variation of weight-average molecular weight (Mw) with
sonication time for 20.2% degree of acetylation chitosan receiving 30 min
of sonication, followed by freeze-drying and sonication for 30 min. (Inset)
1/(Mw)2 versus sonication time. Values are represented as mean (
standard deviation (n ) 3); rate coefficients k5 were 5.35 × 10⁻¹² and
5.93 × 10⁻¹² Da-2 min-1 for the first and second sonications.
At this point we could not conclude that the difference
between the rate coefficients (Table 3) was caused solely by
the difference in DA because the samples also differed in initial
Mw. However, the results showed that although the degradation
rate was proportional to Mw3, the rate coefficient was independent of the initial Mw. When a sonicated sample was collected,
freeze-dried, and sonicated for the second time, the decrease of
Mw for the second stage continued the trend for the first stage.
As shown in Figure 4, the degradation of a sample with an
initial Mw of 72 kDa maintained the degradation trend of its
“parent” molecule with an initial Mw of 307 kDa. The data were
horizontally transpositioned to show the continuous trend in Mw
reduction (Figure 4), and the 1/Mw2 versus time plot (inset in
Figure 4) reflects the similarity of the rate coefficients (5.35 ×
10-12 and 5.93 × 10⁻¹² Da-2 min-1 for the original and
resonicated sample, respectively). Thus, our results indicate that
the degradation rate coefficient of chitosan sonication is affected
mainly by the DA values. The results showed that only highly
deacetylated chitosan (DA 9.10%) was easily degraded, whereas
chitosans with DA values in the range of 20.2-32.5% degraded
at a slower rate. Similarly, Vijayalakshmi and Madras found
that the rate coefficient of sonication degradation was nearly
independent of the initial molecular weight of poly(ethylene
oxide) (30).
Effect of Free Radical Scavenger on the Chitosan Degradation by Sonolysis. As shown in Figure 1 of the Supporting
Information, the degradation processes for 9.10 and 20.2% DA
chitosan were identical regardless of the presence of 0.005 mol/L
tert-butanol in the solutions. tert-Butanol is an effective HO*
radical scavenger, and addition of 0.005 mol/L of this compound
into the chitosan solution would significantly eliminate the
formation of HO* radicals without affecting the cavitation
behavior of ultrasound (10). Czechowska et al. found that the
degradation of chitosan by a 360 kHz ultrasound was greatly
inhibited with the addition of 0.005 mL/L tert-butanol and
suggested that ultrasonic degradation at this frequency was the
result of both mechanical forces and free radical reactions (10).
However, because the addition of tert-butanol did not affect
the degradation kinetics of chitosans during 20 kHz sonication
(Supporting Information Figure 1), we conclude that the
ultrasonic degradation under these conditions was only mechanically induced.
Reduction of Chitosan Molecular Weight by HIU
Effect of Ultrasound Intensity on the Degradation Process. The influence of ultrasound intensity on the degradation
of 20.2% DA chitosan is presented in Table 3 (experiments
5-8). As expected, the results showed that the rates of ultrasonic
degradation increased with an increase of ultrasonic intensity.
Similar observations were made by Price and Smith for the
degradation of polystyrene (31). A linear relationship was found
between the rate coefficient and the ultrasound intensity
(Supporting Information Figure 2), and a similar relationship
was suggested for chitosan in an earlier study that employed
viscosity-average molecular weight (13). The nonzero intercept
of this regression line (Supporting Information Figure 2) is
consistent with fundamental cavitation physics stating that
cavitations are generated only above a certain intensity threshold,
referred to as the “cavitation threshold” (18).
Effect of Temperature on the Degradation Process. The
influence of solution temperature on the degradation rate of
ultrasound was investigated at an intensity of 48 W/cm2 at 30,
50, and 80 °C. Samples were sonicated in either ice-water, a
room temperature water bath, or ambient air. The degradation
rate coefficients decreased with increasing temperature (Table 3,
experiments 13-15). These results are in agreement with published
reports for synthetic polymers and chitosan (1, 14, 31, 32).
According to the cavitation physics, cavitation is more active in
solvents with lower vapor pressure. Because the vapor pressure of
solvents increases with increasing temperature, more solvent
molecules may diffuse into the cavities at higher temperatures,
thereby dampening the collapse, an effect referred to as “cushioning”. A similar dependence of degradation rate on temperature has
been reported for the degradation of polyacrylamide and poly(ethylene oxide) (32).
Effect of Solution Properties on the Degradation Process. The effects of solution properties were investigated by
varying the polymer concentration (0.25, 0.5, 1, and 1%), ionic
strength (1% chitosan prepared in 1% acetic acid with 0.1 and
0.2 M NaCl), and acetic acid concentration (1% chitosan in 1,
2, an 4% acetic acid).
As presented in Table 3 (experiments 9-12), the rate coefficients decreased with increasing polymer concentration. This is
consistent with published studies of the degradation of synthetic
polymers and chitosan (1, 5, 14). With increasing polymer
concentration, the viscosity of the solution increases, thereby
reducing the extent of the cavitation activity and hence the polymer
scission rate (33). The rate coefficients for 0.25 and 0.5% chitosan
were similar, suggesting that the increase of the degradation rate
due to the decrease of polymer concentration has a limit below
which a further reduction in polymer concentration has no effect
on the degradation rate. Is this limiting concentration the overlapping (C*) or entanglement concentration (Ce)? The overlap
concentrations of chitosan were reported to be 1.05 g/L (34)and
2.8 g/L (35), depending on the source of chitosan, whereas the
entanglement concentrations were reported as 5.0 and 7.4 g/L for
chitosan with Mw 8.5 × 10⁵ g/mol depending on the measurement
methods (20). In this study, the overlap and entanglement concentrations of the investigated chitosan were determined as 0.27
and 8.87 g/L, respectively. We therefore suggest that the limiting
concentration of chitosan is between the overlap concentration and
the entanglement concentration, but closer to the latter value. It is
likely that as soon as the polymers act as individual molecules,
the effect of polymer concentration on ultrasonic degradation
becomes insignificant.
As presented in Table 3 (experiments 16-18), the rate
coefficients decreased with the addition of 0.1 and 0.2 M NaCl,
respectively. Addition of more than 0.5 M NaCl to the chitosan
solution resulted in formation of precipitate, which was at-
J. Agric. Food Chem., Vol. 56, No. 13, 2008
5117
tributed to increased hydrophobic interactions, hydrogen bonding, and/or a decrease in electrostatic repulsion (20).
The original ionic strength of the system was based on the
contributions of chitosan itself and acetic acid and was calculated
to be 0.08 M. With the addition of 0.1 M NaCl, the degradation
rate decreased by approximately 50%. Further increases of ionic
strength did not cause significant decreases in the rate coefficient.
The reduction of the rate coefficient with increasing ionic
strength may be explained by the change in the molecular conformation as the chitosan chains may assume a more compact
structure with an increase of ionic strength (20). Similar results
have been found for the degradation of dextran (5).
The rate coefficients of ultrasonic degradation of 1% chitosan
in 1, 2, and 4% acetic acid are presented in Table 3 (experiments
19-21). The difference between these values is very small, and
the effect of acetic acid concentration in this range on the ultrasonic
degradation of chitosan appears to be insignificant. As mentioned
earlier, the rate of ultrasound degradation was found to be primarily
affected by the vapor pressure of a solvent, whereas the effects of
solvent viscosity and surface tension are not as pronounced (5).
Because the concentration of acetic acid in our study was never
more than 4%, we concluded that the effect of acetic acid
concentration on the solvent vapor pressure was probably too small
to affect the rate of ultrasonic degradation. Furthermore, because
the pKa of chitosan is around 6.3 and the pH for 1% chitosan in
1% acetic acid was 4, the majority of amino groups on chitosan
were protonated, and further increases in the acid concentration to
4% did not significantly affect chitosan conformation. Our results
were similar to study of Chen et al. (1), whereas Trzcinski et al.
reported that the increase of acetic acid concentration caused an
increase of general rate parameters (14). The contradictory results
of Trzcinski et al. (14) may be caused by different behavior of the
system due to the application of a low-power ultrasound emitter
with a frequency of 35 kHz and a sonic intensity of 2 W/cm2.
Effect of Ultrasound on Radius of Gyration, Polydispersity, Conformation, Molecular Weight Distribution, and
Degree of Acetylation of Chitosan. As shown in Figure 5,
the z-average radius of gyration (Figure 5A) and the corresponding polydispersity (Figure 5B) all decreased with sonication time. As a result of the molecular weight decrease (Figure
1), the decrease of the radius of gyration was expected. The
decrease of polydispersity with passage of sonication time has
been reported and was attributed to the fact that large molecules
are more easily degraded (1).
The differential molecular weight and cumulative molecular
weight distribution of 20.2% DA chitosan sonicated at 62 W/cm2
are shown in Figure 6A and Figure 3 of the Supporting
Information, respectively. The cumulative distribution W(M) is
defined as the weight fraction of sample having a molar mass
of less than M:
W(M) )
∑ CM′
M′
∑ CM
(8)
where CM is the mass concentration for the fraction having a
molar mass of M′. The differential distribution is defined as
X(M) )
dW(M)
d(log M)
(9)
As seen from both plots, the fractions of low molecular weight
chitosan increased, and chitosan with lower polydispersity was
obtained with increasing sonication time. The evolution of the
mass molecular weight distribution using Mw in this study is
consistent with the results using Mn (12).
5118
J. Agric. Food Chem., Vol. 56, No. 13, 2008
Wu et al.
Figure 5. Alteration of radius of gyration and polydispersity of chitosan
Figure 6. Alteration of differential molecular weight distribution (A) and
conformation of chitosan (B) with sonication time (30.3% DA chitosan).
with sonication time for chitosan with different molecular weights and
degrees of acetylation. Values are represented as mean ( standard
deviation (n ) 3).
Although the molecular weight distribution shifted toward lower
molecular weights with increasing sonication time, conformation
plots (Figure 6B) showed that the majority of chitosan molecules
remained in the same conformation after sonication. If a macromolecule of mass M is composed of i elements of mass m, the
mean square radius 〈rg2〉 can be expressed as
〈r2g 〉 )
∑ ri2mi ⁄ ∑ mi ) M1 ∑ ri2mi
i
i
(10)
i
where ri is the distance of element mi to the mass center of the
macromolecule with mass M. The radius can be related to the
molar mass Mw by
rg ) kM wR
(11)
The plot of 〈rg2〉 versus the logarithm of the molar mass can
be used to determine the slope R, which can provide valuable
information about the polymer conformation. Theoretical slopes
of 0.33, 0.50, and 1.0 have been described for spheres, random
coils, and rigid rods, respectively. The slope R of this plot is
related to the Mark-Houwink parameter a by
R ) (a + 1)/3
(12)
Most real random coils have an “a” value in the range of
0.55-0.60. The calculated slope of the regression lines for the plots
in Figure 6B were 0.50 ( 0.02 for chitosan subjected to 0-60
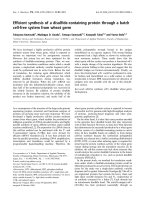
Figure 7. UV spectra of chitosan spectra before and after high-intensity
ultrasound treatment for 30 min at 62 W/cm2.
min of sonication. The results showed that chitosan remained in a
random coil conformation after the sonication regardless of
sonication time. This suggests that the degradation is not free radical
induced because free radical degradation would result in the
formation of macromolecular free radicals, and the recombination
of these macromolecular free radicals would likely lead to the
formation of side chains and a conformational change.
The UV spectra of chitosan before and after sonication further
suggest that degradation was not free radical induced (Figure 7).
HIU did not alter the UV spectrum of chitosan aqueous solutions
Reduction of Chitosan Molecular Weight by HIU
significantly, in contrast to the degradation carried out by a 360
kHz ultrasound, where byproducts containing carbonyl groups were
formed as evidenced by a new absorbance peak at 265 nm in the
UV spectra (10). This further strengthens the argument that at low
frequencies the degradation is mainly due to mechanical forces.
The DA values of chitosan before and after sonication are listed
in Table 2. ANOVA showed that high-intensity ultrasound treatment had no significant effect on the DA values. Our results are
similar to those of Baxter et al. (13), but contrast with those of
Liu et al. (16). Liu et al. used a relatively long sonication time
compared to our study, which may be the reason for these
discrepancies (16).
ACKNOWLEDGMENT
We thank the application scientist, Dr. Myers, at Wyatt
Technology Corp. for assistance in obtaining the cumulative
and differential molecular weight distributions of chitosan using
software ASTRA V.
Supporting Information Available: Degradation processes for
9.10 and 20.2% DA chitosan, relationship between the rate
coefficient and the ultrasound intensity, and cumulative molecular weight distribution of 20.2% DA chitosan. This material
is available free of charge via the Internet at .
LITERATURE CITED
(1) Chen, R. H.; Chang, J. R.; Shyur, J. S. Effects of ultrasonic
conditions and storage in acidic solutions on changes in molecular
weight and polydispersity of treated chitosan. Carbohydr. Res.
1997, 299 (4), 287.
(2) Ilyina, A. V.; Tikhonov, V. E.; Albulov, A. I.; Varlamov, V. P.
Enzymic preparation of acid-free-water-soluble chitosan. Process
Biochem. 2000, 35 (6), 563–568.
(3) Wasikiewicz, J. M.; Yoshii, F.; Nagasawa, N.; Wach, R. A.;
Mitomo, H. Degradation of chitosan and sodium alginate by γ
radiation, sonochemical and ultraviolet methods. Radiat. Phys.
Chem. 2005, 73 (5), 287.
(4) Hasegawa, M.; Isogai, A.; Onabe, F. Preparation of low-molecularweight chitosan using phosphoric acid. Carbohydr. Polym. 1993,
20 (4), 279–283.
(5) Basedow, M. A.; Ebert, H. K. Ultrasonic degradation of polymers
in solution. AdV. Polym. Sci. 1977, 22, 83–148.
(6) Price, G. Applications of high intensity ultrasound in polymer
chemistry. Chem. Ind. 1993, 3, 75–78.
(7) Suslick, K. S.; Price, G. J. Applications of ultrasound to materials
chemistry. Annu. ReV. Mater. Sci. 1999, 29, 295–326.
(8) Mason, T. J.; Lorimer, J. P. Applied Sonochemistry s The Uses
of Power Ultrasound in Chemistry and Processing; Wiley-VCH
Verlag: Weinheim, Germany, 2002.
(9) Mark, G.; Tauber, A.; Laupert, R.; Schuchmann, H.-P.; Schulz,
D.; Mues, A.; von Sonntag, C. OH-radical formation by ultrasound
in aqueous solutionspart II: terephthalate and Fricke dosimetry
and the influence of various conditions on the sonolytic yield.
Ultrason. Sonochem. 1998, 5 (2), 41.
(10) Czechowska-Biskup, R.; Rokita, B.; Lotfy, S.; Ulanski, P.; Rosiak,
J. M. Degradation of chitosan and starch by 360-kHz ultrasound.
Carbohydr. Polym. 2005, 60 (2), 175–184.
(11) Schmid, G. Zur Kinetik der Ultraschalldepolymerisation. Z. Phys.
Chem. 1940, 186 (3), 113–128.
(12) Madras, G.; Kumar, S.; Chattopadhyay, S. Continuous distribution
kinetics for ultrasonic degradation of polymers. Polym. Degrad.
Stab. 2000, 69 (1), 73.
(13) Baxter, S.; Zivanovic, S.; Weiss, J. Molecular weight and degree
of acetylation of high-intensity ultrasonicated chitosan. Food
Hydrocolloids 2005, 19 (5), 821.
(14) Trzcinski, S.; Staszewska, D. U. Kinetics of ultrasonic degradation
and polymerisation degree distribution of sonochemically degraded
chitosans. Carbohydr. Polym. 2004, 56 (4), 489.
J. Agric. Food Chem., Vol. 56, No. 13, 2008
5119
(15) Li, J.; Du, Y. M.; Yao, P. J.; Wei, Y. A. Prediction and control
of depolymerization of chitosan by sonolysis and degradation
kinetics. Acta Polym. Sin. 2007, 5, 401–406.
(16) Liu, H.; Bao, J.; Du, Y.; Zhou, X.; Kennedy, J. F. Effect of
ultrasonic treatment on the biochemphysical properties of chitosan.
Carbohydr. Polym. 2006, 64 (4), 553.
(17) Tsaih, M. L.; Chen, R. H. Effect of degree of deacetylation of
chitosan on the kinetics of ultrasonic degradation of chitosan.
J. Appl. Polym. Sci. 2003, 90 (13), 3526–3531.
(18) Kardos, N.; Luche, J.-L. Sonochemistry of carbohydrate compounds. Carbohydr. Res. 2001, 332 (2), 115.
(19) Sorlier, P.; Rochas, C.; Morfin, I.; Viton, C.; Domard, A. Light
scattering studies of the solution properties of chitosans of varying
degrees of acetylation. Biomacromolecules 2003, 4, 1034–1040.
(20) Cho, J.; Heuzey, M. C.; Begin, A.; Carreau, P. J. Viscoelastic
properties of chitosan solutions: Effect of concentration and ionic
strength. J. Food Eng. 2006, 74 (4), 500.
(21) Wu, T.; Zivanovic, S. Determination of the degree of acetylation
(DA) of chitin and chitosan by an improved first derivative UV
method. Carbohydr. Polym. 2008, 73 (2), 248–253.
(22) Barth, H. G.; Boyes, B. E.; Jackson, C. Size exclusion chromatography. Anal. Chem. 1996, 68, 445–466.
(23) Barth, H. G.; Boyes, B. E.; Jackson, C. Size exclusion chromatography and related separation techniques. Anal. Chem. 1998, 70, 251–
278.
(24) Tayal, A.; Khan, S. A. Degradation of a water-soluble polymer:
molecular weight changes and chain scission characteristics.
Macromolecules 2000, 33, 9488–9493.
(25) Kurita, K.; Sannan, T.; Iwakura, Y. Studies on chitin, 4. Evidence
for formation of block and random copolymers of N-acetyl-Dglucosamine and D-glucosamine by hetero- and homogeneous
hydrolyses. Makromol. Chem. 1977, 178 (12), 3197–3202.
(26) Berkowski, K. L.; Potisek, S. L.; Hickenboth, C. R.; Moore, J. S.
Ultrasound-induced site-specific cleavage of azo-functionalized
poly(ethylene glycol). Macromolecules 2005, 38, 8975–8978.
(27) Liu, H.; Du, Y. M.; Kennedy, J. F. Hydration energy of the 1,4bonds of chitosan and their breakdown by ultrasonic treatment.
Carbohydr. Polym. 2007, 68 (3), 598–600.
(28) Cravotto, G.; Omiccioli, G.; Stevanato, L. An improved sonochemical reactor. Ultrason. Sonochem. 2005, 12 (3), 213–217.
(29) Portenlanger, G.; Heusinger, H. The influence of frequency on
the mechanical and radical effects for the ultrasonic degradation
of dextranes. Ultrason. Sonochem. 1997, 4, 127–130.
(30) Vijayalakshmi, S. P.; Madras, G. Effect of initial molecular weight
and solvents on the ultrasonic degradation of poly(ethylene oxide).
Polym. Degrad. Stab. 2005, 90 (1), 116–122.
(31) Price, G. J.; Smith, P. F. Ultrasonic degradation of polymer solutions:
2. The effect of temperature, ultrasound intensity and dissolved gases
on polystyrene in toluene. Polymer 1993, 34 (19), 4111.
(32) Vijayalakshmi, S. P.; Madras, G. Effect of temperature on the
ultrasonic degradation of polyacrylamide and poly(ethylene oxide).
Polym. Degrad. Stab. 2004, 84 (2), 341.
(33) Kuijpers, M. W. A.; Prickaerts, R. M. H.; Kemmere, M. F.;
Keurentjes, J. T. F. Influence of the CO2 antisolvent effect on
ultrasound-induced polymer scission kinetics. Macromolecules 2005,
38, 1493–1499.
(34) Desbrieres, J. Viscosity of semiflexible chitosan solutions: influence of concentration, temperature, and role of intermolecular
interactions. Biomacromolecules 2002, 3, 342–349.
(35) Hwang, J. K.; Shin, H. H. Rheological properties of chitosan
solutions. Korea-Aust. Rheol. J. 2000, 12 (3/4), 175–179.
Received for review October 25, 2007. Revised manuscript received
March 5, 2008. Accepted April 16, 2008. This research was supported
by USDA NRI Grant 2005-35503-15428 and Hatch funds from the
Tennessee Experiment Station TEN264.
JF073136Q