INTERNET TRENDS 2017 – CODE CONFERENCE
Bạn đang xem bản rút gọn của tài liệu. Xem và tải ngay bản đầy đủ của tài liệu tại đây (13.75 MB, 355 trang )
INTERNET TRENDS 2017 –
CODE CONFERENCE
Mary Meeker
May 31, 2017
kpcb.com/InternetTrends
Internet Trends 2017
1)
Global Internet Trends = Solid…Slowing Smartphone Growth
2)
Online Advertising (+ Commerce) = Increasingly Measurable + Actionable
3)
Interactive Games = Motherlode of Tech Product Innovation + Modern Learning
4)
Media = Distribution Disruption @ Torrid Pace
151-177
5)
The Cloud = Accelerating Change Across Enterprises
178-192
6)
China Internet = Golden Age of Entertainment + Transportation
193-231
4-9
10-79
80-150
(Provided by Hillhouse Capital)
7)
India Internet = Competition Continues to Intensify…Consumers Winning
232-287
8)
Healthcare @ Digital Inflection Point
288-319
9)
Global Public / Private Internet Companies…
320-333
10) Some Macro Thoughts…
334-351
11) Closing Thoughts…
352-353
KP INTERNET TRENDS 2017 | PAGE 2
Thanks...
Kleiner Perkins Partners
Alexander Krey & Ansel Parikh - who were fearless and sometimes sleepless - helped
steer the ideas / presentation we hope you find useful / learn from / improve on. Key
contributors to specific content include: Noah Knauf & Nina Lu (Healthcare), Bing Gordon
(Interactive Games), Alex Tran & Anjney Midha (India), Daegwon Chae (Ads +
Commerce) and Alex Kurland & Lucas Swisher (Enterprise). In addition, Mood Rowghani,
Eric Feng, Daniel Axelsen, Dino Becirovic and Shabih Rizvi were more than on call with
help.
Hillhouse Capital
Especially Liang Wu…his / their contribution of the China sector of Internet Trends
provides an especially thoughtful overview of the largest market of Internet users in the
world…
Participants in Evolution of Internet Connectivity
From creators to consumers who keep us on our toes 24x7...and the people who directly
help us prepare this presentation...
Kara & Walt
For continuing to do what you do so well...
KP INTERNET TRENDS 2017 | PAGE 3
GLOBAL INTERNET TRENDS =
SOLID USER GROWTH…
SLOWING SMARTPHONE GROWTH
KP INTERNET TRENDS 2017 | PAGE 4
Global Internet Trends =
Solid User Growth…Slowing Smartphone Growth
1) Global Internet Users = 3.4B…Flat Growth +10% vs. 10% Y/Y…
+8% vs. 8% Y/Y (ex. India)
2) Global Smartphone Shipments = Slowing +3% vs. +10% Y/Y
3) Global Smartphone Installed Base = Slowing +12% vs. +25% Y/Y
4) USA Internet Usage (Engagement) = Solid +4% Y/Y
KP INTERNET TRENDS 2017 | PAGE 5
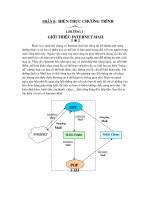
Global Internet Users = 3.4B @ 46% Penetration...
+10% Y/Y vs. +10%...+8% Y/Y vs. +8% (Ex-India)
4,000
35%
3,500
30%
3,000
25%
2,500
20%
2,000
15%
1,500
Y/Y % Growth
Global Internet Users (MM)
Global Internet Users (MM), 2009 – 2016
10%
1,000
500
5%
0
0%
2009
2010
2011
2012
Global Internet Users (MM)
2013
2014
2015
2016
Y/Y Growth (%)
Source: United Nations / International Telecommunications Union, US Census Bureau. Internet user data is as of mid-year. Internet user data for:
USA from Pew Research, China from CNNIC, Iran from Islamic Republic News Agency / InternetWorldStats / KPCB estimates, India from KPCB
estimates based on IAMAI data, Indonesia from APJII.
KP INTERNET TRENDS 2017 | PAGE 6
Global Smartphone Unit Shipments = Continue to Slow...
@ +3% Y/Y vs. +10% (2015) / +28% (2014)
1,500
100%
1,200
80%
900
60%
600
40%
300
20%
0
Y/Y Growth (%)
Global Smartphone Unit Shipments (MM)
Smartphone Unit Shipments by Operating System (MM), Global, 2009 – 2016
0%
2009
2010
2011
Android
2012
iOS
2013
Other
2014
2015
2016
Y/Y Growth
Source: Morgan Stanley Research (5/17)
KP INTERNET TRENDS 2017 | PAGE 7
Global Smartphone Installed Base = 2.8B…
+12% Y/Y vs. +25% (2015) / +37% (2014)
3,500
70%
3,000
60%
2,500
50%
2,000
40%
1,500
30%
1,000
20%
500
10%
0
Y/Y % Growth
Global Smartphone Installed Base (MM)
Global Smartphone Installed Base (MM), 2009 – 2016
0%
2009
2010
2011
2012
2013
Global Smartphone Installed Base (MM)
2014
2015
2016
Y/Y Growth (%)
Source: Morgan Stanley Research (5/17)
Note: Owing to use of different source, prior period data may have slight adjustments vs prior reports. Smartphone installed base based on
preceding 8 quarters of smartphone shipments.
KP INTERNET TRENDS 2017 | PAGE 8
Internet Usage (Engagement) = Solid Growth…+4% Y/Y…
Mobile >3 Hours / Day per User vs. <1 Five Years Ago, USA
Time Spent per Adult User per Day with Digital Media, USA,
2008 – 2016
6
5.4
4.9
5
5.6
5.1
Hours per Day
4.3
4
3
3.7
2.7
0.3
3.0
0.3
3.2
0.4
1.6
2.3
2.6
2.8
3.1
0.8
2
2.2
2.3
2.4
2.6
2.5
2.3
2.2
2.2
2.2
0.2
0.3
0.4
0.3
0.3
0.3
0.3
0.4
0.4
2008
2009
2010
2011
2012
2013
2014
2015
2016
1
0
Other Connected Devices
Desktop / Laptop
Mobile
Source: eMarketer 9/14 (2008-2010), eMarketer 4/15 (2011-2013), eMarketer 4/17 (2014-2016). Note: Other connected devices include OTT and
game consoles. Mobile includes smartphone and tablet. Usage includes both home and work. Ages 18+; time spent with each medium includes
all time spent with that medium, regardless of multitasking.
KP INTERNET TRENDS 2017 | PAGE 9
ONLINE ADVERTISING (+ COMMERCE) =
INCREASINGLY
MEASURABLE + ACTIONABLE
KP INTERNET TRENDS 2017 | PAGE 10
Ad Growth =
Driven by Mobile
KP INTERNET TRENDS 2017 | PAGE 11
Online Advertising = Growth Accelerating, +22% vs. +20% Y/Y...
Mobile $ > Desktop (2016) on Higher Growth, USA
USA Internet Advertising ($B), 2009 – 2016
$80
40%
$70
35%
$60
$60
30%
$50
$50
25%
$43
$37
$40
$26
$30
20%
$32
15%
% Y/Y Growth
USA Internet Advertising ($B)
$73
$23
$20
10%
$10
5%
$0
0%
2009
2010
2011
Desktop Advertising
2012
2013
2014
Mobile Advertising
2015
2016
Y/Y Growth
Source: IAB / PWC Internet Advertising Report (2016)
KP INTERNET TRENDS 2017 | PAGE 12
Advertising $ =
Shift to Usage (Mobile) Continues
% of Time Spent in Media vs. % of Advertising Spending, USA, 2016
% of Total Media Consumption Time
or Advertising Spending
Time Spent
Ad Spend
50%
Total
Of Which
Internet Ad Mobile Ad
= $73B
40%
= $37B
38% 38%
30%
28%
~$16B
20%
20% 20%
10%
Opportunity
in USA
12%
9%
0%
21%
9%
4%
Radio
TV
Internet
Source: Internet and Mobile advertising spend based on IAB and PwC data for full year 2016. Print, Radio, and TV advertising spend based on
Magna Global estimates for full year 2016. Print includes newspaper and magazine. Internet (IAB) includes desktop + laptop + other connected
devices. ~$16B opportunity calculated assuming Mobile (IAB) ad spend share equal its respective time spent share. Time spent share data
based on eMarketer (4/17). Arrows denote Y/Y shift in percent share. Excludes out-of-home, video game, and cinema advertising.
Mobile
KP INTERNET TRENDS 2017 | PAGE 13
Advertising $ =
Internet > TV Within 6 Months, Global
Internet vs. TV Ad Spend ($B), Global, 1995-2017E
Global Advertising Spend ($B)
$250
$200
$150
$100
$50
$0
Global Internet Ad Spend
Global TV Ad Spend
Source: Zenith Advertising Expenditure Forecasts (3/17)
KP INTERNET TRENDS 2017 | PAGE 14
Google + Facebook =
85% (& Rising) Share of Internet Advertising Growth, USA
Advertising Revenue ($B) and Growth Rates (%) of
Google vs. Facebook vs. Other, USA, 2015 – 2016
50,000
$50
45,000
$45
40,000
$40
35,000
30,000
25,000
20,000
15,000
USA Advertising Revenue ($B)
+20% Y/Y
$35
$30
+9% Y/Y
$25
+62% Y/Y
$20
$15
10,000
$10
$5,000
$5
$0
$
2015
2016
2015
2016
Source: IAB / PWC Advertising Report (2016), Facebook, Morgan Stanley Research
Note: Facebook revenue includes Canada. Google USA ad revenue per Morgan Stanley estimates as company only discloses total ad revenue
and total USA revenue. “Others” includes all other USA internet (mobile + desktop) advertising revenue ex-Google / Facebook.
2015
2016
Others
KP INTERNET TRENDS 2017 | PAGE 15
Ad Measurability =
Can Be Triple-Edged…
When Things Are Measured =
People Don’t Always Like What They See…
Users Don’t Always Like Data Collected
KP INTERNET TRENDS 2017 | PAGE 16
Advertisers = Like Measurable Engagement Metrics But…
Some Find Measuring ROI Challenging (as with Offline)
Social Advertisers
Social Media Marketing
Metrics Used to Measure Success, 6/16
Top Challenges, 6/16
70%
70%
61%
60%
56%
50%
50%
% of Respondents
% of Respondents
60%
40%
30%
21%
20%
15%
34%
30%
20%
10%
10%
0%
0%
Engagement Conversion Amplification
& Revenue
& Brand
Awareness
Source: SimplyMeasured State of Social Marketing Annual Report (6/16)
Note: Based on a survey of social media advertisers, n=350.
38%
40%
Measuring
ROI
Securing Tying Social
Budget &
Campaigns
Resources to Business
Goals
KP INTERNET TRENDS 2017 | PAGE 17
Ad Blocking = Growth Continues…Especially in Developing Markets…
Users Increasingly Opt Out of Stuff They Don’t Want
Adblocking Users on Web
(Mobile + Desktop), Global, 4/09 – 12/16
Adblocking Penetration
(Mobile + Desktop), Selected
Countries, 12/16
400
Global Adblocking Users (MM)
Country
300
200
100
0
2009 2010 2011 2012 2013 2014 2015 2016
Desktop Adblocking Software Users
Mobile Adblocking Browser Users
Desktop
Mobile
China
1%
13%
India
1%
28%
USA
18%
1%
Brazil
6%
1%
Japan
3%
--
Russia
6%
3%
Germany
28%
1%
Indonesia
8%
58%
UK
16%
1%
France
11%
1%
Canada
24%
--
Source: PageFair 2015, 2017 reports. These two data sets have not been de-duplicated. The number of desktop adblockers after 1/16 are estimates based on the
observed trend in desktop adblocking and provided by PageFair. Note that mobile adblocking refers to web / browser-based adblocking and not in-app adblocking.
Desktop adblocking estimates are for global monthly active users of desktop adblocking software between 4/09 – 12/16, as calculated in the PageFair’s 2015 and 2017
reports. Mobile adblocking estimates are for global monthly active users of mobile browsers that block ads by default between 9/14 – 12/16, including the number of
Digicel subscribers in the Caribbean (added 10/15), as calculated in the PageFair & Priori Data 2016 and PageFair 2017 Adblocking Report.
KP INTERNET TRENDS 2017 | PAGE 18
Leading Platform Ad Offerings =
Rapidly Improving with
Back-End Data +
Front-End Measurement Tools +
Targeted Delivery of Ads
Users Increasingly Want
KP INTERNET TRENDS 2017 | PAGE 19
Leading Online Ad Platforms =
Providing More Ways to Target + Measure Ads
Facebook (Delivery Insights)
Google (AdWords)
Snap (Snap Ads)
Source: Facebook, Google, Snap
KP INTERNET TRENDS 2017 | PAGE 20
Product Listing Ads (Google) =
Driving Clicks to Product Pages
Google Product Listing Ads (PLAs)
Share of Retail Paid Clicks on Google, USA, 2014-2016
Google PLA on Mobile Web,
12/16
PLA Share of Retail Paid Clicks on Google (%)
60%
52%
50%
40%
30%
29%
20%
10%
0%
Source: Merkle Digital Marketing Report (Q1:14-Q1:17), Right image: Search Engine Land
KP INTERNET TRENDS 2017 | PAGE 21
Targeted Pins (Pinterest) =
Driving Product Discovery + Purchase
Shop the Look
Browsing Turning into Buying, 4/17
Inspired Purchases, 2/17
Which of these services is a
great place to browse for
things you might want to buy?
Which of these services is a
great place to buy things online?
50%
44%
45%
% of Respondents
40%
35%
33%
30%
24%
25%
20%
15%
12%
10%
5%
0%
Browse
Buy
4/15
4/17
Source: Pinterest
Note: Based on an internal survey of global internet users, n=12K. Other answers to the questions include Facebook, Instagram, Twitter, Snap,
YouTube, and Google with each respondent only allowed to choose one option.
KP INTERNET TRENDS 2017 | PAGE 22
Contextual Ads (Facebook) =
Driving Direct Purchases
Facebook Users
Facebook Messenger
26% that Click Ads Make Purchase, USA, 3/17
Conversational Transactions,
9/16
In past 30 days, have you clicked an ad on Facebook?
In past 30 days, have you purchased a product you saw
on Facebook?
100%
90%
% of Respondents
80%
70%
60%
74%
93%
90%
7%
10%
Didn’t Click on Ad
Not Sure
50%
40%
30%
20%
10%
26%
0%
Clicked on an Ad
Made a Purchase
Did Not Make a Purchase
Source: Survata (4/17), Messenger Image: Facebook Blog (9/16)
Note: Based on survey of USA internet users, n=1,500 (3/17).
KP INTERNET TRENDS 2017 | PAGE 23
Goal Based Bidding Ads (Snap) =
Driving User Action
Snap / Gatorade Ad Campaign
Users Swipe Through Ad to Web Game, 8/16
Users Spend Average of 196 Seconds Playing Game
Source: Snap Case Study: Gatorade (8/16)
KP INTERNET TRENDS 2017 | PAGE 24
Geo-Targeted Local Ads (Google) =
Driving Foot Traffic to Stores
Google Location-Tagged Ads
99% Accuracy Tracking Visits to 200MM Stores Globally, 9/16
5B Cumulative Tracked Store Visits, Up 5x Y/Y*, 5/17
Source: Google Adwords Blog (5/16, 9/16, 5/17), Image: Google Adwords Blog (9/16)
* 5B (5/17) vs. 1B cumulative tracked (5/16).
KP INTERNET TRENDS 2017 | PAGE 25