KINH TẾ VI MÔ Chapter 2 demand supply
Bạn đang xem bản rút gọn của tài liệu. Xem và tải ngay bản đầy đủ của tài liệu tại đây (7.35 MB, 79 trang )
CHAPTER 2
THE BASICS
OF DEMAND
& SUPPLY
Supply and demand model
The
supply and demand model is a
model of how a competitive market
works.
Five
key elements:
◦ Demand curve
◦ Supply curve
◦ Demand and supply curve shifts
◦ Market equilibrium
◦ Changes in the market equilibrium
Demand
1.
2.
3.
4.
5.
Key definitions
The law of demand
Illustrating demand
Determinants of demand
Distinguishing moving along demand
curve and demand shifting
Demand
1.
-
Key Definitions
Demand illustrates the amounts of
commodity that buyers are willing and
can afford to buy at different prices in a
certain period of time given everything
else held constant
ü Demand versus Need?
- Quantity demanded is the amount of
commodity that buyers are willing and can
afford to buy at a certain price during a period
of time given everything else held constant.
è Demand captures the whole relationship
between price and quantity demanded.
- Individual demand: the demand of a single
consumer.
- Market demand: the sum of the quantity
demanded for each individual buyer at each
price
DEMAND
2. The law of demand
Given everything else held constant, the
quantity demanded of a good will increase
when the price decrease, and vice versa.
Ceteris Paribus
P é QDê
P ê QDé
3. Illustrating demand
- Demand schedule
- Demand curve
- Demand function
Demand Schedule
A demand
schedule shows
how much of a
good or service
consumers will
want to buy at
different prices.
Demand Schedule for Cotton
Price of cotton
(per pound)
Quantity of cotton
demanded
(billions of pounds)
$2.00
7.1
1.75
7.5
1.50
8.1
1.25
8.9
1.00
10.0
0.75
11.5
0.50
14.2
Demand Curve
Price of
cotton
(per pound)
A demand curve is the graphical
representation of the demand
schedule.
It shows how much of a good or
service consumers want to buy
at any given price.
$2.00
1.75
1.50
1.25
1.00
0.75
0.50
0
As price rises,
the quantity
demanded falls
7
9
Demand
curve, D
11
13
15
17
Quantity of cotton
(billions of pounds)
-
Demand function is a mathematical
representation of the relationship between
quantity demanded and demand determinants.
QD = f( P, Py, I, T, E, N)
Where
QD : Quantity demanded
P : Price of the commodity
Py : Price of related commodities
I
: Income
E : Expectations
N : Number of buyers
Demand function
Other things being equal, the demand
function can be simplified as follows:
Q = f (P)
If the relationship between quantity
demanded and price is linear:
Q = aP + b ( a<0)
A change in quantity demanded vs. a
change in demand
When price changes, P
quantity demanded will
change sequentially.
P1
However demand, as
the relationship between P2
price and quantity
demanded, will not
change.
0
Thus the demand curve
remains at the same
position.
A
B
D
Q1
Q2
Q
What Causes a Demand Curve to
Shift?
Changes in the non-price factors (exogenous
factors): price of related goods, income,
expectation, taste, number of buyers è the
whole demand function changes
Movement along demand curve vs. demand
shift
Other factors are
exogenous.
Leading to the shift
of demand curve
Eg: An increase in
price of substitute
results in the increase
of demand.
P
D
0
D’
Q
A change in Demand
An increase in
population generate
an increase in
demand.
This is represented
by the two demand
schedules—one
showing demand in
2007, before the rise
in population, the
other showing
demand in 2010,
after the rise in
population.
Demand Schedules for Cotton
Price of cotton
(per pound)
Quantity of cotton
demanded
(billions of
pounds)
in 2007
in 2010
$2.00
1.75
7.1
8.5
7.5
9.0
1.50
8.1
9.7
1.25
8.9
10.0
10.7
12.0
11.5
13.8
14.2
17.0
1.00
0.75
0.50
An change in Demand
Price of
cotton
(per pound)
$2.00
Increase in
population à
more cotton
clothing users
1.75
Demand curve
in 2010
1.50
1.25
1.00
0.75
0.50
0
Demand curve in
2007
7
9
D
11
13
1
15
D
2
17
Quantity of cotton
(billions of pounds)
A shift of the demand curve is a change in the quantity demanded at any
given price, represented by the change of the original demand curve to
a new position, denoted by a new demand curve.
Movement Along the Demand Curve
A movement along the demand curve is a change in
the quantity demanded of a good that is the result of a
change in that good’s price.
Price of
cotton
(per
pound)
A shift of the
demand curve…
$2.00
1.75
A
1.50
… is not the same thing
as a movement along the
demand curve
C
1.25
B
1.00
0.75
0.50
0
D
7
8.1
9.7
10
13
1
15
D
2
17
Quantity of cotton
(billions of pounds)
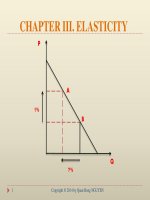
Shifts of the Demand Curve
Price
Increase
in
demand
A “decrease
in demand”
An “increase
in
means
a leftward
shift
demand”
means
a of
the demand
rightward
shiftcurve:
of the
atdemand
any given
price,
curve:
consumers
demand
at any given
price, a
smaller quantity
thana
consumers
demand
larger before.
quantity than
(D1àD3)
before.
(D1àD2)
Decrease
in demand
D
3
D
1
D
2
Quantity
DETERMINANTS CAUSING SHIFTS
DEMAND
Price of Substitute
Two commodities are substitute if we can
use either of them to achieve the same
purpose.
Impact of the price of substitutes on
demand
PY ↑⇒ QDY ↓⇒ QDX ↑
PY ↓⇒ QDY ↑⇒ QDX ↓
DETERMINANTS OF DEMAND
Price of Complement
Two goods are complements if they are
necessarily consumed together to
guarantee their usefulness.
Impact
PY ↑⇒ QDY ↓⇒ QDX ↓
PY ↓⇒ QDY ↑⇒ QDX ↑
DETERMINANTS OF DEMAND
Income
Normal goods
I ↑⇒ QD ↑
I ↓⇒ QD ↓
Inferior
€
goods
I ↑⇒ QD ↓
I ↓⇒ QD ↑
Ernst
Engel : At different income levels,
consumers have different perspectives toward
the same goods.
I
I2
Inferior goods
I0
I1
Normal goods
0
Q2
Q1
Q0
Q
Determinants of demand
Tastes
Tastes are consumers’ preferences towards
goods.
Tastes depend on:
v Age
v Gender
v Convention and customs
v Time
Determinants of Demand
Expectations
Expectations about future income or
prices will affect the demand for a good
today
Expectation of an increase in price =>
Current Demand Increases.
Expectation of an decrease in price =>
Current Demand Decreases.
Expectation of an increase in income è
Current demand increases.
DETERMINANTS OF DEMAND
4.5 Number of buyers
N ↑⇒ QD ↑
N ↓⇒ QD ↓