Economics principles tools and applications 9th by sullivan sheffrin perez chapter 23
Bạn đang xem bản rút gọn của tài liệu. Xem và tải ngay bản đầy đủ của tài liệu tại đây (681.43 KB, 32 trang )
Economics
NINTH EDITION
Chapter 23
Production Technology
and Cost
Copyright © 2015, 2012, 2009 Pearson Education, Inc. All Rights Reserved
Learning Objectives
23.1 Define economic cost and economic profit.
23.2 Draw the short-run marginal-cost and average-cost curves.
23.3 Draw the long-run marginal-cost and average cost curves.
23.4 Provide examples of production costs.
Copyright © 2015, 2012, 2009 Pearson Education, Inc. All Rights Reserved
23.1 ECONOMIC COST AND ECONOMIC PROFIT (1 of 4)
•
Economic profit
Total revenue minus economic cost.
Economic profit = total revenue – economic cost
•
Economic cost
The opportunity cost of the inputs used in the production process; equal to explicit cost plus implicit cost.
PRINCIPLE OF OPPORTUNITY COST
The opportunity cost of something is what you sacrifice to get it.
Copyright © 2015, 2012, 2009 Pearson Education, Inc. All Rights Reserved
23.1 ECONOMIC COST AND ECONOMIC PROFIT (2 of 4)
TABLE 23.1 Economic Cost versus Accounting Cost
Explicit: monetary payments for labour, capital, materials
$10,000
$10,000
5,000
-
Implicit: opportunity cost of funds
2,000
-
17,000
10,000
Explicit cost
A monetary payment.
•
Accounting Cost
Implicit: opportunity cost of entrepreneur’s time
Total
•
Economic Cost
Implicit cost
An opportunity cost that does not involve a monetary payment.
Copyright © 2015, 2012, 2009 Pearson Education, Inc. All Rights Reserved
APPLICATION 1 23.1 ECONOMIC COST AND ECONOMIC PROFIT (3 of 4)
OPPORTUNITY COST AND ENTREPENEURSHIP
APPLYING THE CONCEPTS #1: What is the opportunity cost of an entrepreneur?
•
For many workers, participating in the sharing economy as a driver for Uber or Lyft, is an attractive way to earn an income.
•
The cost of driving for Uber includes the opportunity cost of time diverted from working at a regular job. If a regular job pays $3,000 per month, that’s only
part of the opportunity cost. In addition, many regular jobs have benefits uch as paid sick leave, vacation days an subsidized health insurance.
•
Driving for Uber does not provide these benefits. A worker who switches from a regular job to Uber will sacrifice more than the $3,000 salary.
Copyright © 2015, 2012, 2009 Pearson Education, Inc. All Rights Reserved
23.1 ECONOMIC COST AND ECONOMIC PROFIT (4 of 4)
Economic cost = explicit cost + implicit cost
Accounting cost = explicit cost
•
•
•
•
Accounting cost
The explicit costs of production.
Accounting profit
Total revenue minus accounting cost.
Accounting profit = total revenue − accounting cost
Copyright © 2015, 2012, 2009 Pearson Education, Inc. All Rights Reserved
23.2 A FIRM WITH A FIXED PRODUCTION FACILITY: SHORT-RUN COSTS (1
of 10)
Production and Marginal Product
•
Marginal product of labor
The change in output from one additional unit of labor.
•
Diminishing returns
As one input increases while the other inputs are held fixed, output increases at a decreasing rate.
PRINCIPLE OF DIMINISHING RETURNS
Suppose output is produced with two or more inputs, and we increase one input while holding the other input or inputs fixed. Beyond some point—
called the point of diminishing returns—output will increase at a decreasing rate.
Copyright © 2015, 2012, 2009 Pearson Education, Inc. All Rights Reserved
23.2 A FIRM WITH A FIXED PRODUCTION FACILITY: SHORT-RUN COSTS (2
of 10)
Production and Marginal Product
•
Total-product curve
A curve showing the relationship between the quantity of labor and the quantity of output produced, ceteris paribus.
Copyright © 2015, 2012, 2009 Pearson Education, Inc. All Rights Reserved
23.2 A FIRM WITH A FIXED PRODUCTION FACILITY: SHORT-RUN COSTS (3
of 10)
Production and Marginal Product
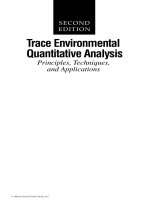
The total-product curve shows the relationship between the quantity
of labor and the quantity of output, given a fixed production facility.
For the first two workers, output increases at an increasing rate
because of labor specialization.
Diminishing returns occurs for three or more workers, so output
increases at a decreasing rate.
Copyright © 2015, 2012, 2009 Pearson Education, Inc. All Rights Reserved
23.2 A FIRM WITH A FIXED PRODUCTION FACILITY: SHORT-RUN COSTS (4
of 10)
Short-Run Total Cost
•
Fixed cost (FC)
Cost that does not vary with the quantity produced.
•
Variable cost (VC)
Cost that varies with the quantity produced.
•
Short-run total cost (TC)
The total cost of production when at least one input is fixed; equal to fixed cost plus variable cost.
Copyright © 2015, 2012, 2009 Pearson Education, Inc. All Rights Reserved
23.2 A FIRM WITH A FIXED PRODUCTION FACILITY: SHORT-RUN COSTS (5
of 10)
Short-Run Total Cost
TABLE 23.2 Short – Run Costs
1
2
3
4
5
6
7
8
9
Labour
Output
Fixed Cost
Variable Cost
Total Cost
Average Fixed
Average Variable
Average Total
Marginal Cost
(FC)
(VC)
(TC)
Cost (AFC)
Cost (AVC)
Cost (ATC)
(MC)
0
0
$100
$0
$ 100
-
-
-
-
1
1
100
$ 50
150
$ 100.00
$ 50.00
$ 150.00
$50.00
2
5
100
100
200
20.00
20.00
40.00
12.50
3
8
100
150
250
12.50
18.75
31.25
16.67
4
10
100
200
300
10.00
20.00
30.00
25.00
5
11
100
250
350
9.09
22.73
31.82
50.00
6
11.5
100
300
400
8.70
26.09
34.78
100.00
The short-run total-cost curve shows the relationship between the quantity of
output and production costs, given a fixed production facility. Short-run total
cost equals fixed cost (the cost that does not vary with the quantity produced)
plus variable cost (the cost that varies with the quantity produced).
Copyright © 2015, 2012, 2009 Pearson Education, Inc. All Rights Reserved
23.2 A FIRM WITH A FIXED PRODUCTION FACILITY: SHORT-RUN COSTS (6
of 10)
Short-Run Average Costs
•
Average fixed cost (AFC)
Fixed cost divided by the quantity produced.
•
Average variable cost (AVC)
Variable cost divided by the quantity produced.
Copyright © 2015, 2012, 2009 Pearson Education, Inc. All Rights Reserved
23.2 A FIRM WITH A FIXED PRODUCTION FACILITY: SHORT-RUN COSTS (7
of 10)
Short-Run Average Costs
The short-run average-total-cost curve (ATC) is U-shaped.
As the quantity produced increases, fixed costs are spread over more and
more units, pushing down the average total cost.
In contrast, as the quantity increases, diminishing returns eventually pulls up
the average total cost.
The gap between ATC and AVC is the average fixed cost (AFC).
Copyright © 2015, 2012, 2009 Pearson Education, Inc. All Rights Reserved
23.2 A FIRM WITH A FIXED PRODUCTION FACILITY: SHORT-RUN COSTS (8
of 10)
Short-Run Average Costs
•
Short-run average total cost (ATC)
Short-run total cost divided by the quantity produced; equal to AFC plus AVC.
Copyright © 2015, 2012, 2009 Pearson Education, Inc. All Rights Reserved
23.2 A FIRM WITH A FIXED PRODUCTION FACILITY: SHORT-RUN COSTS (9
of 10)
Short-Run Marginal Cost
•
Short-run marginal cost (MC)
The change in short-run total cost resulting from a one-unit increase in output.
Copyright © 2015, 2012, 2009 Pearson Education, Inc. All Rights Reserved
23.2 A FIRM WITH A FIXED PRODUCTION FACILITY: SHORT-RUN COSTS
(10 of 10)
The Relationship between Marginal Cost and
Average Cost
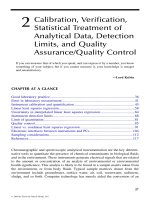
The marginal-cost curve (MC) is negatively sloped for small quantities
of output, because of the benefits of labor specialization, and positively
sloped for large quantities, because of diminishing returns.
The MC curve intersects the average-cost curve (ATC) at the minimum
point of the average curve.
At this point ATC is neither falling nor rising.
Copyright © 2015, 2012, 2009 Pearson Education, Inc. All Rights Reserved
APPLICATION 2
THE RISING MARGINAL COST O CRUD OIL
APPLYING THE CONCEPTS #2: Why is the marginal-cost curve positively sloped?
• For the first 40 million barrels per day, the marginal cost is less than $10 per barrel.
• The marginal cost increases to roughly $20 per barrel for 65 million barrels per day.
• The marginal cost increase rapidly to roughly $80 per barrel for 75 million barrels per day, the quantity produced in early 2015.
• The marginal cost curve reflects variation in the cost of extracting oil from different sources. The marginal cost is relatively low for nations in the Middle East
and Russia. It is in the intermediate range for the North Sea, oil sands in Canada and offshore in the U.S. The marginal cost is high for oil from the Arctic,
biodiesel, and ethanol.
Copyright © 2015, 2012, 2009 Pearson Education, Inc. All Rights Reserved
23.3 PRODUCTION AND COST IN THE LONG RUN (1 of 8)
Expansion and Replication
•
Long-run total cost (LTC)
The total cost of production when a firm is perfectly flexible in choosing its inputs.
•
Long-run average cost (LAC)
The long-run cost divided by the quantity produced.
Copyright © 2015, 2012, 2009 Pearson Education, Inc. All Rights Reserved
23.3 PRODUCTION AND COST IN THE LONG RUN (2 of 8)
Expansion and Replication
•
Constant returns to scale
A situation in which the long-run total cost increases proportionately with output, so average cost is constant.
•
Long-run marginal cost (LMC)
The change in long-run cost resulting from a one-unit increase in output.
Copyright © 2015, 2012, 2009 Pearson Education, Inc. All Rights Reserved
23.3 PRODUCTION AND COST IN THE LONG RUN (3 of 8)
Expansion and Replication
The long-run average-cost curve (LAC) is negatively sloped for up to 10
paddles per day, a result of indivisible inputs and the effects of labor
specialization.
If the firm replicates the operation that produces 10 paddles per day, the
long run average-cost curve will be horizontal beyond 10 paddles per
day.
Copyright © 2015, 2012, 2009 Pearson Education, Inc. All Rights Reserved
23.3 PRODUCTION AND COST IN THE LONG RUN (4 of 8)
Reducing Output with Indivisible Inputs
•
Indivisible input
An input that cannot be scaled down to produce a smaller quantity of output.
Copyright © 2015, 2012, 2009 Pearson Education, Inc. All Rights Reserved
23.3 PRODUCTION AND COST IN THE LONG RUN (5 of 8)
Scaling Down and Labor Specialization
•
Labor specialization makes workers more productive because of continuity and repetition.
•
When we reduce the workforce each worker will become less specialized, performing a wider variety of production tasks.
•
The loss of specialization will decrease labor productivity, leading to higher average cost.
Copyright © 2015, 2012, 2009 Pearson Education, Inc. All Rights Reserved
23.3 PRODUCTION AND COST IN THE LONG RUN (6 of 8)
Economies of Scale
•
Economies of scale
A situation in which the long-run average cost of production decreases as output increases.
•
Minimum efficient scale
The output at which scale economies are exhausted.
Copyright © 2015, 2012, 2009 Pearson Education, Inc. All Rights Reserved
23.3 PRODUCTION AND COST IN THE LONG RUN (7 of 8)
Diseconomies of Scale
•
Diseconomies of scale
A situation in which the long-run average cost of production increases as output increases.
Copyright © 2015, 2012, 2009 Pearson Education, Inc. All Rights Reserved
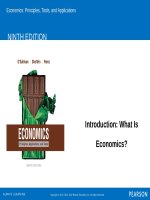
▼FIGURE 23.6
Actual Long-Run Average-Cost Curves for Aluminum, Truck Freight, and Hospital Services
Copyright © 2015, 2012, 2009 Pearson Education, Inc. All Rights Reserved