3D reconstruction of long bones utilising magnetic resonance imaging (MRI)
Bạn đang xem bản rút gọn của tài liệu. Xem và tải ngay bản đầy đủ của tài liệu tại đây (7.28 MB, 179 trang )
3D Reconstruction of Long Bones
Utilising Magnetic Resonance Imaging
(MRI)
Thesis submitted by
Kanchana Rathnayaka
Rathnayaka Mudiyanselage
MBBS
This thesis is submitted in fulfilment of the requirements for the
degree of Doctor of Philosophy
Institute of Health and Biomedical Innovation
School of Engineering Systems
Faculty of Built Environment and Engineering
Queensland University of Technology
Brisbane, Australia
2011
Abstract
Abstract
The design of pre-contoured fracture fixation implants (plates and nails) that
correctly fit the anatomy of a patient utilises 3D models of long bones with accurate
geometric representation. 3D data is usually available from computed tomography
(CT) scans of human cadavers that generally represent the above 60 year old age
group. Thus, despite the fact that half of the seriously injured population comes from
the 30 year age group and below, virtually no data exists from these younger age
groups to inform the design of implants that optimally fit patients from these groups.
Hence, relevant bone data from these age groups is required. The current gold
standard for acquiring such data–CT–involves ionising radiation and cannot be used
to scan healthy human volunteers. Magnetic resonance imaging (MRI) has been
shown to be a potential alternative in the previous studies conducted using small
bones (tarsal bones) and parts of the long bones. However, in order to use MRI
effectively for 3D reconstruction of human long bones, further validations using long
bones and appropriate reference standards are required.
Accurate reconstruction of 3D models from CT or MRI data sets requires an accurate
image segmentation method. Currently available sophisticated segmentation methods
involve complex programming and mathematics that researchers are not trained to
perform. Therefore, an accurate but relatively simple segmentation method is
required for segmentation of CT and MRI data. Furthermore, some of the limitations
of 1.5T MRI such as very long scanning times and poor contrast in articular regions
can potentially be reduced by using higher field 3T MRI imaging. However, a
quantification of the signal to noise ratio (SNR) gain at the bone - soft tissue
interface should be performed; this is not reported in the literature. As MRI scanning
of long bones has very long scanning times, the acquired images are more prone to
motion artefacts due to random movements of the subject‟s limbs. One of the
artefacts observed is the step artefact that is believed to occur from the random
movements of the volunteer during a scan. This needs to be corrected before the
models can be used for implant design.
As the first aim, this study investigated two segmentation methods: intensity
thresholding and Canny edge detection as accurate but simple segmentation methods
for segmentation of MRI and CT data. The second aim was to investigate the
III
Abstract
usability of MRI as a radiation free imaging alternative to CT for reconstruction of
3D models of long bones. The third aim was to use 3T MRI to improve the poor
contrast in articular regions and long scanning times of current MRI. The fourth and
final aim was to minimise the step artefact using 3D modelling techniques.
The segmentation methods were investigated using CT scans of five ovine femora.
The single level thresholding was performed using a visually selected threshold level
to segment the complete femur. For multilevel thresholding, multiple threshold levels
calculated from the threshold selection method were used for the proximal,
diaphyseal and distal regions of the femur. Canny edge detection was used by
delineating the outer and inner contour of 2D images and then combining them to
generate the 3D model. Models generated from these methods were compared to the
reference standard generated using the mechanical contact scans of the denuded
bone. The second aim was achieved using CT and MRI scans of five ovine femora
and segmenting them using the multilevel threshold method. A surface geometric
comparison was conducted between CT based, MRI based and reference models. To
quantitatively compare the 1.5T images to the 3T MRI images, the right lower limbs
of five healthy volunteers were scanned using scanners from the same manufacturer.
The images obtained using the identical protocols were compared by means of SNR
and contrast to noise ratio (CNR) of muscle, bone marrow and bone. In order to
correct the step artefact in the final 3D models, the step was simulated in five ovine
femora scanned with a 3T MRI scanner. The step was corrected using the iterative
closest point (ICP) algorithm based aligning method.
The present study demonstrated that the multi-threshold approach in combination
with the threshold selection method can generate 3D models from long bones with an
average deviation of 0.18 mm. The same was 0.24 mm of the single threshold
method. There was a significant statistical difference between the accuracy of models
generated by the two methods. In comparison, the Canny edge detection method
generated average deviation of 0.20 mm. MRI based models exhibited 0.23 mm
average deviation in comparison to the 0.18 mm average deviation of CT based
models. The differences were not statistically significant. 3T MRI improved the
contrast in the bone–muscle interfaces of most anatomical regions of femora and
tibiae, potentially improving the inaccuracies conferred by poor contrast of the
articular regions. Using the robust ICP algorithm to align the 3D surfaces, the step
IV
Abstract
artefact that occurred by the volunteer moving the leg was corrected, generating
errors of 0.32 ± 0.02 mm when compared with the reference standard.
The study concludes that magnetic resonance imaging, together with simple
multilevel thresholding segmentation, is able to produce 3D models of long bones
with accurate geometric representations. The method is, therefore, a potential
alternative to the current gold standard CT imaging.
V
Keywords
Keywords
Magnetic resonance imaging
Computed tomography
Image segmentation
3D models
Long bones
Thresholding
Edge detection
Multi thresholding
Higher field MRI
Musculoskeletal MRI
Motion artefacts
Validation
VI
Contents
Contents
Abstract
................................................................................................................. III
Keywords
................................................................................................................. VI
List of figures ............................................................................................................. XIII
List of tables ................................................................................................................ XV
Publications, presentations and awards .................................................................... XVI
Authorship
.............................................................................................................. XIX
Acknowledgement ...................................................................................................... XXI
Abbreviations ............................................................................................................ XXII
Chapter 1.
Introduction .............................................................................................. 1
Chapter 2.
Quantitative imaging of the skeletal system for 3D reconstruction
(Background) ............................................................................................ 7
2.1
Introduction ................................................................................................... 7
2.2
Computed tomography (CT) .......................................................................... 8
2.3
2.2.1
Basic principles of CT ........................................................................ 8
2.2.2
Radiation exposure during CT imaging ............................................... 9
Magnetic resonance imaging (MRI) .............................................................10
2.3.1
Basic principles of MRI .....................................................................10
2.3.2
How tissue contrast is determined ......................................................12
2.3.3
Selection of slice position and thickness ............................................13
2.3.4
Pulse sequences .................................................................................14
2.3.5
MRI safety.........................................................................................14
2.3.6
Signal to noise ratio of an MRI system...............................................14
2.3.7
Artefacts of MRI ................................................................................15
2.3.7.1
Motion artefacts ..........................................................................16
2.3.7.2
Magnetic susceptibility difference artefact ..................................16
2.3.7.3
Chemical shift ............................................................................17
VII
Contents
2.3.8
MRI for imaging of the skeletal system ............................................. 17
2.3.9
Advantages and current limitations of MRI ....................................... 18
2.4
2.3.9.1
Longer scanning times of MRI ................................................... 18
2.3.9.2
Poor contrast in certain anatomical regions ................................. 18
2.3.9.3
Non-uniformity of the external magnetic field ............................ 19
2.3.9.4
Limited accessibility .................................................................. 19
Summary ..................................................................................................... 20
Chapter 3.
Image processing and surface reconstruction ........................................ 21
3.1
Introduction ................................................................................................. 21
3.2
Acquisition of data for 3D modelling of bones ............................................. 22
3.2.1
Effect of in plane resolution and slice thickness on accuracy of
reconstructed 3D models ................................................................... 23
3.3
Image segmentation ..................................................................................... 24
3.3.1
Manual segmentation ........................................................................ 25
3.3.2
Intensity thresholding ........................................................................ 25
3.3.2.1
Selecting an appropriate threshold level...................................... 26
3.3.2.2
Multilevel thresholding .............................................................. 26
3.3.3
Edge detection ................................................................................... 28
3.3.4
Region growing ................................................................................. 28
3.3.5
Sophisticated segmentation methods.................................................. 29
3.4
Surface generation ....................................................................................... 29
3.5
Registration (aligning) and comparison of surfaces ...................................... 30
3.6
A reference standard for validating 3D models of bones ............................... 30
3.7
Aims of the study ......................................................................................... 32
3.8
Methods ....................................................................................................... 32
VIII
3.8.1
Samples ............................................................................................. 32
3.8.2
Image segmentation........................................................................... 32
Contents
3.8.3
Reference model for validation of the outer 3D models ......................33
3.8.3.1
Removal of the soft tissues from long bones ...............................33
3.8.3.2
Scanning of the bone‟s outer surface using the contact scanner ...34
3.8.3.3
Reconstruction of the 3D model from scanned surfaces ..............37
3.8.4
Reference model for validation of the medullary canal .......................39
3.8.5
Basic 3D modelling techniques using Rapidform 2006 ......................41
3.9
3.8.5.1
Registration of 3D surfaces using Rapidform 2006 .....................41
3.8.5.2
Comparison of the aligned 3D models ........................................43
3.8.5.3
Dividing the 3D models of bones into anatomical regions ...........44
Results .........................................................................................................44
3.10 Summary, discussion and conclusion ............................................................45
3.11 Paper 1: Effect of CT image segmentation methods on the accuracy of long
bone 3D reconstructions (published) .............................................................48
Chapter 4.
Application of 3D modelling techniques for orthopaedic implant design
and validation ..........................................................................................57
4.1
Introduction ..................................................................................................57
4.2
3D models for implant design and validation ................................................58
4.3
Aims of the study .........................................................................................59
4.4
Methods .......................................................................................................59
4.5
Results .........................................................................................................59
4.6
Summary, discussion and conclusion ............................................................60
4.7
Paper 2: Quantitative fit assessment of tibial nail designs using 3D computer
modelling (published) ...................................................................................61
Chapter 5.
Magnetic resonance imaging for 3D reconstruction of long bones ........67
5.1
Introduction ..................................................................................................67
5.2
Imaging of skeletal system with MRI ...........................................................68
5.3
Aims of the study .........................................................................................71
5.4
Methods .......................................................................................................71
IX
Contents
5.5
Results ......................................................................................................... 72
5.6
Summary, discussion and conclusion ........................................................... 72
5.7
Paper 3: Quantification of the accuracy of MRI generated 3D models of long
bones compared to CT generated 3D models (in press) ................................ 74
Chapter 6.
Higher field strength MRI scanning of long bones for generation of 3D
models ...................................................................................................... 83
6.1
Introduction ................................................................................................. 83
6.2
Theoretical consideration of increased SNR at 3T ........................................ 84
6.3
3T MRI for musculoskeletal system imaging ............................................... 84
6.3.1
Spin relaxation times and flip angle ................................................... 85
6.3.2
Fat suppression .................................................................................. 86
6.3.3
Magnetic susceptibility at 3T MRI..................................................... 87
6.3.4
Chemical shift at 3T .......................................................................... 87
6.3.5
MRI safety at 3T ............................................................................... 88
6.4
Aims of the study ......................................................................................... 88
6.5
Methods ....................................................................................................... 88
6.5.1
Samples ............................................................................................. 88
6.5.2
Measuring the quality of MR images ................................................. 88
6.5.3
Quantification of spin relaxation times .............................................. 90
6.5.4
Comparison of 1.5T and 3T imaging of musculoskeletal system ........ 91
6.6
Results ......................................................................................................... 93
6.7
Summary, discussion and conclusion ........................................................... 93
6.8
Paper 4: 3T MRI improves bone-soft tissue image contrast compared with
1.5T MRI (Submitted – under review).......................................................... 96
Chapter 7.
Step artefact caused by Magnetic Resonance Imaging of long bone ... 121
7.1
Introduction ............................................................................................... 121
7.2
Motion artefact of MRI .............................................................................. 122
7.3
Aims of the study ....................................................................................... 123
X
Contents
7.4
Methods .....................................................................................................123
7.5
Results .......................................................................................................124
7.6
Summary, discussion and conclusion .......................................................... 124
7.7
Paper 5: Correction of step artefact associated with MRI scanning of long
bones (Submitted – under review) .............................................................. 126
Chapter 8.
Summary, conclusion and future directions.........................................145
8.1
Summary and conclusion ............................................................................145
8.2
Future directions......................................................................................... 148
Appendix 1 Ethical approval for the study in Chapter 6.........................................151
Appendix 2 Participant information and Consent form used in Chapter 6 ............ 154
Appendix 3 Animal tissue use notification ............................................................... 157
References
................................................................................................................ 159
XI
List of figures
List of figures
Figure 2.1: Arrangement of the x-ray source, detector and the object in a CT scanner ...... 9
Figure 2.2: A spin possesses a tiny magnetic field aligned with the axis of rotation .........11
Figure 2.3: Spins aligned with the external magnetic field B0 ..........................................11
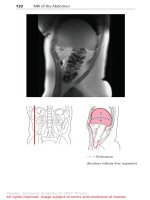
Figure 2.4: An MRI image of the coronal section of the proximal femur .........................19
Figure 2.5: The uniform regions of the external magnetic field of a MRI scanner (The
uniform region is shaded) .....................................................................................19
Figure 3.1: Average intensity values of the outer bone contours as detected by the Canny
filter for each axial CT image ...............................................................................27
Figure 3.2: The process of removing soft tissues from the sheep femur before scanning
with the contact mechanical scanner: a - gross dissection with the scalpel, ............34
Figure 3.3: Scanning of the bone's outer surface of the diaphyseal region using the MDX
20 contact scanner (The bone is positioned on the stage using glue tags)...............35
Figure 3.4: Bone is cut in three parts in order to scan the articular surfaces which cannot
be reached by the scanner on the intact bone .........................................................36
Figure 3.5: Positioning of the proximal articular segment of the femur in order to scan the
articular surface ....................................................................................................37
Figure 3.6: The reconstructed model before the scanning of articular surfaces (This model
was used as a guide to scan the articular regions) ..................................................37
Figure 3.7: Scanned surface with unusable data...............................................................38
Figure 3.8: The surface after removing the unusable data ................................................38
Figure 3.9: Two adjacent surfaces are fine registered ......................................................39
Figure 3.10: The final 3D model reconstructed by merging the surfaces ..........................39
Figure 3.11: a - The original microCT image (a cross section from the diaphysis); and b the image after applying a 20 × 20 median filter ...................................................40
XIII
List of figures
Figure 3.12: The initial aligning of the CT based 3D model to the reference model using
Trackball prior to the application of fine registration function .............................. 42
Figure 3.13: A CT based model (red) is aligned to the reference model (blue) in
Rapidform 2006 using the fine registration function ............................................. 42
Figure 3.14: Comparison of the aligned CT model to the reference model in Rapidform
2006 ..................................................................................................................... 43
Figure 3.15: Five anatomical regions used for the comparison: 1 - femoral head, 2 proximal region, 3 - diaphysis, 4 - distal region, 5 - distal articular region ............ 44
Figure 3.16: Reference planes and curves used for the splitting of the model into five
anatomical regions ............................................................................................... 44
Figure 5.1: Cross sections of CT (left) and MRI (right) from the same anatomical location
of a sample ........................................................................................................... 69
Figure 6.1: Positioning of the volunteer in the MRI scanner and the position of the matrix
coils that cover the lower limbs and the pelvis ...................................................... 92
Figure 6.2: Positioning of the field of view (FOV) on volunteer‟s leg ............................. 93
Figure 7.1: The step artefact caused by volunteer moving the leg between two successive
scanning stages................................................................................................... 121
Figure 7.2: MRI scanning of human lower limb with five scanning segments to scan the
complete limb .................................................................................................... 123
XIV
List of tables
List of tables
Table 3.1 Specifications of the MDX 20 contact 3D scanner ...........................................35
Table 3.2 Scanner parameters used for microCT scanning ...............................................40
Table 6.1 TR and TE values used for the MRI scanning at 1.5T and 3T ...........................90
Table 6.2 Different flip angles used for scanning .............................................................90
Table 6.3 The protocols used for MRI scanning ...............................................................92
XV
Publications, presentations and awards
Publications, presentations and awards
Journal Publications
1. Rathnayaka K, Schuetz MA, Sahama T & Schmutz B. Correction of step
artefact associated with MRI scanning of long bones, Submitted to Medical
Engineering and Physics.
2. Rathnayaka K, Coulthard A, Momot K, Volp A, Sahama T, Schuetz MA &
Schmutz B. 3T MRI improves bone-soft tissue image contrast compared
with 1.5T MRI, submitted to Magnetic Resonance Imaging.
3. Rathnayaka K, Momot K I, Noser H, Volp A, Schuetz M, Sahama T &
Schmutz B. Quantification of the accuracy of MRI generated 3D models of
long bones compared to CT generated 3D models. Medical Engineering &
Physics. 2011, in press, DOI:10.1016/j.medengphy.2011.07.027.
4. Rathnayaka K, Schmutz B, Sahama T and Schuetz M A. Effects of CT image
segmentation methods on the accuracy of long bone 3D reconstructions
Medical Engineering & Physics. 2011, 33(2): 226-233.
5.
Schmutz B, Rathnayaka K, Wullschleger ME, Meek J, Schuetz MA.
Quantitative fit assessment of tibial nail designs using 3D computer
modeling. Injury. 2010; 41(2): 216-219.
Conference presentations1
1. Rathnayaka K, Cowin G, Schuetz MA, Sahama T, Schmutz B. Correction of
the step artefact in 3D bone models caused by the random movement of the
lower limb during MRI. 17th Annual Scientific Meeting, Australian & New
Zealand Orthopaedic Research Society. Brisbane, Australia, 1-2 September,
2011. (Oral presentation)
2. Rathnayaka K, Coulthard A, Momot K, Volp A, Sahama T, Schuetz M,
Schmutz B. Improved image contrast of the bone-muscle interface with 3T
MRI compared to 1.5T MRI. 6th World Congress on Biomechanics.
Singapore, 1-7 August, 2010. (Poster presentation)
3. Schmutz B, Rathnayaka K, Wullschleger M, Meek J, Schuetz M.
Quantitative fit assessment of tibial nail designs using 3 D computer
modeling. German Society for Orthopaedic and Trauma Surgery. Berlin,
Germany, 21-24 October, 2009. (Oral Presentation)
1
The conference abstracts have not been included in the thesis as the contents of them are covered by the journal articles
XVI
Publications, presentations and awards
4. Rathnayaka K, Sahama T, Schuetz MA, Schmutz B. Validation of 3D models
of the outer and inner surfaces of an ovine femur. 15th Annual Scientific
Meeting, Australian & New Zealand Orthopaedic Research Society.
Adelaide, Australia, 9-10 October, 2009. (Oral presentation)
5. Rathnayaka K, Momot K, Volp A, Noser H, Sahama T, Schuetz MA,
Schmutz B. Quantification of the accuracy of MRI generated 3D models of
long bones. 4th Asian Pacific conference of biomechanics. University of
Canterbury, Christchurch, New Zealand, 14–17 April, 2009. (Oral
presentation)
6. Rathnayaka K, Schmutz B, Sahama T, Schuetz MA. Effects of image
segmentation methods on the accuracy of long bone 3D reconstructions.
14th Annual Scientific Meeting, Australian & New Zealand Orthopaedic
Research Society. Brisbane, Australia, 17-18 November, 2008. (Poster
presentation)
7. Mohd Radizi S, Rathnayaka K, Pratap J, Mishra S, Schuetz MA, Schmutz B,
The effects of CT convolution kernels on the geometry of 3D bone models.
14th Annual Scientific Meeting, Australian & New Zealand Orthopaedic
Research Society. Brisbane, Australia, 17-18 November, 2008. (Poster
presentation)
Awards and Scholarships
1. Outstanding HDR student of the month, Faculty of Built Environment and
Engineering, Queensland University of Technology, December 2010.
2. Student travel grant awarded by 6th World congress on Biomechanics.
Singapore, 1-7 August, 2010.
3. Joint winner of the Wilhelm-Roux-Preis 2009, at Annual conference of the
German Society for Orthopaedic and Trauma Surgery. Berlin, Germany, 2124 October, 2009.
4. Student Travel grant awarded by 15th Annual Scientific Meeting of Australian
& New Zealand Orthopaedic Research Society. Adelaide, Australia, 9-10
October, 2009.
5. Runner-up for best poster presentation, IHBI inspires postgraduate student
conference. Gold Coast, Australia, 2-4 December, 2008.
6. QUT, Faculty of Built Environment and Engineering living allowance PhD
scholarship 2008-2011.
XVII
Authorship
Authorship
I declare that the work contained in this thesis has not been previously submitted to
meet the requirements for an award at this or any other higher education institution.
To the best of my knowledge and belief, the thesis contains no materials previously
published or written by another person except where due reference is made in the
text.
……………………………
Kanchana Rathnayaka
Date:……………….
Rathnayaka Mudiyanselage
XIX
Acknowledgement
Acknowledgement
Firstly, I offer my sincere thanks to my supervisors: Dr Beat Schmutz for the
invaluable support, guidance and advice given throughout the PhD and for helping to
establish my directions; Prof. Michael Schuetz, my principal supervisor, for
encouragement and guidance given; and Dr Tony Sahama for introducing me to the
trauma research group at Queensland University of Technology and for the support
given throughout the PhD study.
I offer my special thanks also to: Dr Konstantin Momot for helping me by sharing his
knowledge of MRI physics and by reading manuscripts, especially during the second
and fourth parts of the research project; Prof. Alan Coulthard for collaborating with
me for the fourth part of the project; Dr Gary Cowin for helping me with MRI
scanning for the third part of the project; Mr Andrew Volp and Mr Russell Porter at
Princes Alexandra Hospital; Mr Raymond Buckley at Royal Brisbane and Women‟s
Hospital for MRI scanning of the samples and volunteers of the study; Mr Jit Pratap
at Princes Alexandra Hospital; and Ms Margaret Day at University of Queensland for
CT scanning of samples.
I must offer my sincere gratitude to all those who volunteered as subjects for the
study and spent their valuable time on my project, and to the National Imaging
Facility for providing me with 100% subsidised access to the 3T MRI scanner.
Thanks to all the researchers who donated ovine limbs from their studies and who
helped me to obtain them at the Medical Engineering Research Facility (MERF). I
would also like to thank the High Performance Computer (HPC) Unit and its
personnel at QUT for their help with the 3D modelling and use of the super
computers. Thanks to all the members of the trauma research group and all the
friends who helped me with various aspects of this research, especially with feedback
on writing and presentations. Finally, the laboratory and directorate staff at IHBI and
MERF also provided kind help during this project and I offer them my gratitude.
XXI
Abbreviations
Abbreviations
13
C
N
1
H
31
P
3D
3T
B0
BW
CAS
CNR
CT
FA
FOV
H2 O
HU
ICP
M0
MHz
MR
MRI
Mt
Mz
NAV
NMR
NPA
NPE
PMMA
RF
ROI
SD
SNR
SNRGER
SNRSE
T1
T2
TE
TMS
TR
V
15
XXII
Carbon
Nitrogen
Hydrogen
Phosphorus
Three dimensional
Three tesla
Main magnetic field
Bandwidth
Computer assisted surgery
Contrast to noise ratio
Computed tomography
Flip angle
Field of view
Water
Hounsfield units
Iterative closest point
Net magnetisation vector
Mega Hertz
Magnetic resonance
Magnetic resonance imaging
Transverse component of net magnetisation vector
Longitudinal component of net magnetisation vector
Number of signal averages
Nuclear magnetic resonance
Number of acquired partitions
Number of acquired phase encodes
Poly-methyl methacrylate (Dental acrylic)
Radiofrequency
Region of interest
Standard deviation
Signal to noise ratio
Signal to noise ratio for gradient echo sequence
Signal to noise ratio for spin echo sequence
Longitudinal relaxation time
Transverse relaxation time
Echo time
Tetramethylsilane
Repetition time
Voxel volume
Chapter 1: Introduction
Chapter 1
Introduction
The introduction of x-ray computed tomographic (CT) scanning and magnetic
resonance imaging (MRI) in the 1970s allowed medical personnel and researchers to
visualise the internal anatomical structures of the human body in three dimensions.
This allowed clinicians and researchers to reconstruct anatomical structures as
computer based three dimensional (3D) models and perform various experiments that
cannot be performed on living subjects. Thus, accurate reconstruction of 3D models
of anatomical structures from CT and MRI became a major research interest. Even
though the main mode of imaging bones is CT, the involvement of ionising radiation
leads clinicians and researchers to avoid CT whenever possible. Thus, a trend
towards the frequent use of MRI is developing among these groups, not only due to
the non-involvement of ionising radiation in MRI, but also due to its ability to
provide better quality images of soft tissue.
Reconstruction of a three dimensional computer model of an anatomical structure
using either CT or MRI imaging methods involves a number of complex processes:
data acquisition; segmentation of the region of interest (ROI) and surface generation
from the segmented volume. Each of these processes plays a crucial role in
determining the geometric accuracy of the reconstructed 3D model. Since the
geometric accuracy of 3D models is of high importance for most of their applications
(e. g. implant design and simulation of surgery), these processes in reconstructing 3D
models have drawn major attention from researchers [1-3]. While all steps play a
crucial role in determining the accuracy of 3D models, image segmentation is one of
the steps which has a higher human involvement and is thus vulnerable to errors.
Even though existing sophisticated segmentation methods are capable of minimising
the human intervention, most of these methods involve complex programming and
mathematics which many of the researchers are not trained to perform [2, 4-7].
1
Chapter 1: Introduction
Furthermore, these algorithms are designed to perform segmentation in a specific
anatomical region and, therefore, are not easily extended to the segmentation of a
different region due to their complex nature. Thus, a simple but accurate method for
medical image segmentation is a necessity.
Reconstruction of a 3D model of a small bone (phalanges or metatarsal bones) is
relatively easy when compared to the reconstruction of a 3D model of a long bone
that has a complex geometry. Thus, most of the studies that investigated
segmentation methods have utilised small bones. Nevertheless, 3D reconstruction of
long bones is important as most of the fracture fixation plates and intramedullary
nails are used for fixation of long bones. When 3D models of long bones are
reconstructed, the diaphyseal as well as the distal and proximal regions are equally
important. Most of the fracture fixation plates and intramedullary nails extend to the
proximal and distal regions (e.g. expert tibia nail used in chapter 4). The
intramedullary nail insertion point is usually in the proximal or distal region, thus,
accuracy of these regions are important to determine the entry point of the nail.
Furthermore, design of implants such as joint replacements needs highly accurate 3D
models of the proximal and distal articular regions. Therefore, the research projects
contained in the thesis will focus on all anatomical regions of long bones.
The decision to use either CT or MRI is mainly determined by the anatomical
structures being scanned. While CT visualises the bone tissue with better contrast,
MRI visualises soft tissues with better contrast as its main source of signal is
hydrogen nuclei which are abundant in soft tissues. The radiation exposure of CT
limits its utilisation to clinical cases and cadaver specimens. As most of the available
cadavers are more than 60 years old, the data acquisition is also limited to this age
group. However, approximately 51% of land transport trauma patients (or 11.4% of
total injury hospitalisations) in Australia during the 2006-2007 period were under 30
years of age. Furthermore, the study conducted by Noble et al 1995 [8] shows that
the femoral isthmus expands in old female population compared to the young
population. The study also showed that the medullary canal expands and the cortex
becomes thinner in old females and the CCD angle (femoral neck-shaft angle)
change with the age. These changes will impact the anatomical fitting of plates and
intramedullary nails designed using 3D models reconstructed from old bones. In
addition, osteophytes in old bones can significantly affect the anatomical fitting of
2
Chapter 1: Introduction
fracture fixation plates especially in ends of the bones. Thus, the acquisition of bone
data from this age group to inform the design of anatomically shaped fracture
fixation implants (plates and nails) for its trauma patients is of utmost importance
[9]. As MRI does not utilise ionising radiation, it is a potential alternative to CT for
acquiring bone data of volunteers from younger age groups.
Even though MRI visualises soft tissues with a high contrast, due to the extremely
short transverse relaxation times, bones generally do not generate a signal in MRI
[10-12]. However, using the signal generated by the soft tissues, bone geometry can
be delineated from the surrounding soft tissues and this has been demonstrated in the
literature [1, 13-17]. MRI has been used for the scanning of bones mainly in the case
of diagnosing metastatic disease, as MRI visualises metastasis with better quality
[18].
The use of MRI for 3D reconstruction of bones has been reported in computer
assisted surgery (CAS) and in foot bone motion quantification where the 3D models
of vertebrae and tarsal bones have been reconstructed [19-21]. Most of these studies
have used MRI for small bones with relatively simple geometry, and a proper
validation of the models has not been performed. Lee et al. used MRI to generate a
3D model of a porcine femur; however, the model has not been validated using an
accurate validation standard [1]. Therefore, before using MRI for 3D reconstruction
of long bones, a quantitative validation with an accurate reference standard is
necessary.
Some of the current limitations of the MRI scanning of long bones are long scanning
times and the difficulty of segmenting certain anatomical regions, conferred by poor
contrast between those anatomical regions and surrounding soft tissues. Since the
signal to noise ratio (SNR) of an MRI system is approximately directly proportional
to the main magnetic field of the scanner, higher field strength (3T) scanners promise
to offer an improved signal which can be converted to faster scanning times or better
image quality compared to the currently available (1.5T) scanners [22, 23]. The
improved image quality of 3T scanners has been demonstrated in a few studies for
computer assisted surgery and kinematic analysis of foot bone motion [24, 25].
However, the contrast at the bone muscle interface, which is more important for
segmentation of bones, has not been quantified and compared in those studies.
3