The dependence between international crude oil price and vietnam stock market nonlinear cointegration test approach
Bạn đang xem bản rút gọn của tài liệu. Xem và tải ngay bản đầy đủ của tài liệu tại đây (2.66 MB, 118 trang )
MINISTRY OF EDUCATION AND TRAINING
UNIVERSITY OF ECONOMICS OF HO CHI MINH CITY
HÀ THỊ NHƯ PHƯƠNG
THE DEPENDENCE BETWEEN INTERNATIONAL
CRUDE OIL PRICE AND VIETNAM STOCK MARKET
NONLINEAR COINTEGRATION TEST APPROACH
ECONOMIC MASTER THESIS
Ho Chi Minh City -2015
MINISTRY OF EDUCATION AND TRAINING
UNIVERSITY OF ECONOMICS OF HO CHI MINH CITY
HÀ THỊ NHƯ PHƯƠNG
THE DEPENDENCE BETWEEN INTERNATIONAL
CRUDE OIL PRICE AND VIETNAM STOCK MARKET
NONLINEAR COINTEGRATION TEST APPROACH
Major: FINANCE - BANKING
Code: 60340201
ECONOMIC MASTER THESIS
INTRUCTOR:
Assoc. Prof. NGUYỄN THỊ NGỌC TRANG
Ho Chi Minh City -2015
COMMITMENT
I commit that the economic master thesis titling “the dependence between international
crude oil price and Vietnam stock market: Nonlinear cointegration test approach” was
made by myself with the direction of Associate Professor Nguyen Thi Ngoc Trang. The
study’s results are truthful and data was collected from the credible sources such as: Ho
Chi Minh City stock exchange, Energy Information Administration, the State Bank of
Vietnam and General Statistics Office of Vietnam.
Ho Chi Minh City, October 28th, 2015
Author
HA THI NHU PHUONG
TABLE OF CONTENT
SUB TITLE PAGE
COMMITMENT
TABLE OF CONTENT
LIST OF ABBREVIATIONS
LIST OF TABLES
LIST OF FIGURES
Abstract ........................................................................................................................... 1
1. Introduction ............................................................................................................... 2
2. Literature Review ...................................................................................................... 7
2.1. Literature Review ................................................................................................... 7
2.1.1. The relationship between crude oil price and stock market ................................. 7
2.1.1.1. Negative effect from crude oil price to stock market ........................................ 7
2.1.1.2. Positive effect from crude oil price to stock market .......................................... 9
2.1.1.3. Insignificant nexus between oil price and stock market .................................. 11
2.1.1.4. The imperial evidences about the relationship between oil prices and
Vietnam stock market ................................................................................................... 12
2.1.2. The relationship between stock market and exchange rate ................................ 13
2.2. Overview about Vietnam stock market, oil sector and exchange rate regime ..... 17
2.2.1. Vietnam stock market......................................................................................... 17
2.2.2. Oil section .......................................................................................................... 19
2.2.3. Exchange regime ................................................................................................ 22
3. Data and research methodology .............................................................................. 25
3.1. Data....................................................................................................................... 25
3.2. Methodology......................................................................................................... 30
3.2.1. Gregory and Hansen Test - GH test ................................................................... 30
3.2.2. Toda-Yamamoto (TY) version of Granger non-causality test ........................... 32
3.2.3. Error Correction Model ...................................................................................... 34
4. Researching result.................................................................................................... 36
4.1. Descriptive statistics ............................................................................................. 36
4.2. Unit root test ......................................................................................................... 41
4.3. Gregory and Hansen Test-GH test ....................................................................... 45
4.4. TY procedure of Granger non–causality test ....................................................... 46
4.5. Error correction model ......................................................................................... 49
5. Conclusion ............................................................................................................... 51
References
Appendices
LIST OF ABBREVIATIONS
Abbreviation
Discription
bbl/d
Barrels per day
ECM
Error correction model
GCC
Gulf Cooperation Council
GDP
Gross domestic product.
HNX
Hanoi Stock Exchange
HOSE
Ho Chi Minh Stock Exchange
IOCs
International Oil Companies
LNG
Liquefied natural gas
MSCI
Middle Small Market Capitalization but Investable
OPEC
Organization of the Petroleum Exporting Countries
The five permanent members of the United Nations Security
P5+1
Council and Germany
PVEP
PetroVietnam Exploration and Production
PVN
PetroVietnam Group
SBV
State Bank of Vietnam
SVAR
Structural Vector Autoregressive Model
Tcf
Trillion cubic feet
The US
The United States
TVTP
Time-varying transition-probability
VAR
Vector Autoregressive Model
VECM
Vector Error Correction Models
LIST OF TABLES
Table 3.1 Variable descriptions and sources:............................................................30
Table 4.1 Descriptive statistic of three variables, exchange rate, crude oil price and
VN index for the entire sample. ................................................................................38
Table 4.2 Descriptive statistic of three variables, exchange rate, crude oil price and
VN index for four phases. .........................................................................................40
Table 4.3 Unit root test result for entire sample .......................................................43
Table 4.4 Unit root test result for four phases: .........................................................44
Table 4.5 Threshold cointegration results .................................................................45
Table 4.6 Critical values of GH test with significant level at 5% and 3 regressors..45
Table 4.7 TY version of Granger non–causality tests ...............................................48
Table 4.8 Error correction model ..............................................................................49
LIST OF FIGURES
Figure 1.1 Global crude oil and petroleum liquids consumption, supply and
inventory in 2014 and 2015 (Source: Energy Information Administration)...............2
Figure 1.2 Crude oil export revenues and productions from 2009 to 08 months of
2015 (source: General Statistics Office of Vietnam). .................................................4
Figure 2.1 Vietnam Stock market capitalization to GDP (%) from 2004-2014
(Source Federal Reserve Economic Data) ................................................................18
Figure 2.2 Proportion of sectoral market capitalization in 2015 (source: HOSE
website). ....................................................................................................................19
Figure 2.3 Average interbank exchange rates from 2006 to 2015 ............................23
Figure 3.1 Graphical presentation of the series for first phase .................................26
Figure 3.2 Graphical presentation of the series for the second phase. ......................27
Figure 3.3 Graphical representation of the third phase. ............................................28
Figure 3.4 Graphical representation of the fourth phase. ..........................................29
Figure 3.5 Graphical representation of the entire sample. ........................................29
1
Abstract
This paper investigates the relationship between crude oil prices and Vietnam stock
prices by using the daily data in the period from 01/03/2006 to 08/31/2015. The data
is divided into four phases, corresponding to two important events, the financial
crisis in 2007 and the significant decline of crude prices from the third quarter of
2014. The research methods employed are the threshold cointegration test of
Gregory and Hansen (1996), TY procedure for Granger non-causality proposed
Toda- Yamamoto (1995) and Error correction model (Granger, 1987). The results
show that there exists a long run relationship between crude oil prices and Vietnam
stock market in the entire sample; however, there is no cointegration between these
variables in all four phases. There is evidence that crude oil prices unidirectionally
affect stock prices in the entire sample and in the second and third phase; and the
crude oil price variable is an exogenous one. In the last phase attached with the
decline of crude oil prices, no evidence in statistic shows that the oil prices do
Granger cause to stock prices. It likely proves that volatilities of world crude oil
prices can affect negatively or positively to profit outlooks of the listed companies
on Vietnam stock market, and there is a balance between benefits and damages in
this period. ECM model indicates that oil prices and stock prices have a positive
relationship in short term, and the speed of adjustment of stock price to return the
equilibrium state after a shock is slow around 0.25%. These findings also have an
important policy implication that helps the government intercept the market to
reduce the negative effect from the energy shocks in general and oil price shocks in
particular. Those are to pay more attention to domestic production and trade
revenues to get more stable budget, research the alternative energy and enhance
international cooperation in the energy sector.
Key words: Oil price, stock market, threshold cointergration.
2
1. Introduction
The oil crude prices has fallen less than $50 per barrel, about 50% of August 2015.
The main reason is the oil supply more than demand (see the figure 1). Growing oil
inventories and supply typically put downward pressure on near-term prices. The
United States discovered and applied the new oil drill technology, called “shale oil
revolution”. This pushes the oil production is near 10 million barrels per day. So
that it can be offset the substantial oil supply disruption in the Organization of the
Petroleum Exporting Countries (OPEC). However, the resumption of significant
Libyan oil production, combined with the weakening outlook for global oil demand,
the large economies in the word such as China, Russia, Europe area show not good
performances about industrial production and expectation for economic growth.
Figure 1.1 Global crude oil and petroleum liquids consumption, supply and
inventory in 2014 and 2015 (Source: Energy Information Administration).
On July 14, the P5+1 (the five permanent members of the United Nations Security
Council and Germany) and Iran announced an agreement that could result in relief
from United States and European Union nuclear-related sanctions (which include
some oil-related sanctions). If the agreement is implemented and sanctions relief
occurs, it will put additional Iranian oil supplies on a global market that has already
3
seen oil inventories raise significantly over the past year. All things have put
downward pressure on oil prices.
Vietnam is net exporter of crude oil, but is a net importer of oil products, the
volatilities in crude oil prices or costs of raw materials should affect to revenue
resource of state budget and economic growth. Volatilities of world crude oil price
can affect negatively or positively to profit outlooks of the listed companies on
Vietnam stock market. The companies have inputs from the oil waste products
(such as PLV-Petrolimex Petrochemical Corporation, BMP - Binh Minh Plastic
Joint Stock Company,..) and other companies have input coming directly from the
petroleum sector (PVT- PetroVietnam Transportation Corporation, PVS PetroVietnam Technical Services Corporation, PVC - Drilling Mud Joint Stock
Corporation, GAS - PetroVietnam Gas Corporation) are likely to be impacted
negative by the decrease of oil price.
The figure 1.2 shows that revenues and productions from 2009 -2015. The crude oil
prices have decreased since third quarter in 2014, strongly affecting to crude oil
revenues in 2015 although the export productions is bigger than the same period.
We are the one of emerging country and its economy depends very large in export
activities. The decline of crude oil price will impact to budget revenues and deficit
Energy, in particular crude oil has played an important role in our economy. The
purpose of this study is to investigate the relationship between crude oil price and
Vietnam stock market. In this paper, I will answer this question from several
perspectives:
(i) Does it exist a long-run relationship between crude oil prices, stock prices and
exchanges rates in entire sample?
(ii) Do the big world events such as the financial crisis in 2007 and the technology
shock called “shale oil revolution” affect to the co-movement of the three?
4
(iii) Can the prior values of crude oil prices predict the future values of stock prices
or crude oil prices do Granger cause to stock prices?
(iv) Can the exchange rates do Granger cause to stock prices?
(v)
Is the crude oil price an exogenous variable?
(vi) How does the impact of crude oil prices, exchanges rates on stock prices? And
How adjusted speed of stock prices to return the equilibrium if having a shock in
present?
30.00
9.00
8.00
7.00
6.00
5.00
4.00
3.00
2.00
1.00
0.00
25.00
20.00
15.00
10.00
5.00
0.00
F2a. Crude oil export value
(unit: 1billion dollars)
F2b. Crude oil export production
(unit: $1billion ton)
Figure 1.2 Crude oil export revenues and productions from 2009 to 08 months of 2015
(source: General Statistics Office of Vietnam).
The study will provide investors the market outlook in the future before the oil price
fluctuations in the present. Therefrom the investor can make the appropriate
hedging strategies and diversification. Specially, for a country which the foreign
currency primarily comes from exporting natural resources such as coals, oil …like
us, then the strong oil price volatilities will snappily impact its international
balances, budget deficits and economic growth rates. Through this study, I hope to
provide further evidences about the energy importance to the economy and suggest
solutions that government can intercept to reduce marker volatilities
5
The study uses the daily data with the period spanning from 01/03/2006 to
08/31/2015. Year 2006 chosen is the beginning study year, because Vietnam stock
market has just had steps on obvious development in numbers of listed companies
and trading volume, and can reflect partly economic situation. The entire samples is
divided into 04 phases, the first phase from 01/03/2006 to 12/28/2007 , the second
phase from 01/02/2008 to 12/31/2009, the third phase from 01/04/2010 to
06/30/2014 and the last phase from 07/01/2014 to 08/31/2015, attaching with the
significant decline in oil prices since the beginning of July 2014 due to excessive oil
supply while the world economy is still gloomy and has not yet recovered.
Threshold cointegration test of Gregory and Hansen (1996) is employed test the
long-term relationship of oil prices, exchange rates and stock prices. From the
result’s GH test indicate there exists the long run nexus between these variables.
Interesting however, the null hypothesis of no co integration cannot reject at
significant level 5% in all four phases. This does prove that events in the research
stage impact the long-term structure of oil prices and the stock market. The
interruptions make them impossible to reach the equilibrium in the limited time of
subsample.
Using the T-Y version of Granger non-causality test proposed by Toda-Yamamoto
(1995) shows that there exists a unidirectional relationship, running from oil prices
to stock prices in the entire sample, and the second and third phase. These are in and
after the 2007 financial crisis. In contrast to my expectation, the crude oil prices
insignificantly cause Granger to stock price in the last phase. The effects of oil price
on stock market maybe need several lags and this phase is not long enough to see
them. Besides that, some industries take benefits and some industries bear damages
from the decline of oil prices, maybe there has the balance between benefits and
damages in this period.
Error Correction Model indicates that oil prices and stock prices have a positive
relationship in short term. The reason may come from the oil industry’s stocks have
6
large market capitalization and significant impact to the market index. The decline
of oil prices will lead these stocks of these companies plummet, market sentiment in
the short term push the market index decrease. However, the exchange rates don’t
affect the stock market in the short term. The speed of adjustment of stock price to
return the equilibrium state after a shock is slow around 0.25%.
The study also suggest some policies that help the government intercept the market
to reduce the negative effect from the energy shocks in general and oil price shocks
in particular. Those are to paying more attention to domestic production and trade
revenues to get more stable budget, research the alternative energy and enhance
international cooperation in the energy sector.
The outline of this study is structured as follow: Section 1 introduction; section 2
literature reviews and overall about Vietnam stock market, oil sector, and Exchange
regime; section 3 data and research method; section 4 researching result and section
5 conclusion.
7
2. Literature Review
There are many papers investigating on the relationship between oil prices and
stock prices. However, the results of studies are not consistent; the differences
depend on the features of each economy. I classify the literature review of the nexus
between stock prices and oil prices into three sections: (1) negative effect, (2)
positive effect and (3) insignificant effect.
2.1.
Literature Review
2.1.1. The relationship between crude oil price and stock market
2.1.1.1. Negative effect from crude oil price to stock market
Chen 2010 investigates whether the high oil price can lead the stock market into the
bear territory or a recession of the stock market. He uses monthly data from
1957M1 to 2009M5, including returns on Standard & Poor’s S&P 500 price is a
proxy of stock market returns and oil price shocks are measured in different
methods: changes in oil prices, oil price increases, net oil price increases, and scaled
oil price increases. In this paper, he employs a time-varying transition-probability
(TVTP) Markov-switching model, which allows the probability of switching
between states (bull markets vs. bear markets) to characterize the fluctuations in the
stock market and to identify the impact of oil prices on the switching between
stages. The empirical evidences show that an increase in oil prices leads to a higher
probability of a bear market emerging.
Juncal and Fernando (2013) examine the impact of oil price shocks on stock
returns in 12 oil importing European economies using Vector Autoregressive
(VAR) and Vector Error Correction Models (VECM) for the period 1973M2 –
2011M12. The oil price shocks was divided into 02 kinds, they are oil supply and
oil demand shocks, which are measured by world oil production and world oil
prices respectively. Moreover, there are other explanation variables added to models
such as industrial production indexes, short-term interest rates in order to express
8
different channels through which oil prices could affect stock returns. The main
contribution is identification that stock returns may respond in different ways to
supply and demand shocks. The oil supply shocks tend to have a greater negative
impact on stock market returns than oil demand shocks. Generally, the oil price
change lowers economic activity in oil importing economies because of more
expensive energy inputs. However, if the increase comes from demand shock, then
economic activity in oil importing economies can be impacted negative (due to
higher production cost ) or positive (due to increase world income and
consumption).
Rumi et al. (2011) aims to how important the oil price changes and oil price
volatility impact on Korean stock market – a net oil - importing country. The model
used is VECM with monthly observations from May 1988 to January 2005 of
interest rates, industrial production, real stock returns, real oil prices and oil price
volatility. In which, the oil prices and interest rate are exogenous variables. The
result of paper shows that there exists the long – run and stable relationship between
four variables, especially, oil price movement has significant effect on stock returns
and the real stock returns are the main channel of short-run adjustment to long-run
equilibrium. The oil price changes have two ways to impact to firm profitability;
those are through production cost and investor sentiment to stock market index.
Besides that, authors also suggest three solutions coping with high and volatile oil
prices such as increasing government’s strategic oil reserves, considering oil-saving
measures and enhancing dialogue with oil-exporting countries.
Wensheng et al. (2014) examines the impact of structural oil price shocks on the
covariance of the US stock market return and stock market volatility by using the
SVAR model in period from January 1973 to December 2013. The SVAR with
recursive structural restrictions follows up the order of variables such as: oil supply,
aggregate demand, oil market-specific demand, and covariance of return and
volatility. Positive shocks to aggregate demand and to oil-market specific demand
9
are associated with negative effects on the covariance of return and volatility. An
unanticipated reduction in crude oil production is associated with a statistically
significant increase implied-covariance of return and volatility. The spillover index
between the structural oil price shocks and covariance of stock return and volatility
is large and highly statistically significant.
2.1.1.2. Positive effect from crude oil price to stock market
Zhu et al. (2013) researches on structural dependence between crude oil prices and
Asia-Pacific stock market returns. There are many different approaches, however,
traditional approaches such as VAR or VECM require variables follow normal or
Student t-distributions. Furthermore, it is well known that traditional mean variance
optimization analysis portfolios are symmetric measures that cannot capture nonlinear dependence or changes in the tails of asset return curves and that investors
pay closer attention to downside than to upside risk. The model proposed is the
copula - GARCH models. The data set includes daily crude oil prices and ten Asia –
Pacific countries' stock returns from January 4, 2000 to March 30, 2012. The data is
divided into two subsamples referred to as pre-crisis (January 4, 2000 to 23
September 2008) and post-crisis (September 24, 2008 to March 30, 2012),
respectively to explore differences of the dependence between phases. The results
show that the dependence between crude oil prices and Asia-Pacific stock market
returns is generally weak, that it was positive before the global financial crisis,
except in Hong Kong, and that it increased significantly in the aftermath of the
crisis. They found that the tail dependence was very weak before the crisis and that
the lower tail dependence was much higher than the upper tail dependence after the
crisis, except in the cases of Japan and Singapore.
Moya-Martínez et al. (2013) examines oil price sensitivity of Spanish industries
for the period January 1993 to December 2010. Data set includes weekly
observations of stock market returns (proxied by indices General de la Bolsa de
Madrid), weekly returns of 14 industries, the Dated Brent crude oil prices and
10
interest rates. A multifactor market model is used to investigate the impact of oil
price changes on industry stock returns and is estimated for sub-samples based on
the breakpoints identified by Bai and Perron multiple structural break tests. The
result indicates that the exposure of Spanish industries to oil price is rather limited,
although the oil price exposure is different considerably between industries. The
exposure was very small in the 1990s, period of fairly stable and cheap oil prices. It
increases in the 2000s with higher and more volatile oil prices. Because aggregate
demand-side oil price shocks are driven by fluctuations in the global business cycle,
so crude oil price and Spanish equity market have moved together.
Riza et al. (2015), this study contributes to the literature on the relationship
between oil and stock markets by formally testing whether oil price risk is
systematically priced in the cross-section of stock returns in net oil exporting
nations, the Gulf Cooperation Council (GCC) nations. Using firm-level data on Gulf
Arab stock markets for the period March 31, 2004 and March 31, 2013 such as
stock price, number of shares and book equity data, combine with exchange rate,
three-month U.S. Treasury Bill rate as the risk-free rate, and Brent crude oil prices.
The results indicate that stocks that are more sensitive to oil price fluctuations
indeed yield significantly higher returns, suggesting that oil price risk exposure can
serve as a return predictor in these stock markets. Interestingly however, there is no
yield evidence of a significant risk premium associated with oil price risk in the
presence of firm-level risk factors, suggesting that firm-level factors like firm size
and idiosyncratic volatility controls for the oil price risk in returns, rendering the oil
factor insignificant in their test.
Su-Fang et al. (2011), investigate the relationship between oil prices and the
Chinese stock market at the sector level. Using the a panel cointegration with
structural breaks and Granger causality framework and data collected from July
2001 to December 2010 including monthly real oil price, the real stock price
indices for the 13 major sectors and a controlling variable, interest rate. Their
11
findings show that there exist a positive relationship between oil prices and sectoral
stock prices in the long run. It may also indicate that the impact of other substitute
energy sources (e.g., coal) or other internal and domestic factors on these sectoral
stocks are more dominant than the increase in oil prices. The results of Grange
causality tests find a unidirectional, long-run and short-run relationship running
from oil prices and sectoral stocks to the interest rate for the period 2001/07–
2005/10. Interesting however for period 2005/12–2007/06, there is only the
unidirectional long –run Granger causality running from sectoral stocks to oil prices
and from sectoral stocks to the interest rate. Additional, the long-run Granger
causality is bidirectional between oil prices, the interest rate and sectoral stocks for
2007/08–2008/11 and 2009/01–2010/12.
2.1.1.3. Insignificant nexus between oil price and stock market
Apergis and Miller (2008) models the impact of oil market shocks to stock market
returns. The components of oil market shock determined by modifying the
procedure of Kilian (2008a) include oil-supply shocks, global aggregate-demand
shocks, and global oil-demand shocks. The authors use the monthly data for the
eight countries -Australia, Canada, France, Germany, Italy, Japan, the United
Kingdom, and the United States – spans 1981 to 2007 and VAR model. The results
show that different oil-market structural shocks play a significant role in explaining
the adjustments in stock-market returns. But, the magnitude of such effects proves
small. The oil-supply and global aggregate demand shocks do not significantly
explain the stock return in Australia, whereas the idiosyncratic demand shocks
affect the stock return in Canada at a weaker level of significance. Further, the
Granger temporal causality tests suggest a strong role for idiosyncratic demand
shocks leading the stock market returns, whereas the oil-supply and global
aggregate-demand shocks do not as a rule temporally lead the stock-market return.
Janabi et al. (2010) test for the efficient market hypothesis in the six Gulf
Cooperation Council (GCC) countries equity markets—namely Bahrain, Kuwait,
12
Qatar, Oman, Saudi Arabia, and the United Arab Emirates. The dataset used in this
study consist of daily observations of the Standard & Poor's (S&P) Emerging
Market Indexes for six countries for the period April 03, 2006 through March 28,
2008 and two benchmark indexes for oil and gold. Since the data is non-normal
with time-varying volatility, the authors apply a new methodology based on the
leverage bootstrapped simulation technique. The causality test results reveal that
neither the oil price index nor the gold price index causes the equity price indexes of
the six GCC markets. This means that the information contained in the gold and oil
price indexes cannot improve the forecast of the equity market index in each of the
six GCC states. Thus, the possibility of short-term arbitrage is ruled out and the six
GCC equity markets can be considered as informationally efficient with respect to
oil and gold prices.
2.1.1.4. The imperial evidences about the relationship between oil prices and
Vietnam stock market
Vo Xuan Vinh (2014) investigates the long and short-run relationship between
Vietnam’s stock prices (VN-Index) and the US stock prices (S&P 500 Index), the
US Dollar - VN Dong exchange rates, gold prices, and crude oil prices. The paper
uses the daily data from 01/04/2005 to 12/31/2012 and divides the entire sample
into two sub-periods to account the effect of 2008 Global financial crisis, the first
one is 2005-2007 and the second one is 2008-2012. In the short term the paper
indicates a high level of correlation between the VN-Index and the crude oil price.
The evidences from the bivariate cointegration test show that there exist the longrun relationship between VN index and crude oil prices in the whole periods and the
second sub-period. In this sub period, there only exist the long run-relationship
between VN index and exchange rate. The results of Grange causality tests find a
unidirectional relationship running from oil prices to the stock market in the entire
period and the first sub-period. Additional, there is a unidirectional relationship
running from Exchange rate to the stock prices in the first sub-period.
13
Narayan and Narayan (2010) model the impact of oil prices on stock prices in
Vietnam stock market. The study uses the daily data for period from 2000-2008 of
stock prices, nominal exchange rates and oil prices. Using the cointegration tests
including Johansen test and structural break cointegration tests finds there exists the
long run relationship between stock market, oil prices and exchange rates. Running
the long-run elasticities, the authors find that oil prices and exchange rates have a
positive and significant effect on stock prices. However, the result is inconsistent
with the theoretical expectations. Because they think that there are some different
factors contributing to the stock market boom in this period such as increasing
foreign portfolio investment capital flows and local market participants. The study
also combines the long –run model with the short-run model by using error
correction model. The results show the determinants of stock prices are statistically
significant in the long run and they are insignificant in the short run.
Nguyen and Ishaq (2012) study the dependence structures and/or tail dependence
between oil price changes and stock market indices. The tail dependence helps to
determine whether the two variables move together in the same or opposite
directions. This paper employs two relatively new methods, namely the Plots
(Kendall or K plot and chi plot) based on nonparametric method and the copula,
based on parametric method. The daily data sets include WTI crude oil prices and
stock prices from China and Vietnam. The study period in Vietnam is from 2002 to
August 2009 and in China is from 2000 to August 2009. The results show that there
is left tail dependence between international oil price changes and Vietnam’s
stock market, meaning that if the international oil price decreases, Vietnam’s
stock market will also decrease accordingly. While there is no evidence showing
that tail dependence in the relationship of international oil price changes and
China’s stock market.
2.1.2. The relationship between stock market and exchange rate
14
The exchange rate is used as a controling variable in my study. I investigate the
nexus between exchange rate and stock market based on two approaches.
Firstly, in accordance with Krugman and Obstfeld, (1997, Chapt. 16):
The
connection between the asset market equilibrium and the exchange rate is the
interest parity condition
𝑅 = 𝑅∗ + (𝐸 𝑒 − 𝐸)/𝐸
where R and R* are interest rates of domestic and foreign currencies and E and 𝐸 𝑒
denote exchange rate and expected future exchange rate respectively. For asset
markets to remain in equilibrium, ceteris paribus, a decline in domestic output
(hence lower R due to reduced demand for money) must be followed by a currency
depreciation (a greater value for E). Aggarwal (1981) has argued that a change in
exchange rates could change stock prices of multinational firms directly and those
of the domestic firms indirectly. In the case of a multinational firm, a change in
exchange rate will change the value of that firm’s foreign operation, which will be
reflected on its balance sheet as a profit or a loss. Consequently it contributes to
current account imbalance. Once the profit or a loss is announced, that firm’s stock
price will change. This argument shows that devaluation could either raise or lower
a firm’s stock price depending on whether that firm is an exporting firm or it is a
heavy user of imported inputs. If it involves in both activities, its stock price could
move in either direction. This is true especially when most stock prices are
aggregated to investigate the effects of devaluation on stock markets. From this
viewpoint, exchange rate change is expected to give rise to stock price change. Such
a causal relation is known as the traditional approach.
Secondly, as capital market become more and more integrated, changes in stock
prices and exchange rates may reflect more of capital movement than current
account imbalance. The central point of such a portfolio approach lies in the
following logical deductions: A decrease in stock prices causes a reduction in the
15
wealth of domestic investors, which in turn leads to a lower demand for money with
ensuing lower interest rates. The lower interest rates encourage capital outflows
ceteris paribus, which in turn is the cause of currency depreciation. Under the
assumption of the portfolio approach, stock price is expected to lead exchange rate
with a negative correlation. If a market is subject to the influences of both
approaches simultaneously, a feedback loop will prevail with an arbitrary sign of
correlation between the two variables.
Bahmani et al. (1997) are the pioneers of using cointegration and Granger causality
techniques to investigate the interaction between stock prices and FX markets. The
data they used consist of monthly S&P500 and effective exchange rates of US
dollar from December 1973 to December 1983. A two-stage systematic
autoregressive procedure was employed developed by Hsiao (1981). They found
bidirectional causality in the short run. However, there is no long-run relationship
between the variables
Nieh and Lee (2001), their major findings from their time-series estimations
supported the results of Bahmani-Oskooee and Sohrabian (1992) and reported no
long-run.
Ajayi and Mougoue (1996) showed a negative short-run and positive long-run
impact of stock prices on domestic currency value. Particular, in a study, recent
advances in time-series are applied to examine the intertemporal relation between
stock indices and exchange rates for a sample of 8 advanced economies. An error
correction model (ECM) of the 2 variables is employed to simultaneously estimate
the short-run and long-run dynamics of the variables. The ECM results reveal
significant short-run and long-run feedback relations between the 2 financial
markets. Specifically, the results show that an increase in aggregate domestic stock
price has a negative short-run effect on domestic currency value. In the long run,
however, increases in stock prices have a positive effect on domestic currency
16
value. On the other hand, currency depreciation has a negative short-run and longrun effect on the stock market
Roll (1992) also studied the US stock prices and exchange rates and found a
positive relationship between the two markets. On the other hand, Chow et al.
(1997) examined the same markets but found no relationship between stock returns
and real exchange rate returns. They repeated the exercise with a longer time
horizons and found a positive relationship between the two variables
Abdalla and Murinde (1997) studied the prices in FX and stock markets in four
less developed countries, namely India, Korea, Pakistan, and Philippines within a
VECM (vector error correction model) framework. For the period January 1985 to
July 1994, they find unidirectional causal linkage between exchange rates and stock
prices for Pakistan and Korea. The real effective exchange rate Granger cause the
stock price index in India, but no causal relationship was found in the case of
Philippines
Ajayi et al. (1998) examine the interaction between daily stock returns and changes
in the exchange rates for two groups of markets: Advanced economies (including
Canada, Germany, France, Italy, Japan, UK, and USA) whose data start from April
1985 to August 1991 and Asian emerging markets (including Taiwan, Korea, the
Philippines, Malaysia, Singapore, Hong Kong, Indonesia, and Thailand) whose data
cover December 1987 to September 1991. In the case of Indonesia, the Philippines,
Taiwan, and all advanced markets, there is one-way causal relationship running
from the stock market to the FX market, while in the case of Korea, the relationship
is reverse. They also perform causality test on weekly data and find that the results
are in line with the daily data for the advanced markets. However, a very different
result is obtained for emerging markets: unidirectional causal relationship from the
stock returns differential to the change in the exchange rate is found for Thailand
and Malaysia
17
Granger et al. (2000) apply Granger causality test and IRF to examine the
interaction between stock prices and FX market. Nine Asian countries and regions
are selected for the empirical analysis: Hong Kong, Indonesia, Japan, South Korea,
Malaysia, the Philippines, Singapore, Thailand, and Taiwan. Their study employs
daily data from 3 January 1986 to 14 November 1997 (3097 observations). Three
sub-periods are fractionized from the whole analyzed period: the first period started
from the first observation to 30 November 1986; the second period extends from 1
December 1987 to the end of 1994 and it is called after crash period; and the third
one covers the rest observations. In the first period, by using 10% as significance
level, there is no causal linkage for those countries except Hong Kong and South
Korea, which have one-way causality from exchange rate to stock price and from
stock price to exchange rate, respectively. In period 2, the authors find
unidirectional causal linkage from FX markets to stock markets in Malaysia and the
Philippines and reverse linkage in Taiwan. During the last period, it is found that
the change in stock prices will lead the change in the exchange rates in Taiwan, and
the reverse relationship is found in Japan, Thailand, Singapore, and Hong Kong. In
the rest markets, bidirectional causal relationships between the two variables were
established. Moreover, the study shows that the predictable portion of stock price
changes can be improved by including the exchange rate variation within the
regression
2.2.
Overview about Vietnam stock market, oil sector and exchange rate
regime
2.2.1. Vietnam stock market
Vietnam is a MSCI frontier market likes Pakistan, Sri Lanka and Bangladesh.
Frontier markets are investable but have lower market capitalization and liquidity
than the more developed emerging markets.
18
Vietnam has two stock exchanges – the Ho Chi Minh Stock Exchange (HOSE) and
the Hanoi Stock Exchange (HNX). HOSE is mostly dedicated to equities trading,
while HNX trades equities, bonds and over the counter securities.
HOSE was initially established as the Ho Chi Minh City Securities Trading Center
(HoSTC) in 2000. It was later upgraded and renamed in 2007. Prior to March 1st
2002, shares were only traded on alternate days. The Vietnam equities market has
come a long way in a short time. In January 2006, there were only 34 companies
listed on HOSE; this has increased to 303 in 2012, with the market cap expanding
from USD 1.1billion in 2006 to USD 29.9 billion in 2012. In 2015, there are 600700 companies listed on HOSE with the market capital of USD 60 billion.
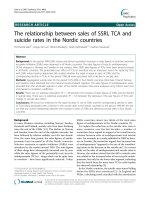
Figure 2.1 shows the market capitalization to GDP from 2004 to 2016. This ratio
significantly increases over year-to-year. In 2013-2014, the market capitalization
accounted about 31% GDP and increased 24% compared to 2006. However,
compared with other emerging markets such as China, India, and South Africa, then
Vietnam stock market is relatively less developed.
35.00
31.00 31.50
30.00
25.00
20.00
18.05
15.95
15.00
10.00
17.17
14.16
16.25
14.07
7.06
5.00
0.41
0.61
2004
2005
0.00
2006
2007
2008
2009
2010
2011
2012
2013
2014
Figure 2.1 Vietnam Stock market capitalization to GDP (%) from 2004-2014 (Source
Federal Reserve Economic Data)