Marketing strategy for poca snack 2012 – 2015
Bạn đang xem bản rút gọn của tài liệu. Xem và tải ngay bản đầy đủ của tài liệu tại đây (2.34 MB, 84 trang )
TRƯỜNG ĐẠI HỌC MỞ TP.HCM
UNIVERSITÉ LIBRE DE BRUXELLES
HO CHI MINH CITY OPEN UNIVERSITY
SOLVAY BRUSSELS SCHOOL
MBMM5
NGUYEN THI MY NGOC
MARKETING STRATEGY FOR POCA SNACK
2012 – 2015
MASTER PROJECT
MASTER IN BUSINESS & MARKETING MANAGEMENT
Tutor’s Name: Dr. Nguyen Minh Kieu
Ho Chi Minh City
(2012)
i
CERTIFICATE
I certify that the substance of this project has not been submitted for any other degree and
is not currently being submitted for any degree or qualification.
I also certify that, to the best my knowledge, any help received in preparing this project,
and all the resources used have been acknowledged in this project.
Signature:………………………………………..
NGUYEN THI MY NGOC
iii
ACKNOWLEDGEMENTS
Firstly, I would like especially to acknowledge my Direct Professor, Dr. Nguyen Minh
Kieu – Vice Dean of graduate office from HCMC Open University, for his guideline,
advice, support and contributions throughout this project.
Secondly, I also want to acknowledge Dang Thanh Hung – Marketing Manager for his
comments on the project’s methodology and valuable experience in doing project. I also
grateful thank the Marketing Department of Pepsi International Company for their
supporting data on my cases study.
Next, I also wish to thank Prof. Olivier Kupferman of the subject Marketing & Business
Planning and Prof. Jean – Pierre Baeyens of the subject Strategic marketing for their
theory.
I am particular great thank the founders of this study program, Prof. Tran Anh Tuan who
create opportunity for me to study this useful program as well as all professors and
coordinators of this study program.
Finally, I am grateful for my family, my friends, my classmates for their support and
encouragement to pursue this study successfully.
iv
TABLE OF CONTENTS
Certificate ........................................................................................................ Page i
Advisor’s comments ....................................................................................... Page ii
Acknowledgements ....................................................................................... Page iii
Table of contents ........................................................................................... Page iv
List of abbreviations ...................................................................................... Page vi
List of tables and figures .............................................................................. Page vii
CHAPTER 1: INTRODUCTION............................................................................ Page 01
1.1 Rationale of the study .................................................................................. Page 01
1.2 Objective of the study.................................................................................. Page 01
1.3 Scope and limitations .................................................................................. Page 01
1.4 Research method ........................................................................................ Page 02
1.5 Structure of study ........................................................................................ Page 02
CHAPTER 2: LITERATURE REVIEW OF MARKETING STRATEGIES ...Page 03
2.1 Concept of Marketing Strategy ................................................................... Page 03
2.1.1 Definition of Marketing Strategy .................................................... Page 03
2.1.2 Marketing strategy process ............................................................. Page 03
2.2 Marketing Strategies.................................................................................... Page 04
2.2.1 The Competitive strategies ............................................................. Page 04
2.2.1.1 Market leader strategies ...................................................... Page 04
2.2.1.2 Market – challenger strategies ............................................ Page 06
2.2.1.3 Market follower strategies .................................................. Page 07
2.2.1.4 Market niches strategies ..................................................... Page 08
2.2.2 The Product life cycle strategies ..................................................... Page 09
2.2.2.1 Strategies for the introductory phrase................................. Page 09
2.2.2.2 Growth strategies ................................................................ Page 10
2.2.2.3 Strategies for Maturity........................................................ Page 10
2.2.2.4 Strategies for decline .......................................................... Page 11
v
2.2.3 The product line strategies .............................................................. Page 12
CHAPTER 3: THE MARKET ANALYSIS ........................................................... Page 15
3.1 Marketing environment analysis ................................................................. Page 15
3.1.1 Macro-environment analysis ........................................................... Page 15
3.1.1.1 State of the world................................................................ Page 15
3.1.1.2 State of economic development in Vietnam ....................... Page 16
3.1.1.3 Demography in Vietnam ................................................... Page 16
3.1.1.4 Social trend in Vietnam ...................................................... Page 18
3.1.1.5 The government promotes local products .......................... Page 18
3.1.1.6 Environment concerns ........................................................ Page 19
3.1.2 Micro – environment analysis ......................................................... Page 19
3.1.2.1 Market analysis ................................................................... Page 19
3.1.2.2 Distribution trend................................................................ Page 22
3.1.2.3 Competitor information ...................................................... Page 26
3.1.2.4 Customer insight ................................................................. Page 35
3.2 Pepsi International and Poca brand information. ........................................ Page 41
3.2.1 Pepsi International information....................................................... Page 41
3.2.2 Poca snack information. .................................................................. Page 42
3.2.3 Poca Sales performance .................................................................. Page 43
3.2.4 Poca Marketing performance ......................................................... Page 49
3.3 Poca SWOT analysis ................................................................................... Page 51
CHAPTER 4: MARKETING STRATEGIES 2012 – 2015 ................................. Page 53
4.1 Vision and Mission ..................................................................................... Page 53
4.2 Marketing Objectives ................................................................................. Page 53
4.3 Marketing Strategies from 2012 to 2015 .................................................... Page 53
4.3.1 Overall strategies for Poca snack category .................................... Page 53
4.3.2 Competitive strategies .................................................................... Page 55
4.3.2.1 Strategies for Potato Chip .................................................. Page 55
4.3.2.2 Strategies for Extruded snack ........................................... Page 55
4.3.2.3 Strategies for Peanut .......................................................... Page 57
4.3.3 Marketing mix strategies ................................................................ Page 58
4.3.3.1 Product strategies ............................................................... Page 58
4.3.3.2 Price strategies ................................................................... Page 65
4.3.3.3 Place strategies .................................................................. Page 65
4.3.3.4 Integrated marketing communication strategies ................ Page 67
CONCLUSION ........................................................................................................ Page 70
APPENDIX ................................................................................................................ Page 71
REFERENCES ......................................................................................................... Page 75
vi
LIST OF ABBREVIATIONS
FMCG:
GDP:
SWOT:
CEO:
PR:
GT:
MT:
R&D:
BCG:
SBU:
CPI:
CAGR:
KA:
IMC
Fast moving customer goods
Gross Domestic Product
Strengths, Weakness, Opportunities, and Threats
Chief Executive Officer
Public Relationship
General Trade
Modern Trade
Research and Development
Boston Consulting Group
Strategic business unit
Consumer Price Index
Compounded Annual Growth Rate
Key Account
Integrated Marketing Communication.
vii
LIST OF TABLES & FIGURES
FIGURE
Figure 2.1: Strategic planning process. ..................................................................Page 04
Figure 2.3: The BCG growths – share matrix. .......................................................Page 12
Figure 3.1 Total Vietnam Population 2009 ............................................................Page 17
Figure 3.2: Sales of Package Food by Category: Value 2005-2010. .....................Page 20
Figure 3.3: Sales Sweet and Savoury Snack by Category: Value 2005- 2010. .....Page 20
Figure 3.4: Sales Growth of Sweet and Savoury Snack. .......................................Page 21
Figure 3.5 : Share of Sales Sweet and Savoury Snack by Category
2010 vs 2005. ......................................................................................Page 21
Figure 3.6: Sales Sweet and Savoury Snack by Category: Value 2010 – 2015. ...Page 22
Figure 3.7: Total Vietnam Share of Trade. ............................................................Page 23
Figure 3.8: Brand Loyalty. .....................................................................................Page 24
Figure 3.9: Sales of Sweet and Savoury Snack by Distribution format:
% Analysis 2005 – 2010. ....................................................................Page 24
Figure 3.10: Penetration Rate for each SKU / CHANNEL. ..................................Page 25
Figure 3.11: Sweet and Savoury Snack Company Share 2009. .............................Page 26
Figure 3.12: Sweet and Savoury Snack Brand Share 2009. ..................................Page 27
Figure 3.13 Tan tan’s Portfolio. .............................................................................Page 29
Figure 3.14: Kinhdo’s Portfolio. ............................................................................Page 31
Figure 3.15: Orion’s Portfolio. ..............................................................................Page 32
Figure 3.16: Oishi’s Portfolio. ...............................................................................Page 34
Figure 3.17: Ratios of Snack usage. ......................................................................Page 35
Figure 3.18: Frequency of Usage. ..........................................................................Page 37
Figure 3.19: Place to buy Snack. ...........................................................................Page 38
Figure 3.20: When to buy Snack. ..........................................................................Page 38
Figure 3.21: Where to buy Snack. .........................................................................Page 40
Figure 3.22: Who to buy Snack with. ....................................................................Page 40
Figure 3.23: Reasons to eat Snack. ........................................................................Page 41
Figure 3.24: Benefit to eat Snack. ..........................................................................Page 41
Figure 3.25: Poca snack’ categories’ portfolio ......................................................Page 43
Figure 3.26: Sales of Poca snack: Value 2006 – 2011. ..........................................Page 44
viii
Figure 3.27: Sales of Poca Snack: % value growth 2006 – 2011. .........................Page 44
Figure 3.28: Sales of Poca Snack by Category: % analysis 2011. ..........................Page 45
Figure 3.29: Sales of Poca snack by Distribution: % analysis 2011. .....................Page 45
Figure 3.30: Sales of Poca snack by Distribution: % analysis 2011. ..............................Page 46
Figure 3.31: Value map of Poca Snack. .....................................................................Page 47
Figure 3.32: Price index in Potato chip 2011. ........................................................Page 48
Figure 3.33: Price index in Extruded snack 2011. .................................................Page 48
Figure 3.34: Price index in Peanut 2011. ...............................................................Page 49
Figure 4.1: Poca BCG Matrix. ...............................................................................Page 54
Figure 4.2: Poca snack products life cycle. ...........................................................Page 58
Figure 4.3: A vertical marketing system of Poca Snacks. .....................................Page 66
TABLE
Table 3.1: GDP Real Growth rate and Inflation rate, CPI Year average (%). ........Page 16
Table 3.2: Pocato chip Brand Equity 2011. ...........................................................Page 49
Table 3.3: Extruded snack Brand Equity 2011 ......................................................Page 50
Table 3.4: Peanut Brand Equity 2011 .....................................................................Page 50
Table 4.1: Poca BCG Matrix. ................................................................................Page 54
Table 4.2 Marketing Mix for Poca snacks. ............................................................Page 59
Table 4.3: Poca snacks’ targeting ..........................................................................Page 60
Table 4.4: Poca snacks’ positioning. .....................................................................Page 61
Table 4.5: Poca snacks pack sizes and flavors. ......................................................Page 62
1
1
CHAPTER 1: INTRODUCTION
1.1 RATIONALE OF THE STUDY
It is expected that sweet and savory snack’s performance in Vietnam will be good given
increasing consumer demand and improved living standards. People will consume all kinds
of snacks and indulgence food in general and potato chip in particular. However, due to the
fact that per capita consumption for sweet and savory snacks, which called snack market,
in Vietnam is still relatively low compared to neighboring countries, the potential for
market expansion in the near future is huge. Better economic condition will revive
consumers’ confidence in spending which is another important factor to drive sales growth
of this sector. Therefore, this market is really attractive and it should be invested in more to
create a bigger market size.
Although joining quite late in Vietnam market and not strong in FMCG (Fast moving
customer goods) distribution, Poca, a brand of Pepsi International, increases significantly
and becomes one of big players in Vietnam snack market. This is the reason why I think
Poca snack categories enough ability to undertake to make the total snack market develop
in the future.
1.2 OBJECTIVE OF THE STUDY
The project will give readers the overview of the snack market. It also identifies the key
factors which Poca snack categories could take advantages in its market and indicates
sustainable strategies to apply from 2012 to 2015.
1.3 SCOPE AND LIMITATION
The project mainly studies on sweet and Savoury snack market, which is contributing
considerable sales of Poca snack categories in particular and Pepsi International in general.
2
1.4 RESERCH METHOD
The project uses the primary data, including Sweet and Savory Snacks in Vietnam and
packaged Food in Vietnam of Euro - monitor International in November 2010, Notebook
of Nielsen and other databases on Internet and. They are useful not only for comparing
chips to other categories in Sweet and Savory Snack but also for supplying Vietnamese
picture in Economy and Social situation.
Furthermore, it uses the secondary data, Retail Audit Report (Nielsen, 2011) to have the
comprehensive potato chip market view in Vietnam in general, the Poca situation in
particular. It also uses Pepsi International internal data in order to understand more the
Poca brand and their competitors.
Next, this project still uses the research report about target customer’s behavior and
attitude in snack in Ho Chi Minh City. This could a good base to make us understand more
about them, the reason why they use snack, and what they expect about snack products.
There are 200 questionnaires delivered via email and in direct to the respondents living in
Ho Chi Minh City. Besides, they are the main targets of snack product, including Schoolaged children (3 – 14 years old), Teenagers (15-19 years old) and Young adults (20-29
years old). The response is 120. After filtering, a number of questionnaires were eliminated
due to many missing values. The data were based on 100 qualified questionnaires – the
sample for analysis.
1.5 STRUCTURE OF STUDY
The project consists of four chapters. The project has the following structure.
Chapter 1 introduces the project basic, such as rationale of the study, objectives, limitation
of the research, and research method.
Chapter 2 mentions the theoretical foundation of marketing strategies.
Chapter 3 talks about the Pepsi International Company and Poca snack information. It
also supplies with market overview, such as the snack market, the competitor situation, the
customer insight and the Poca S.W.O.T analysis. All of them are strong foundation to set
the objectives and strategies.
Chapter 4 deals with its objectives and strategies to gain these objectives for the period
2012 – 2015.
3
2
CHAPTER 2 - LITERATURE REVIEW OF
MARKETING STRATEGIES
2.1 CONCEPT OF MARKETING STRATEGY
2.1.1 Definition of marketing strategy
Strategic Marketing plan is a plan that describes how a firm will adapt to take advantage of
opportunities in its constantly changing environment, thereby maintaining a strategic fit
between the firm’s goads and capabilities and its changing market opportunities (Kotler,
1999). It means Marketing Strategy is a marketing mix which designed for and aimed at a
specific target market in order to achieve advantage for the organization through its
configuration of resources within a challenging environment, to meet the need of markets
and to fulfill stakeholder expectations in the long-term.
Urban (1990) said that Marketing strategy requires a definition of the market domain in
which the company will compete and a statement of how utility and value will be created
for customers through product and service offerings. Recognizing customer needs and
filling them better than competitors is the core of successful marketing strategy.
Marketing strategies usually include the following dimensions (Dalrymple and Parsons,
2000): (1) the product or service market in which you expect to compete; (2) The level of
investment needed to grow, maintain, or milk the business; (3) The product line,
positioning, pricing and distribution strategies needed to compete in the selected market;
(4) the assets or capabilities to provide a sustainable competitive advantage.
2.1.2 Marketing strategy process
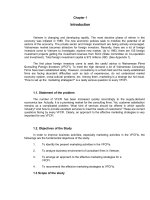
Strategic planning sets the state for the marketing plan. The figure 2.1 will illustrate the
Marketing strategy process. It begins with its overall purpose and mission. These guide the
formation of measurable corporate objectives. A corporate audit then gathers information
4
on the company, its competitors, its market, and the general environment in which the firm
competes. A SWOT analysis gives a summary of the strengths and weaknesses of the
company together with the opportunities and threats it faces.
Next, headquarters decides what portfolio of business and products is best for the company
and how much support to give each one. This helps to provide the strategic objectives that
guide the company’s various activities. Then each business and product unit develops
details marketing and other functional plan to support the company wide plan. Thus
marketing planning occurs at the business unit, product and market levels. It supports
company strategic planning with more detailed planning for specific marketing
opportunities.
Figure 2.1: Strategic planning process.
Define the
mission
Estapblish
strategic
objectives
Company level
Design the
business
porfolio
Make plans,
marketing
strategies and
orther stratgegis
Business unit, product
and market levels
Sources: Principles of Marketing (Kotler 1999).
2.2 MARKETING STRATEGIES
2.2.1 The Competitive strategies
According to the Arthur D, Little consulting firm, a firm can work on four competitive
positions for its target market. The market leaders possess 40% market share, the market
challengers have 30 % market share. Another 20 % and 10 % is occupied by the market
follower and market niches respectively.
2.2.1.1 Market leader strategies
Market leader is one who has the largest market share in the relevant product market. The
market leader usually leads the other firms to change prices, introduce new products works
on distribution coverage and other promotional activities. The leader paves the way to take
5
up challengers for the competitive from. There are three main strategies which market
leaders could apply.
Expanding the total market.
The dominating firm can expand its market share by identifying new users, new uses for its
products and more usage (convince people to use more per occasion). The Johnson &
Johnson brand is a typical example for the new users. Most people know Johnson &
Johnson is the brand for children. However, in recent years, it expands their target
customers by communicating that women could use its products if they would like their
skins soft like children skin. P/S brand will good example illustrates to more usage. In the
past, Vietnamese usually brushed their teeth once a day. After that, P/s, a toothpaste brand,
communicates that if people would like to have good tooth, they should brush 3 times a
day. This campaign made not only P/S but also other toothpaste brands increased their
sales significantly.
Defending market share.
The marketer while trying to expand the total market share must defend its current business
against the immediate competitors. There are six defense strategies that a dominant firm
can adopt to depend its market share.
(1)The position defense strategy: the firm builds a strong position around one’s territory.
Simply defending one’s current position or products rarely works.
(2)The flank defense strategy: when trying to hold its overall position, the market leader
should watch its weaker flanks closer. Smart competitors will normally attack the
company’s weaknesses.
(3)The preemptive defense strategy: the firm should launch the product before the
competitor starts its offence against the leaders.
(4)The counter defense strategy: the market leaders respond only when they have been
attacked by their competitors. The leader will not remain cool in the face of a competitor’s
price cut promotion activities, product prevent and sales territory invasion. The leader
worked on the strategic choice with the attackers by launching a serious marketing
program, thus the cutting the attackers base of operation itself.
6
(5)The mobile defense strategy: the marketer depends aggressively on their own territory
more than the leader does. Here the leader stretches its area of operations over many new
territories so as to serve for the future. It usually does through market broadening and
market diversification.
(6)The contraction defensive strategy: When the companies can no longer depend all their
own territory, because of competitors, then the best action could be “strategic with
drawal”. This means the companies do not go for complete market abandonment but with
drawing from the weaker territories and strengthening the strong territories.
Expanding the market share.
The leaders can improve their profits by increasing their market share. It is vital to identify
the variables offending the profits. In fact, gaining increased market share depends upon
the strategy the companies are adopting from time to time.
2.2.1.2 Market – challenger strategies
Companies that have occupied second or third position in an industry are called as runner
up. Since these firms attack other competitors more aggressively to gain market share are
called market challengers. To fulfill above, the companies can make use of the five
following attack strategies.
(1) Frontal attack
Frontal attack is also called as “head on” attack, which means it hits right against its
opponents strengths than its weaknesses. In frontal attack, the firm matches its competitors
product, advertising price etc. here, the firm which has greater manpower resources will
win the game, but if the defender has greater efficiency and holding a huge market share,
this may turn out to be a master stock.
An alternative to pure frontal attack is that the market challenger can launch a modified
frontal attack by cutting its price from that of the competitor product. In such instances,
these can work if the market leader also does not reduce the price and convince the market
that it is better sold when the price is lowered but product is quite equal to that of the
competitors.
7
(2) Flank attack
Here, the defender is strongest where it expects to be attacked. The attacker or aggressor
may attack the strong side of the defender. In the marketing sense, flank attack is very
attractive to the aggressor when the resources are less than the opponents.
In flank attack, the aggressor firstly spots the areas where the opponent is under
performing (geographical attack); secondly, it covers the unconverted market needs that is
yet to be served by the competitors (leaders). Flank attack helps the market challenger
shifts in market segments and develops strong segments.
(3) Encirclement attack
The market challenger attempts to capture a wide slice of the defender’s territory. It means
attack on several fronts, so that the defender protects its front sides and rear
simultaneously. The main intention of the aggressor is to serve the market everything that
defender and believes that a swift encirclement will break the goodwill of the opponents.
(4) By-pass attack
This strategy is the most indirect. It means by passing opponents and attacking easier
markets, with the available resource. This strategy calls for (a) Diversification into related
products, (b) Diversification into new geographical markets, (c) Look for are technologies
for it existing product lines.
(5) Guerrilla attack
It means intermittent attacks on an opponent’s different territories. This includes price cuts,
incentives promotional activities and occasional legal actions. The main aim of using such
strategy is to hold a permanent position in the opponents’ territory. This is usually
practiced by smaller firms and most suitable for financially weak challengers. Guerrilla
campaign can be very expensive, but it is more a preparation for war than war itself.
2.2.1.3 Market follower strategies
Product imitation might be profitable as compared to product innovation. Therefore, there
are many companies which prefer to follow rather than to challenge the leader. No wonder
the leader can still stay in the battle to match quickly the followers product attributes thus
by diffusing the attack. In such case, the follower must know how to retain the existing
customers and win over competitive customers.
8
Each follower brings distinctive advantages to its target segment in term of location
services and financing. Since the follower may be a major target of attack by challengers, it
must always keep it manufacturing cost low and produce good quality products with
service back us. It should also enter never markets as opportunity exists.
The followers do have some definite goals and defined growth path; they may not be a
carbon copy of the leader. The four follower strategies are:
(1) Counterfeiter: The follower duplicated the leader’s product and package and sells it in
black market or through non-reputed leaders.
(2) Cloner: The following (or) Cloner copies the leader’s product, distribution, and
advertising. The Cloner product and packaging may resemble the leader’s product but the
brand name is slightly different scubas “Reynolds” instead of “Reynolds”.
(3) Imitator: The follower (or) imitator copies some things from the leader’s product but
maintains differentiation through packaging, advertising and pricing. In fact, the imitator
helps the leader the charge of monopoly.
(4) Adaptor: The follower (or) adaptor takes the leader’s products and improves upon
them. Here the adopter will sell in different markets to avoid direct co petition by the
challengers or leaders. According to Juck Welch CEO of GE, each business unit must
reach number one or two position in its market as otherwise follower ship is not advisable
or rewarding.
2.2.1.4 Market niches strategies
The follower can become a leader in a small market or niches particular market rather than
following the leader, or competing with largest firms. Niching also bears a certain amount
of risk since the larger firms may invade and turnout niche into a super segment.
The key idea in nichermanship is specialization (Kotler, 1999). The firm has to specialize
along market, customer, product or marketing mix lines. The success of niche always lies
in specialization. The nichers usually play following specialist roles.
(1) End-use specialist: the firm specializes in serving one type of end-use customer. For
instant, a law company specializes in criminal law.
(2) Vertical-level specialist: the firm specializes at some level of the production
distribution cycle. For example, Innity digital company specializes in book ad banners on
internet for global advertising companies in Vietnam.
9
(3) Customer-size specialist: the firm concentrates on selling to small, medium or large
customers. Many nichers specialize in serving small customers neglected by the large
companies.
(4) Specific-customer specialist: the firm limits its selling to one or a few large customers.
For example, Teal makes tables and chairs for hospitals.
(5) Geographical specialist: the firm sells only in a certain local a certain locality, region
or area of the world.
(6) Product or feature specialist: The firm specializes in producing a certain product,
product line or product feature.
(7) Quality – price specialist: the firm operates at the low or high end of the market. For
example, Ha noi mart always offers products for working class by cheap price strategies.
(8) Service specialist: the firm offers one or more services not available from other firm.
For example, Dominos pizza is the first pizza company specialize in offering delivery
service by order online and calling.
2.2.2 The Product life cycle strategies
Depending on the stage of the product life cycle, the marketing strategy should vary to
meet the changing conditions. The marketing mix consists of the product, promotion, price,
and distribution. Each element must change with the product life cycle if the company
expects to maximize sales and profits. It is important to note that as products move through
each stage of the life cycle, they should be monitored and re-evaluated in terms of reducing
both production costs and the time it takes to make a product or service profitable with its
new position. Strategic options for products during the product life cycle are examined
below.
2.2.2.1 Strategies for the introductory phrase
The introduction stage starts when the new product is firstly launched in the market. There
are some features to recognize this stage. Firstly, the growth rate and the size of the market
are low. There are normally one or few companies, the pioneers of this category while the
consumers’ need has just been appeared and the consumers have a low awareness in this
kind of product. Secondly, the profits are negative or low because of the low sales, high
10
distribution and consumer promotion expenses. If these pioneers are successful in building
consumers’ demand, it makes an attractive segment to others.
At this period, the company usually runs these strategies to develop this stage, as follows:
the first priority is to increase brand awareness and explain the function of products by
advertising, Publish Relationship (PR), sales forces. On the other side, the company also
encourages product trial by sampling, promotions as well as brand activation. In addition,
the products are distributed in selective channels (general trade and modern trade) where
its visibility is highest for selling. Consumer’s price can be high or low depending on the
initial strategy of the firm.
2.2.2.2 Growth strategies
Growth stage is a stage which product starts strongly developing in the market, including
costs reduced due to economies of scale; Sales volume increases significantly; Profitability
begins to rise; Public awareness increases. At this stage, competition begins to increase
with a few new players in establishing market. The increasing competition leads to price
decreases.
At this stage, the product management team usually runs these strategies to reinforce the
rapid development of their product as follow: (1) Engage in product modification; (2)
Build selective demand; stress differentiation; (3) Move toward intensive distribution.
2.2.2.3 Strategies for Maturity
Maturity is a period of slowdown in sales growth because the product has achieved
acceptance by most potential buyers. Profits level off or decline because of increased
marketing outlays to defend the product against competition.
At this stage, the sales growth of the product will decrease and it will enter a maturity stage
because there are many producers with many products in the market. In turn, this
overcapacity leads to greater competition. Some strong competitors start to go down prices,
grow up their advertising and sale promotions, and increase their Research and
Development (R & D) budget to innovate the best versions of the product. As a result, the
profit is dropped. Besides, the weaker competitors begin to lag behind and soon drop out of
the industry, eventually containing only well-done competitors.
11
At this period, the company has to run these strategies to maintain their product
development. The general strategies in mature market are similar to those in growth
market; they depend on the relative market position of the product. If the product is
committed for an extended time period, the objective is usually to invest just enough
money to maintain share. Although many products in the mature stage appear to remain
unchanged for long periods, most successful ones stay alive through continually evolving
to meet changing consumer needs. Product managers should do more than simply ride
along with or defend their mature products - a good offensive is the best defense.
They should stretch their imagination and look for new ways to innovate in the market
(market development), or to modify the product (product development) and the marketing
mix (marketing innovation).
• Market Development:
Here, the company tries to increase the consumption of the current product or it may want
to reposition the brand to appeal to a larger or faster-growing segment. It looks for new
users or market segments which the company is not currently serving, as when “clear”
targeted the market for men with its shampoo – “clear men” besides the current market
“clear for women”.
• Product Development:
The product manager can also modify the product by changing characteristics, such as
quality, features or style in order to attract new users and to inspire more usage. It might
improve the product's quality and performance - its durability, reliability, speed, and taste.
Or, it might add new features that expand the product's usefulness, safety or convenience.
2.2.2.4 Strategies for decline
Decline stage is defined as the product life-cycle stage in which a product’s sales decline.
Some characteristics shown in this period as follows: (1) During this stage of any product,
sales are diminished and consumers’ taste shifts to a newer or better offering; (2) A decline
stage may be gradual or has a sudden drop and continues this way. Some decline stages
may not continue for too long while others may decline to zero sales and stay at zero.
During the decline phase, the firm generally has three options: Maintain the product in
hopes that competitors will exit. Reduce costs and find new uses for the product by giving
a short promotion time to specific segment of target audiences; Harvest it, reducing
12
marketing support and coasting along until no more profit can be made. If in the
introduction and growth stages, activities “Above the line” like mass media advertising is
used as a key strategy to promote the product, in the decline stage, activity “below the line”
like event organization (ex: re-launch product with new label) which costs not much and
doesn’t take in a long period is pushing to seize and maximize the revenue as much as
possible; Discontinue the product when no more profit can be made or there is a successor
product.
2.2.3 The product line strategies
Product line management is the work which every marketing manager has to do. The
product variants may be developed to appeal to different market segments. Otherwise, it
may be developed to compete more directly with major competition. Product lines are also
developed in order to gain additional shelf space with distributors (Winer, 2000).
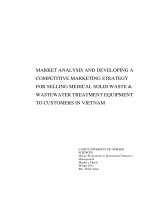
The BCG model is a well-known portfolio management tool used in product life cycle
theory. BCG matrix is often used to prioritize which products within company product mix
get more funding and attention. The BCG matrix is shown in Figure 2.3.
Figure 2.3: The BCG growths – share matrix.
Sources: The principle of Marketing (Kotler 1999)
The two dimensions, market share and market growth, incorporate the following
definitions: (1) the market share is defined as relative share: the ratio of the share of your
product in the market segment to the next largest competitors. (2) Market growth is the
13
sales growth rate in the served market. The dividing line between high and low can be
based on grow national product or gross domestic product growth rates, inflation, and more
subjective criteria.
By dividing the growth-share matrix as indicated, for type of SBU (Strategic business unit)
can be distinguished: (1) Stars are high-growth, high-share business or product. The often
need heavy investment to finance their rapid growth. Eventually, their growth will slow
down, and they will turn into cash cows. (2) Cash cows are low-growth, high-share
business or products. These established successful SBUs need less investment to hold their
market share. Thus they produce cash that the company uses to pay its bills and to support
other SUBs that need investment. (3) Question marks are low – share business units in high
– growth markets. They require cash to hold their share, let alone increase it. Management
has to think hard about question marks – which ones they should build into stars and which
on ones they should phase out. (4) Dogs are low – growth, low – share, businesses and
products. They may generate enough cash to maintain themselves, but do not promise to be
large sources of cash. (Kotler, 1999).
According to Kotler 2000, there are four strategies can be pursued:
(1) Build: the objective here is to increase market share, even forgoing short-term earnings
to achieve this objective if necessary. Building is appropriate for question marks whose
market shares must grow if they are to become stars.
(2) Hold: The objective in hold strategy is to preserve market share, an appropriate
strategy for strong cash cows if they are to continue yielding a large positive cash flow.
(3) Harvest: The objective here is to increase short-term cash flow regardless of long-term
effect. Harvesting involves a decision to withdraw from a business by implementing a
program of continuous cost retrenchment. The hope is to reduce costs faster than any
potential drop in sales, thus boosting cash flow. This strategy is appropriate for weak cash
cows whose future is dim and from which more cash flow is needed. Harvesting can also
be used with question marks and dogs.
(4) Divest: The objective is to sell or liquidated the business because the resources can be
better used elsewhere. This is appropriate for dogs and question marks that are dragging
down company profits.
14
In conclusion, all companies need strategies to meet changing markets. No one strategy is
best for all companies. Each company must find the way that makes most sense, given its
situation, opportunities, objectives and resources. Marketing plays an important role in
strategic planning. It provides information and other inputs to help prepare the strategic
plan. Strategic plan guides marketing, which must work with other departments in the
organization to achieve strategic objectives.
15
3
CHAPTER 3 - THE MARKET ANALYSIS
3.1 MARKETING ENVIROMENT ANALYSIS.
3.1.1 Macro-environment analysis
3.1.1.1 State of the world
There was a world dark and complex landscape in 2011, not only in economy but also in
politics and society.
First, political crisis in North African & Middle East, including Algeria, Egypt, Liberia,
and many countries took place extremely complex and serious in the first days 2011. There
were many waves of anti – governments and presidents spreading and staying along many
weeks.
Second, Debt crisis in USA and Euro countries brought about the crisis in bank and growth
in many countries. Next, many demonstrations happened due to discrimination policies
between the rich and the poor. The Occupy Wall Street Protest is a typical example. It took
place in USA in 17th September, 2011 first. After that, it spread in England, German, Italia,
Korea, Australia, Japan and other countries.
Finally, the multi-polar world is formed. Although USA is still the biggest powerful
country in the world, it is decreasing the ability threaten other countries. China becomes
the second powerful country. European Union becomes economic agent which bigger than
USA. Africa Union appears. The national association of Southeast Asian is developing,
India and Brazil allied.
As a result, it makes today’s world overlapping and competing legal rights, the growth of
development countries decreasing, the cost of oil, food, raw material, and the high
unemployment rate increasing.
16
3.1.1.2 State of economic development in Vietnam
In 2011, Vietnamese economy faced many challenges due to the influence of the world
economy and bad monetary policy, budget deficit in high rate, irrational investment
structure and economy structure and other reasons. Therefore, these brought the following
status.
First, our economic growth is downtrend in recent years. The table 3.1 shows that the GDP
in 2011 was 5.89%, a decrease of 5% from 2010 to 2011and a decrease of 30% from 2005
to 2011.
Table 3.1: GDP Real Growth Rate and Inflation Rate, CPI year Average (%)
2005
2006
2007
2008
2009
2010
2011
GDP
8.4
8.2
8.4
6.2
5.3
6.2
5.89
CPI
8.3
6.6
8.5
23.1
6.7
11
18.1
Sources: IMA Asia Report 2011
Second, high pressure in inflation has created uncertainty in the confidence of consumers
and enterprises, which showed clearly in Table 3.1. It can be seen that the rate of inflation
increase significantly in recent year. In 2011, the CPI in 2011 was 18.1 %, an increase of
63% between 2010 and 2011 and an increase of 118% between 2005 and 2011.
Moreover, there was an increase in many filed of society, such as Electric price (15 %),
Gasoline price (18 %), in Gas price (4 %), Unemployment rate (2.27%), and Sugar cost (15
%).
As a consequence of these, consumers worry more about their life, consider carefully
before spending goods, and cut down the unessential goods while manufacturers face many
difficulties in production cost, labor cost, product output, competition in the struggles to
gain customers.
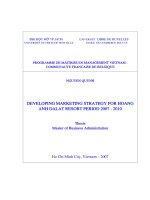
3.1.1.3 Demography in Vietnam
Vietnam population in 2009 illustrated in Figure 3.1 is around 86 million people and it will
add around 1 million per year. In addition, Vietnam, a young population, over 50 % of
them is under 30 years old. It is a convenient condition for youth brands invest in and
exploit.
17
Besides, the middle class is growing from 7 million households in 2003 to an estimated 25
million in 2013. It means customers will be willing to spend more money on qualified food
and care products. Driven by rising incomes and the desire for better living standards, the
health and awareness trend in Vietnam is expected to move along with the global trend and
continue developing further in the future. As most consumers will have better education,
together with continuous efforts form the government and manufactures to raise people’s
awareness about health issues, they are expected to have better and more sophisticated
knowledge about health and wellness, and have higher demand for these products.
The target market of this trend, in short-run, however, would remain limited to the major
cities, such as Ho chi minh and Ha noi. It is because, firstly, they are more highly educated
and accessible to updated information about health form various forms of media, including
the internet, Secondly, higher disposable income also allows them to afford premium
products with extra health benefits.
Figure 3.1: Total Vietnam Population 2009
Source: U.S Central Bureau, International Database, 2009