Petroleum geostatistics
Bạn đang xem bản rút gọn của tài liệu. Xem và tải ngay bản đầy đủ của tài liệu tại đây (26.87 MB, 48 trang )
Chapter 1
The Role of Geostatistics in
Reservoi r Modeli ng
1.1 Why Reservoir Modeling?
From the time of discovery of a hydrocarbon basin to the production of the last drop of recoverable oil in a mature field, models playa central role in understanding and predicting
a reservoir's key geological, geophysical, and engineering components. Reservoir modeling is never a goal on its own. The depth of analysis and complexity of the model built is
driven successively by practical exploration, appraisal, and reservoir-engineering questions. Good model-building practices focus on the end goal, whether it is the estimation of
original oil in place (GOIP), the optimal placement of a well, the design of surface facilities, the design of secondary-recovery or enhanced-oil-recovery methods, or the prediction
of water breakthrough, to name a few.
There are many benefits to model building. Most importantly, models are ideal gateways
for integrating expertise from different fields and aggregating data from various sources.
Such a focus will call for mining relevant information (which is different for each goal addressed) from the available data.
The subsurface rarely reveals all its secrets. Reservoir models can only mimic reality.
The complex, heterogeneous subsurface medium, compounded with the indirect and incomplete access provided by measurement tools (be it through well logging, seismic surveys, or formation testing), rarely (if ever) provides a full and complete understanding of
subsurface heterogeneity. This incompleteness forces the modeler to "interpret" beyond the
existing data set. Such interpretation results in a set of subjective model decisions that cannot be tested against facts. Subjectivity in reservoir modeling is inevitable, but it provides
an opportunity to add expertise that both ties reservoir data together and allows the modeler to go beyond.
An important contribution of geostatistics to 3D modeling is that it forces the modeler to
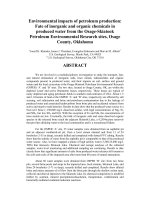
make explicit critical, subjective model decisions. Consider the example in Fig. l.la, in
which the goal is to interpolate the porosity between porosity measurements obtained from
five wells. An off-the-shelf interpolation method may provide the answer in Fig. Lib.
However, Figs. Llc through LIe provide alternative models generated with the various
geostatistical techniques described in this book. All models fit the data equally and create
some degree of continuity near these data. Each model, however, displays a different type
2
The Role of Geostatistics
Petroleum Geostatistics
(b) Interpolation of
five porosity data
(a) Five porosity data
0.23
1\1
(c) Alternative Modell
3
Many sources of data are available for reservoir modeling. In this book, the following
categories are considered:
.
0.23
lID
in Reservoir Modeling
0.06
@
Geological Data-any
data related to the style of geological deposition:
0
Core data-porosity,
permeability, and relative permeability per facies.
0
Well-log data-any
suite of logs that indicate lithology, petrophysics, and fluid
types near the wellbore.
Sedimentological and stratigraphic interpretation.
Outcrop analog data.
Geophysical Data-any data originating from seismic surveys:
Surfaces and faults interpreted on 3D seismic.
Seismic attributes.
0
Rock physics data.
Time-lapse 4D seismic data.
0
0.58
.
.
0.01
0
0
0
0
(d) Alternative Mode12
(e) Alternative Mode13
0.5000
0.4000
0.3000
0.2000
0.1000
0.0
Fig. 1.1- The same five porosity measurements (top left) can be interpolated into a wide variety
of numerical models depending on the assumed spatial relationship between porosity values.
of geological continuity. Underlying each of these models, there is a decision, whether implicit or explicit, about the reservoir continuity. Hence, in choosing a specific interpolation
algorithm, one is injecting more than just five porosity data into the resulting model! An interpretation about spatial continuity is used. Adopting blindly the reservoir continuity type
implicit to an interpolation package is no less consequential than stating explicitly the specific continuity model one wishes to fit to the data. Neither is there any universal criterion
to judge which of the four models in Fig. 1.1 reflects the subsurface heterogeneity most accurately. The assumed relationship between the data and the unsampled values (in other
words, the assumed style of geological continuity) is termed the geological continuity
model in this book.
1.2 3D Reservoir Modeling
1.2.1 Reservoir Data. Three-dimensional reservoir modeling comprises a broad field of
expertise in which geostatistics is one of several key components. The aim of 3D modeling
is to provide one or more alternative 3D numerical models that aim to represent those geological, geophysical, and reservoir-engineering aspects of the subsurface that matter for the
study goal at hand. These numerical models are used to estimate key reservoir parameters
such as OOIP, predict production performance, and provide uncertainty statements when
needed.
.
0
Reservoir-Engineering
Data-any
data related to the testing and production of the
reservoir:
0
Pressure/volume/temperature
(PVT) data.
0
Well-test data.
0
Production data.
A 3D reservoir model is built using all available knowledge about the reservoir. Sources of
knowledge are reservoir data and the expert interpretation of that data. Modeling building
consists of integrating both sources.
1.2.2 Measurement Scale, Modeling Scale, and Missing Scale. One goal of 3D modeling is to represent aspect(s) of the 3D spatial variation of reservoir properties. Heterogeneity spans from the pore scale to the basin scale. A complete 3D model will provide a full 3D
description of large-scale faults, smaller-scale fractures, layering, large-scale lithological
variation, reservoir permeability, porosity, and saturations. Ideally, one would provide such
a 3D model at the highest resolution possible. Such an extremely detailed reservoir model
cannot be practically generated, nor is it required. Modeling the spatial variability of
permeability in great detail is never a goal on its own; it is always related to the particular
reservoir-engineering question one wants to address.
The various data sources listed above inform the reservoir heterogeneity at different
scales (see Fig. 1.2). Some scales of observation are well understood (e.g., the physical dimensions of a core); others may have a variable or poorly known scale or a scale that requires interpretation (e.g., well-test and production data). One of the major challenges in
3D reservoir modeling is to bring all data, each at its own scale of information, into a single numerical model. It is relatively easy to construct a reservoir model using only one scale
of observation (e.g., building a model using seismic data only). This approach would ignore
or at least limit the contribution of other data with different scales of observation. The real
challenge is to use all data simultaneously, accounting for their various scales and degrees
of accuracy.
Any 3D modeling is performed on a grid composed of cells that have a certain dimension: the model resolution. This resolution (also termed "volume support" in geostatistics)
is simply defined as the size of the individual grid cell that makes up the 3D numerical
4
,
Petroleum Geostatistics
The Role of Geostatistics
I
I
I
I
I
I
I
I
I
I
I
I
I
I
106
I
I
I
I
I
108
II
:,
I
'1012
Missing scale
.'
::
I
I
I
I
I
I
I
I
I
I
I
I
I
I
:
;.:
::
:,
II
I
I
:
:
.~~~
100 ft x 100 ft x 1ft!! simulation model!
[12,000 ft x 12,000 ft x 300 ft
.
300 ftT x 300 ft x 10 ftj
i-II
I
: Upscaling
:
I
I
I
I
I
I
I
I
I
In
I
I
Structural model
I
3Dg~~~cl~;;r
modell!Rese~oir
flO\~=ull~~
I
:
:
I
I
Flow simulation
I
.:
I
Horizon and fault network
Fig. 1.2-Comparison of the scale of observation, the typical resolutions of geocellular and
reservoir flow-simulation models, and the operations between the various models. The reference unit scale/resolution is the core support. Ifthis reference resolution is on the order of 1,
then a 3D geocellular model is typically 6 orders, a flow-simulation model 8 orders, and the entire reservoir 12 orders of magnitude larger. The scales of observation for well-log, seismic, and
production are only indicative.
model. In case that size varies spatially, one can define it as a typical or average grid-cell
size. To easily include small-scale data from cores and well logs, one often constructs models on a high-resolution grid. However, given the size of a core, even a small reservoir
would require several billion grid cells to allow direct inclusion of core data into the model
grid. A grid-cell size, considerably larger than the dimension of the smallest-scale data, is
thus considered to generate what is called the high-resolution 3D geocellular model (see
Fig. 1.2). This means that finer-scale heterogeneity within each individual high-resolution
grid cell is ignored. Any individual core measurement is typically assumed to be representative of the entire grid cell in which it is located. A "missing scale" exists between the finest
measurement scale and the model resolution. The missing scale is hidden through an implicit scaleup of the core data to the dimensions of the grid cell, a scaleup consisting of four
to five orders of magnitude (see Fig. 1.2). Most current 3D models ignore that missing scale
or model it roughly and implicitly through permeability anisotropy (kv:kHratios).
The dimensions of the geocellular model depend on the study goals and the available
data. On the basis of the well-log sampling along vertical wells, a vertical dimension equaling 1 to 3 ft is chosen. On the basis of the resolution of 3D seismic, a horizontal resolution
of approximately 100 ft is often selected. Today, high-resolution numerical models typically are composed of 1 to 50 million cells, depending on the size of the reservoir, the number of wells, and the level of detail desired.
1.3 Hierarchy in Model Building
1.3.1 Building a High-Resolution 3D Geocellular Model. Given the different scales of
heterogeneity existing in reservoirs and the scale difference between the various data
sources, a hierarchical approach is used to build 3D numerical models. Fig. 1.3 provides a
flow chart for building a high-resolution 3D geocellular model. The steps are as follows:
in ReseNoir
Ij\
0
5
Modeling
00
o
DeposltJonaI gn d
(Cartesian box)
)(
interpreted from 3D seismic
~
3D stratigraphic
I
I
I
I
I
I
I
I
grid
Q)Facies
model
I€)
I Petrophysical
I (porosity
~
Upscaling and
reservoir flowsimulation model
@
\
and permeability)
I
I
I
1
)
I
I
I
model
High-resolution
geocellular model
Fig. 1.3-Step-by-step workflow for building a high-resolution geocellular model (data provided
by Guillaume Caumon, School of Geology, Nancy).
6
Petroleum Geostatistics
Step 1. Establish the major geometry and architecture of the reservoir in terms of horizons
and faults, The positions of horizons and faults are determined from 3D seismic data and
well markers.
Step 2. Build a 3D stratigraphic grid from the previous structural framework. This grid is
likely nonuniform and may be structured or unstructured.
Step 3. From the stratigraphic grid, a Cartesian grid is built, ideally in the original depositional space. This grid provides the coordinate system for the original depositional environment. A one-to-one relationship is established between each grid cell in the Cartesian grid and in the stratigraphic grid. All data, well paths, well logs, and 3D seismic data
are imported into that Cartesian grid.
Step 4. The Cartesian grid is populated with facies rock types. Outcrop data and sedimentological models provide information on the style of facies architecture; well-log, core,
and seismic data provide local constraints on the spatial distribution of these facies
types.
Step 5. Within each facies type, porosity is assigned to each grid cell of the Cartesian grid
on the basis of well-log and core data. A 3D permeability model is then derived from the
porosity model. Porosity is usually determined first because the data on porosity are
more reliable and abundant than permeability data.
Step 6. The petrophysical properties are mapped back into the stratigraphic grid to provide
a high-resolution 3D geocellular model.
Geostatistical methods are always applied in the Cartesian grid (i.e., in the original depositional environment). In this way, one can account for geological shapes and dimensions
known to exist at the time of deposition and for distances undistorted by folding and faulting. Creating such a Cartesian grid from a complex structural model containing faulting,
folding, and erosion events is not a simple task. That task is not addressed in this book.
1.3.2 What About Production Data? What is lacking in the flow chart of Fig. 1.3 is the
production data and their place in reservoir modeling. Engineering decisions cannot be
based on numerical models that do not match production data. Production data provide a
direct observation of the ultimate modeling goal: reservoir flow performance. Any method
for integrating production data into 3D numerical models will call upon a flow simulator.
However, flow simulations generally are not feasible at the resolution of the geocellular
model.
Current practice consists of first upscaling the reservoir property model to a grid resolution on which flow simulation is feasible. This 3D numerical model is termed the reservoir
flow-simulation model. Next, this coarsened model is perturbed until it matches production
data. While this may achieve the goal of matching historical production data, it does not address the real challenge put forward earlier, namely to bring all data simultaneously into a
single numerical model. In this traditional approach, one ends up with two models: a geologically consistent, high-resolution geocellular model that does not match historical performance and a geologically inconsistent reservoir flow-simulation model that does match
history. This inconsistency is addressed at length in this book.
1.3.3 Nomenclature. Because this book crosses many disciplines, confusion may arise
around commonly used terms such as model, simulation, grid, or scale vs. resolution, to
The Role of Geostatistics
I
I
I
,
J
,
!
1
in Reservoir Modeling
7
name just a few. This section describes briefly the various terms used in this book and also
points to some alternative understandings used in the various disciplines.
High-resolution geocellular model (or, in short, geocellular model): Used instead of
property model, geostatistical model, geomodel, or even geological model.
Resolution and scale: Resolution is defined simply as the distance between two neighboring grid cells. Scale is used as an abstract term, such in the scale of observation; hence,
it relates to a fuzzy concept. For that reason, high resolution is used instead of fine-scale
grid, and coarsened model is preferred over coarse-scale model.
Structural model: Refers to the set of fault and horizon surfaces.
Support volume: The physical volume scanned or represented by a specific datum. The
support volume of a core plug is well defined, as opposed to the support volume of a seismic attribute.
3D stratigraphic grid: The grid that is built from the structural model; it may be layered,
have pinchouts, or consist of any type of grid cells. In most cases, a logically rectangular
grid, also termed the "i,j,k" grid, is built around the structural model.
Reservoir flow-simulation model: A 3D grid, populated with reservoir properties (petrophysical, saturations, and fluid contacts), that has been coarsened (upscaled) from the
high-resolution geocellular model. For fluid-flow-simulation purpose, the reservoir flowsimulation model also would include all aspects related to flow (i.e., the physics of flow, the
finite-difference/element implementation, PVT properties, etc.). In this book, the reservoir
flow-simulation model refers only to the grid and its petrophysical properties.
Facies is used in many contexts: as rock types (e.g., sand, shaly sand, and mud) or as architectural elements (e.g., channel, crevasse, and levee). A channel may consist of both
sand and mud layers; if that is the case, a differentiation is made between lithofacies and
sedimentary facies. However, their geostatistical treatment is similar; therefore, we will use
the term facies in both contexts. From a geostatistical point of view, a facies determines a
partitioning based on statistical properties (e.g., permeability/porosity statistics).
1.4 What Is Geostatistics?
J
j
1
Before presenting the role of geostatistics in building the geocellular model, we discuss
what is meant by the term geostatistics.
As with any applied science in a continuous state of evolution, geostatistics is not easily
captured by a single, concise definition. Also, the science and its well-established theoretical background should not be confused with the specific algorithms developed for 3D reservoir modeling. Nevertheless, an attempt at a general definition could be made as follows:
"In its broadest sense, geostatistics can be defined as the branch of statistical sciences that
studies spatial/temporal phenomena and capitalizes on spatial relationships to model possible values of variable( s) at unobserved, unsampled locations."
J
)
)
)
1.4.1 Spatial Relationship.
The nonrandomness of geological phenomena entails that values measured close to each other are more "alike" than values measured farther apart. In
other words, a spatial relationship is assumed to exist between such values. In geostatistics,
the term spatial relationship describes many forms of relations among the available data
and the various unknowns. The data may be of any type, possibly different from that of the
variable being estimated. Therefore, to apply geostatistics, one needs to first and foremost
quantify that spatial relationship through a geological continuity model. The simplest pos-
8
The Role of Geostatistics
Petroleum Geostatistics
sible quantification consists of evaluating the correlation coefficients between any datum
value measured at location u=(x,y,z) and any other measured a distance h away. Providing
this correlation for various distances h will lead to the definition of a variogram, which is
one of several models discussed in this book.
The observed correlation between data sampled at various locations is caused by the spatial continuity (nonrandomness) of the underlying geological phenomenon. This correlation allows us to solve one of the classical problems of spatial estimation, namely that of
estimating an unsampled value given some neighboring sample values of the same variable
(e.g., porosity; see Fig. 1.4). In linear geostatistics, the estimate z*(u) at the unsampled location u=(x,y,z) is written as a linear combination of the n related data lena):
2: I\,z(ua).
.
. . . . . . . . . . . . . . . . . . . . . . . . . . . . . . . . . . . . . . . . . . . . . (1.1)
a=l
Two critical questions need to be addressed:
Decision of Stationarity: Which Data Are Retained To Estimate the Unknown zen)?
The decision of which data to pool together to provide the estimate z*(u) in Eq. 1.1 requires, in geostatistical terms, a decision of stationarity. It would not make sense to estimate porosity at a specific location u on the basis of data that originate from a different layer
or fault block in the reservoir with completely different geological (and, hence, porosity)
9
characteristics. In statistical terms, the data must have similar statistical properties. However, one should avoid the temptation to make every single datum value unique! Some form
of pooling of data is necessary for statistical methods to work.
How Should the Weights AaBe Determined? The other question concerns the determination of the weights, Aa' Rather then presenting a mathematical treatment, we present two
guiding principles that govern the determination of these weights:
n
z*(u) =
in Reservoir Modeling
.
Underlying true but unknown porosity field
The underlying geological continuity makes those data values z(ua) that are "closer"
to the target location u more informative than data farther away; hence, close data
should get more weight. One could reasonably assume that any data at considerable
distance from u should get a weight equal to zero. The remaining question to be
addressed lies in the definition of "closeness." Simply defining distance as the
Euclidean distance between u and ua would ignore the specificity of geological continuity. To illustrate this, consider the example of Fig. 104.Although the datum at U2
is farther from the unknown location u than that at Uj, the underlying diagonal continuity makes the datum value at U2more informative. Determining the weights
by inverse distance weighing would not account for any prior knowledge about
spatial continuity. One important contribution of geostatistics is that it incorporates information about spatial continuity into estimates derived from Eq 1.I-type
models.
Data values that are sampled close to each other are somewhat redundant; hence,
each value of such a cluster is less valuable than an isolated datum at the same distance from the unknown. Consider the situation in Fig. 104.The underlying spatial
continuity makes the values sampled at locations u2 and U3 strongly correlated;
hence, they carry redundant information about the unknown at u. These data values
should, therefore, "share" their weight in determining the unsampled value at u; the
isolated data value at location U4need not share its weight; hence, it will carry a
greater weight than that at location U2'
Any information regarding the underlying spatial continuity of the variable under study is
therefore critical in determining the weights Aa.
Kriging is the name for the geostatistical estimation method that takes into account these
two principles when determining the weights Aa. An Advanced Reading Box provides
more information on exactly how this is done. Kriging is but one of many geostatistical
tools that rely on two fundamental principles:
..
Using the spatial relationship between data and the unknown to model the unknown.
Accounting for the redundancy between the data to correctly weigh the information
provided by each datum value.
Fig. 1.4- The underlying geological continuity determines that the data at location u2 is more relevant to the estimation of the unknown at u than the datum at location u1. For the same reason,
the data at locations u2 and u3 are redundant.
All geostatistical tools presented in this book rely on these two fundamental principles,
whether the unknown is the 3D spatial distribution of porosity and the data is 3D seismic,
or the unknown is 3D permeability and the data consists of the oil rate observed at producing wells. Redundancy of the data is as important as correlation between the data and the
unknown. It allows us to give the correct amount of "weight" or importance to each datum
value or data set.
10
The Role of Geostatistics
Petroleum Geostatistics
Advanced Reading Box
Kriging
Kriging is the name used by geostatisticians for a family of generalized least-square
regression methods, in recognition of one of the pioneers of geostatistics, Danie
Krige. Many variants of kriging exist, but all are similar to Eq. 1.1 and rely on the
same principles of data correlation and redundancy. Kriging differs from classical regression, which treats the "predictors" z(oo:) as independent variables, an assumption
that never would hold in modeling a spatial phenomenon. Kriging also differs from
popular interpolation tools such as inverse distance weighing, where the weights /..0:
are taken inverse proportional to the distance between the location 0 of the unknown
and each data location 00:' Inverse distance methods do not account for
.
.
The underlying spatial phenomenon. For example, the distance 10-00:1may be
small, but the vector separating locations 0 and 00: may cross the sedimentation continuity, which makes the datum 00: less relevant.
The redundancy between data. Consider the example of three data configured
as shown below. Inverse distance gives the same weight to each datum (the distances are equal), while kriging provides a shared weight to the two clustered
data.
/..2=1/3
/..2=1/4
0
0
0
eO
/..3=1/3
Inverse
/..3=1/3
0
Distance
0
eO
/..1=1/4
/..3=1/2
0
Kriging
What Kriging Does
Kriging relies on a measure of spatial continuity encapsulated in the variogram (see
Chapter 2), which measures the degree of statistical dissimilarity between any two
values separated by a vector h. This function, y(h), is explained in more detail in
Chapter 2 but in general can be seen as a modification of the Euclidean distance, Ihl,
to account for any specific geological continuity. For example: y(h) may be larger
when h lies along a direction of geological continuity (layers). y(h) is regarded as a
"geological distance."
Kriging is termed the best linear unbiased estimator, which means that among all
linear unbiased estimators, there is on average none "better" than kriging. "Better"
is defined in terms of the averaged squared difference between the true value and the
estimator: error = [z*(o)-z(o)]2. This error is minimized in expected value over all
unsampled locations o. A rather involved mathematical development shows that in
the case of a variable with global mean equal to 0 and variance equal to 1, the kriging weights, /..0:'are obtained by solving the following system of equations:
p(h12)
1
l
p(,,)
p(h1n)
p(h2n)
...
...
...
in Reservoir Modeling
hi}
=separation
11
vector
(distance)between
p(h2n)
..
.
1
P(h'.)]
Data-Redundancy Matrix
X
A2
..
.
An ]
[A'
'--v----'
Weights
=
p(h2o)
..
.
data locations Uiand Uj
hiD
p(hno)
[P(hOOJ]
'-y------'
= distancebetweendata
location Uiand unknown U
Data-to-Unknown
Correlation
where p(h) = l-y(h). The matrix on the left side accounts for the redundancy between data. The vector on the right side accounts for the correlation between data and
the unknown. The resulting weights are then used in Eq. 1.1 to obtain the estimate.
The estimate z*(o) is evidently not equal to the true value z(o); the degree of error is
expressed as an error variance, an average squared error also termed kriging variance:
n
(T~ =
1
-
2:A" p(h"o).
,,~l
1.5 Estimation VS. Simulation
An estimationtechniquelike krigingusesthe assumedspatialrelationship(the geological
continuity model) between the data and the unknown to produce a single best guess of the
unknown. However, when applying this technique to a grid of unsampled values, such as
those shown in the top row of Fig. 1.5, one notices a clear difference between the actual
geological phenomenon and the map of kriging estimates.
The kriging map cannot be identical to the true phenomenon simply because of limited
sample data. More importantly, the spatial continuity displayed by a map of kriged estimates is smoother than that of the true unknown. This observation is shared by any other
spatial estimation or interpolation technique. Consider the reason why: kriging (and other
interpolation methods) attempts to produce a best estimate at each unsampled location. To
obtain an estimate that is as close as possible to the true value at each location, one necessarily will need to be conservative. In a statistical sense, "conservative" means that one
wants to minimize one's losses when making errors. The measure of conservatism applied
in kriging is to make, on average, the squared difference between the estimates and the unknown values as small as possible. For this reason, estimates cannot be too extreme, at the
risk of being far off the true value. Consider a simple example: if one wants to be as close
as possible in guessing the integer number of eyes on a six-sided die, one would guess 3.5
because, on average (i.e., when rolling the dice many times), this would provide the closest answer. One never would guess 1 or 6 because those are not conservative choices! Estimation models are said to be locally accurate in that they seek to minimize local errors
independently of what the global map of estimates may look like.
Accurately predicting flow in a subsurface formation depends on how well the data reflect the overall geological continuity in terms of permeability, not only on how close each
estimated permeability value is to the actual subsurface permeability. If we need to accurately predict the process of subsurface flow, we need to provide a globally accurate representation of the subsurface heterogeneity. The focus of global accuracy is to reproduce a
12
Petroleum
Geostatistics
Unknown true reservoir
The Role of Geostatistics in Reservoir Modeling
The data
model that reflects as accurately as possible the patterns of geological continuity of the actual reservoir. The focus in estimation lies in approximating as best as possible each unknown value independently of what is estimated at any other unsampled location.
Stochastic simulation is a geostatistical tool for generating numerical models that aim at
more realistic global representations of subsurface heterogeneity than estimation models
(i.e., simulation aims at global accuracy). "Realism" should be understood in the sense that
a stochastic simulation tries to reproduce the (modeled) spatial relationships between values at different locations by mimicking subsurface continuity as interpreted from reservoir
data or as interpreted from analog information such as outcrop studies. A second goal of
stochastic simulation, common to estimation models, is to match the reservoir data at their
measurement locations (i.e., well, seismic, and production data). To illustrate this concept,
consider Fig. 1.5, where five porosity measurements from wells are available. Suppose several alternative interpretations exist for the spatial continuity of the underlying porosity
field.
A single best guess
Uncertainty caused by lack of constraining data
Stochastic simulation model!
...
;..
....
. Geological Continuity Modell.
Stochastic simulation model I with different input parameters
'S
'" =
=;::
0 =
.~ 0
;
~
OJ
;..
'0
.
..
..c ~
"Q
01
'"
~
'"
01
=
..
~....
OJ 0
;..'"
=
=
0
.; ;::
1::,S
01 01
OJ ..
=
Q.,
~
Stochastic simulation model 2
....
Porosity occurs in relatively continuous patches of
alternating low and high values; these patches tend to be more elongated in one direction. Some information on the average dimensions and orientations of these
patches is available from outcrop studies.
Geological Continuity Model 2. The porosity variability is dominated by the presence of channels; channel sands have high porosity, while the background mud has
low porosity. The average porosity in each sand and mud is known from wells; the
various parameters defining channel geometry (width, sinuosity, orientation) are determined from outcrop studies and the regional depositional setting of the reservoir.
For each of these two models, a specific stochastic simulation method is selected. In this
book, we present several such methods and show how the selection process is done. As
shown in Fig. 1.5, three levels of uncertainty exist in this process:
...
~
13
.5
. The
most important level of uncertainty is in the interpretation of the geological or
sedimentological continuity (i.e., the type of geological continuity model used). The
Stochastic simulation model 2 with different input parameters
...
Fig. 1.5-Various sources of uncertainty related to the "geological continuity model." Uncertainty on the type of geological scenario leads to selecting a different stochastic simulation.
Each scenario contains parameters that are uncertain; this creates a second level of uncertainty.
Even for a given geological heterogeneity model with given parameters, the limited amount of
reservoir data allows one to generate multiple realizations (honoring the same sparse data).
.
.
style of geological continuity or heterogeneity is also termed geological scenario.
Some styles may be deemed more likely than others.
The second level of uncertainty is caused by the fact that some parameters of a given
geological continuity model are poorly known (e.g., the orientation of the low- and
high-value patches in interpretation 1 or the orientation of channels in Fig. 1.5).
Even if the style of geological continuity is known and all parameters that quantify
that style are known, the lack of local constraining data (wells, seismic, and production) generates a third level of uncertainty (i.e., there are multiple models that fit the
same five porosity data; look at Fig. 1.5 along any of the last three rows).
Another type of uncertainty, not present in Fig. 1.5, originates from the data themselves.
Well-log and seismic data are often themselves uncertain in that they required prior interpretation of other, more original measurements (the raw data). These raw data may be subject to error as well, such as related to the position of the measurement devices (tools, geophones, etc.).
14
Petroleum Geostatistics
1.6 The Role of Geostatistics in Reservoir Modeling
A large number of geostatistical methods and algorithms have been developed for 3D reservoir modeling, not all with equal success. Only a few algorithms have withstood the test of
time, the most recent changing the practice of 3D reservoir modeling. The standing contributions of geostatistics to reservoir modeling will make up the four remaining chapters of
this book and are outlined shortly as follows:
.
Chapter 2: Modeling Geological Continuity. Geological continuity is often the
most important driver for predicting subsurface flow.Geological interpretation, however, is often qualitative in nature and needs to be made quantitative to be useful for
reservoir modeling. Geostatistics provides various classes of geological continuity
models, the relevance of each depending on the level of knowledge about the subsurface continuity and its geological scenario. Chapter 2 discusses three such models: the variogram model, the object model, and the training-image model.
Chapter 3: Building High-Resolutiou Geocellular Models. Quantifying geology is
rarely enough on its own. Second to reflecting the geological scenario adopted, geocellular models also should be constrained to actual subsurface data. Chapter 3 presents various geostatistical methods for incorporating static data, namely well-log
data and 3D seismic data, into a high-resolution model.
Chapter 4: History Matchiug Under Geological Constraints. If production data
.
.
(dynamic data) are available, they must be incorporated into the reservoir model in
that, if flow simulation is performed on that model, it should result in production scores
matching the production data. The process of integrating production data is more commonly known as history matching. In the current practice of reservoir model building,
history matching is predominantly done manually, often at the cost of departure from
any static information (wells, seismic) and geological realism. In Chapter 4, we discuss some recent accomplishments in jointly integrating static and dynamic information into a reservoir flow-simulation model-in other words, history matching under
static-data and geological continuity constraints.
.
Chapter 5: Uncertainty Modeling. Providing an uncertainty statement about key
reservoir parameters is as important as providing estimates on them. Chapter 5 discusses the contributions and limitations of a geostatistical approach to providing uncertainty statements about key reservoir parameters.
In addition to these main contributions to reservoir modeling, the geostatistical toolbox
includes many useful side tools, such as certain kriging types used in cleaning seismic images, models for seismic velocity, or constraining horizon locations to marker data.
Nomenclature
h
=
lag vector; notation used to describe the distance between locations u and u+h
kH = horizontal permeability
kv = vertical permeability
u
leU)
z*(u)
Aex
y(h)
= locationin 3D spacewithcoordinates(x,y,z)
= unknown property z at location u
= estimate of the unknown property z at location u
= kriging weights
= variogram
The Role of Geostatistics
in Reservoir Modeling
15
Suggested Reading
Books ou Geostatistics Theory
Chiles, J.-P and Delfiner, P: Geostatistics: Modeling Spatial Uncertainty, Wiley Series in
Probability and Statistics, Wiley and Sons, New York City (1999).
This book provides an excellent theoretical overview of traditional Matheronian geostatistics. It covers many kriging and simulation methods extensively, some of which,
however, are rarely used in practice. It does not provide a modern view of the field; practical applications to oil and gas fields are limited (advanced level).
Goovaerts, P: Geostatistics for Natural Resources Evaluation, Oxford U. Press, Oxford,
U.K. (1997).
Excellent theoretical overview of methods and algorithms, as well as practical suggestions in applying modern geostatistical methods (advanced level).
Journel, AG.: Fundamentals of Geostatistics in Five Lessons, Short Course in Geology,
American Geophysical Union, Washington, DC (1989) 8.
With some prior knowledge of statistics and probability theory, this set of lecture notes
will provide the fastest theoretical introduction to the principles of geostatistics (intermediate level).
Journel, A.G. and Huijbregts, C.J.: Mining Geostatistics, The Blackburn Press, Caldwell,
New Jersey (1978).
The first comprehensive book on geostatistics. Even though it covers mostly mining applications, the theoretical roots of today 's most popular geostatistical methods can be
found here (advanced level).
Books on Geostatistics iu Reservoir Characterization
Deutsch, c.V: Geostatistical Reservoir Modeling, Oxford U. Press, Oxford, U.K. (2003).
Comprehensive overview of most of the currently used geostatistical methods as applied
to reservoir modeling (introductory to intermediate level).
Hohn, M.: Geostatistics and Petroleum Geology, Van Nostrand, New York City (1988).
Good primer introduction to geostatistics in general; good resource and starter textfor
students and practitioners as a complement to the more theoretically oriented books
listed here (introductory level).
Kelkar, M. and Perez, G.: Applied Geostatistics for Reservoir Characterization, SPE,
Richardson, Texas (2002).
Comprehensive presentation of geostatistics in the broader context of reservoir modeling and management. Excellent as a graduate textbook (introductory to intermediate
level).
Other Refereuces
Deutsch, c.V and Journel, AG.: GSLIB: The Geostatistical Software Library, Oxford U.
Press, Oxford, u.K. (1998).
A landmark contribution on which most of the current commercial software for geostatistics is based. Contains a summary of geostatistical theory as well as Fortran code for
command line application (intermediate level).
Jensen, lL. et at.: Statistics for Petroleum Engineers and Geoscientists, Prentice Hall Petroleum Engineering Series, Englewood Cliffs, New Jersey (1997).
Includes both elementary statistical and geostatistical tools relevant for engineers and
geologists (introductory level).
16
Petroleum Geostatistics
Olea, R.A. (ed.): Geostatistical Glossary and Multilingual Dictionary, Oxford U. Press,
Oxford, UK. (1991).
Remy, N.: S-GEMS: The Stanford-Geostatistical Earth Modeling Software, Stanford, California (2004).
/>A freely available software with parameter interface and 3D visualization, including
some of the most modern geostatistical tools.
51 Metric Conversion Factors
ft x 3.048*
'Conversion
factor
is exact.
E - 01 = m
Chapter 2
Modeling Geological Continuity
2.1 Introduction
2.1.1 Why Do We Need To Model Geological Continuity? Geological continuity is possibly the most important driver for subsurface flow, so it should be represented accurately
in a reservoir flow-simulation model at a level that is relevant for the particular appraisal or
development problem in question. Most often, a geological interpretation is required to
quantify geological continuity. Geological interpretations, however, are often qualitative or
descriptive in nature. For such interpretations to be useful, they must be made quantitative.
Geological information that cannot be made quantitative cannot be used in 3D reservoir
modeling and, hence, will not have an impact on the decision-making process.
This chapter presents various alternative geological-continuity models for modeling the
continuity of petrophysical properties and facies distributions. As discussed in Chapter 1, a
geological-continuity model is used to relate the data to each other as well as to unknown
properties at unsampled locations. The geological-continuity models are then used in Chapter 3 to construct geocellular models reflecting the modeled geological continuity and being
constrained to well and seismic data at the same time.
Capturing geological complexity into simple models seems an impossible task, yet not
all geological detail matters for flow or needs to be explicitly modeled.A geostatistical toolbox should, therefore, provide a spectrum of models, from simple parametric models (requiring only knowledge about the rough characteristics of the subsurface continuity) to
more complex models (requiring prior detailed geological interpretation).
Building high-resolution geocellular models from wells and seismic is usually achieved
through a hierarchical approach, as shown in Fig. 1.2. In terms of property modeling, one
usually follows two steps:
..
Generate the geometry of the most important facies.
Populate each facies with petrophysical properties.
The main reasons for creating this hierarchy are as follows:
.
Petrophysical properties often follow trends governed by the geometry of facies or
architectural elements such as channels. Accurately modeling such trends is important for prediction of fluid flow and saturation patterns in the reservoir.
18
Petroleum Geostatistics
.
Petrophysical properties within each facies are more homogeneous than the reservoir
as a whole. The statistical properties of petrophysical properties within each facies
are fairly stationary and can be modeled by well-established geostatistical methods.
In this chapter, two types of continuity models for describing facies geometry are discussed: object models and training-image models. For describing properties within each facies or within a fairly homogeneous layer, the variogram model is used.
2.2 Describing Facies
2.2.1 Object Models. Also termed "Boolean models," these models import geologically
realistic shapes and facies associations directly into the reservoir model by means of objects; see Fig. 2.1 for some examples. Architectural elements with crisp geological and
Modeling Geological Continuity
19
curvilinear shapesare often hard to model with cell-based techniques. The object approach
consists of dropping directly onto the reservoir grid a set of objects representing different
geological facies, each with their own geometry and relative spatial distribution. These objects are then moved around and locally transformed to match the local data (wells and seismic); see Chapter 3 for additional discussion.
In theory, there is no limitation to the type of shapes that can be modeled, but most current applications focus on fluvial and submarine channel objects. The first task in an objectbased method is to establish the various types of objects (sinuous channel, elliptic shale,
cubic crevasse) and their mutual spatial relationship: erosion of one object by another, embedding, and attraction/repulsion of objects. Next, the dimensions of each object need to be
quantified, usually in terms of a distribution of width, thickness, or width-to-thickness ratio,
vertical cross section parameters, sinuosity, etc.
In the case of channel-type reservoirs (fluvial or submarine), various sources of information can be considered:
. should correct the biases that come up when inferring 3D object properties from 2D
Outcrop studies of analog systems are the best source of information, although one
outcrops (smaller 3D objects are less likely to occur in 2D sections).
. Well-log data may provide information on object geometry and relate object shape
parameters from outcrop data to actual subsurface object shapes. Wells usually are
drilled in high-pay zones, which may introduce bias into the parameters derived from
wells. A parameter such as the proportion of channel vs. background facies may be
subject to bias when estimated directly from wells.
Compared to cell-based methods, object-based methods provide realistic shapes but are
harder to constrain to local reservoir data, such as dense well data, high-quality 3D/4D seismic, and production data. Object shapes need to be "morphed" (i.e., their location and
geometry must be changed to match the local reservoir data; see Chapter 3). It is more difficult to perturb large objects to match abundant data than it is to generate cell-based models directly constrained to the same data. Therefore, object-based methods typically are applied with few wells and low-resolution seismic. They also are used in sensitivity studies
analyzing the impact of reservoir objects' connectivity to flow.
II
II
II
11
I
""
III
Fig. 2.1- Two examples of reservoir models built with object models: a fluvial channel reservoir
(top) and turbidite lobes (bottom). Courtesy of the Norwegian Computing Center and Alister
McDonald, Roxar.
2.2.2 3D Training-Image Models. Geological complexity can rarely be described by a
limited set of object shapes. Outcrop data often display a large variety of geological heterogeneity types over many length scales. Geological features, from fine-scale barriers to
large-scale flow conduits, may need to be represented accurately in geocellular models to
produce realistic models for flow prediction.
The 3D training-image approach is a relatively new tool for geologists to communicate
their interpretations of geological heterogeneity style explicitly as a full 3D image. The 3D
training image is not a reservoir model; it is a conceptual rendering of the major heterogeneities that may exist in the subsurface. The aim of geostatistics, then, is to build reservoir models that mimic the geological heterogeneity of the 3D training image and, at the
same time, constrain such models to actual location-specific reservoir data.
An example of a 3D training image for an actual field is shown in Fig. 2.2a. Training images may be defined at various reservoir scales, such as the bedding scale or the flow-unit
scale (see Fig. 2.2b).
20
Petroleum Geostatistics
(a) Training image of a tidal-dominated reservoir
with seven facies (courtesy ofChevronCOlp.)
Modeling
Geological
Continuity
21
Why Not Use the 3D Training Image as a Geocellular Model? The training image is a
mere concept; it depicts geological variability as interpreted from reservoir data and from
geological understanding of the reservoir. In this sense, the 3D training image is a model of
geological heterogeneity, just like an object model, but the training image has no "local accuracy" (see Chapter 1) in the sense that it need not be constrained to any location-specific
reservoir data such as well-log, seismic, well-test, or production data, nor need the training
image have the same dimensions of the actual subsurface reservoir. A training image may
display the correct style of geological heterogeneity, but it lacks the local accuracy and data
consistency required for a reservoir model.
In reservoirs, particularly at the appraisal stage with only a few wells available, many alternative training images should be produced, reflecting the inherent uncertainty about
the subsurface geological scenario. As discussed in Chapter 5, this set of alternative training images reflects a primary factor of uncertainty that needs to be accounted for in the
decision-making process.
What Are Sources for Obtaining 3D Training Images?
. aBoolean/process-based
(Figs. 2.2a and 2.2b): The 3D training image is, in this case,
facies model generated with object-based methods; however, it is not constrained
to any local data.
. High-resolution
seismic: Shallow seismic techniques can illuminate 3D heterogene-
(b) Training image of sinuous channels with point bars
obtained from a process-based technique
.
ity near a 2D outcrop section or in neighboring or shallower, nonreservoir areas of an
actual field.
Two-dimensional outcrop sections can be interpreted and interpolated
puter-aided design (CAD) techniques to provide full 3D models.
with com-
Three-dimensional training images are not easy to come by because they force the reservoir modeler to be explicit about his prior vision of 3D spatial variability of facies or petrophysical properties.
Fig. 2.2- Training images generated with (a) an object-based technique (provided by Sebastien
Strebelle, Chevron Corp.) and (b) a process-based technique (using a geomodeling software
program) without the need for these 3D concepts to be locally constrained to reservoir data.
2.3 Describing Geological Continuity With a Variogram
2.3.1 Continuity as Captured by an Experimental Variogram. Variogramsare usedto
describe the geological continuity of "homogeneously heterogeneous" properties. This
means that variograms are best suited for describing the geological continuity of petrophysical properties within relatively homogeneous layers or major flow facies. Variograms
should not be used to describe facies geometry unless the facies distribution itself is fairly
homogeneous. Therefore, variograms are typically used to describe the continuity of porosity and permeability within layers or facies bodies.
To provide an intuitive understanding of the variogram, consider in Fig. 2.3 a set of synthetic reservoir layers within which porosity is distributed. The experimental variogram is
a quantitative measure of spatial correlation and allows us to quantify/discriminate the visual differences between the various synthetic models in Fig. 2.3.
The simplest way of looking at spatial continuity is to measure the degree of linear correlation between the values of a single property measured at any two locations separated by
a certain 3D vector h, then plot that correlation vs. h.
Denote by leU)the property located at location u=(x,y,z).In 3D space, the separation vector h between any two spatial locations u=(x,y,z) and u+h=(x+hx,y+hy,z+hz)is fully characterized by a distance Ihland a direction ()represented by two angles: the azimuth and dip
angles (see Fig. 2.3f). The experimental (semi-) variogram is defined as
Modeling Geological
1
y(h)
Compare behavior
at Ihl~O,between
cases (a) and (b)
0.4
0.33
t.: 026
0.20
0.13
1
0.06
0.00
N/S direction
I
I
I
I
I
I
.
depfu ,
~'EW
t
NS::trJ
.0
:-r-
sill
,j
~
Vertical
direction
.0100
.0080
y .0060
.0040J/~
~.
. .0000 ,
10.0 20.0 30.0 40.0 50.0 60.0 700
80.0
Distance
.0080
.0060
Y
\
.0040
,
.0020
.0000
(e)
.0
Azimuth
Variogram in horizontal
does not reach sill
10.0 20.0 30.0 40.0 50.0 600
Distance
U=(X,y,z)
z(u) = property
y(N/S)
z measured
x (E/W)
Fig. 2.3-(Caption
[z(u) - z(u+h)
Y
. . . . . . . . . . . . . . . . . . . . . . . . . . . . . . (2.1)
The variogram measures the average squared difference between two values z separated by
h. Plotting y(h) vs. h, with each h taken along the same direction e, visualizes the increase
in variability between two property values with increasing distance Ihl in that direction e.
This increase is expected because, on average, one expects that two values measured at increasing distance from each other are likely to be more different or dissimilar. The variogram captures this increasing dissimilarity.
Variograms can be calculated for several directions (several combinations of azimuth and
dip angles) in 3D space. Because of the anisotropy of the geological continuity, the shapes
of the experimental variograms depend on the direction along which they are calculated. To
illustrate this, consider the variograms in Figs. 2.3a through 2.3e:
The variogram increases from zero at the origin Ihl=Oand often reaches a plateau at
a certain distance. The distance at which this occurs is termed the range-(alsotermed
correlation length) for the direction considered. This range indicates the average extent of continuity/correlation along various directions and can be related to the size
of dark and white patches, as indicated in Fig. 2.1b. The plateau is termed the sill and
corresponds to the statistical variance of the property.
. Often, such as in Fig. 2.3c, there is an apparent discontinuity on the y-axis of the variogram plot, termed the nugget effect. The nugget effect reflects the geological variability at scales smaller than the smallest experimental distance Ihl.
Apparent discontinuity
.0020
.0
~
23
.
10.0 20.0 30.0 40.0 50.0 60.0 70.0 80.0
T
= 2N(h)
N(h)
Continuity
on facing page.)
at u
70.0 80.0
A range that varies with direction indicates anisotropy in spatial continuity. In most reservoirs, one expects the range in the vertical/depth direction to be shorter compared to a horizontal direction. The variation of the range in various 3D directions typically displays an
ellipsoidal behavior. Such an ellipsoid can be summarized with six parameters: the ranges
along major, medium, and minor axes, and the rotation parameters defining its 3D orientation in terms of azimuth, dip, and plunge.
The variogram behavior at the origin (i.e., for small h) is an important factor to differentiate geological continuity. Compare, for example, the variogram behavior at the origin in
Fig. 2.3a with Fig. 2.3b. A slower increase from Ihl=Oin Fig. 2.3a coincides with a
smoother-looking continuity in reservoir porosity.
The variograms calculated in Fig. 2.3 suggest a way to discriminate and quantify between
various patterns of continuity using a limited set of parameters, summarized from experimental variograms:
.
.
The variation in correlation lengths/ranges along various directions.
The amount of nugget effect and the behavior of the variogram for small distances Ihl.
Fig. 2.3-(a) Reservoir with smooth spatial continuity translates into a slower decrease of the
variogram at the origin; (b) the range in the vertical and horizontal direction can be associated
with an average extent of black and gray patches in each direction; (c) a nugget effect indicates
small scale heterogeneity; (d) strong layering gives rise to a variogram in the layering direction
that does not reach a zero; (e) notation convention.
24
Petroleum Geostatistics
Modeling Geological Continuity
2.3.2 Variogram of Categorical Variables. A variogram can be calculated for either continuous or categorical variables. Fig. 2.4 shows an example of a variogram for a facies map
containing three facies (three categories), each exhibiting a different spatial variability. Facies I appears isotropic, while facies 2 and 3 show a distinct anisotropy, orthogonal to each
other. A single variogram could not reflect the difference in continuity of each facies. To enable distinction between the three facies, an indicator variable is assigned to each facies.
The indicator of facies i is defined by assigning a value of "I" to all locations at which facies i occurs and a value of "0" elsewhere; see the bottom of Fig. 2.4. An indicator variogram, which is the variogram calculated for each of the three maps, now reveals the difference in the anisotropic correlation length of each facies.
As suggested in the Introduction, variograms are of limited use for defining facies geometry; therefore, indicator variograms should be applied mostly to a continuous variable by
binning the variable into a number of classes (typically, three classes for low, medium, and
high values). This allows investigating if that variable may have different spatial charac-
_'H'_.
Variogram
Facies map, 3 facies
.
ZOOj
1.50.'
"""""~-"""",,,
~
-..~t...:
NW/SE direction
~
-
1.00
LEW
.50
.00
Indicator
map, facies I
Indicator
map, facies 2
b
NE/SW direction
10.0
ZO.O
Distance
Indicator
TO
map, facies 3
I
Facies 3
n
'
"",
.~~~.,
l
Variogram
Variogram facies 2
~_.
.ZOO
--....
/'"
l
1
facies 1
f
.
'ZOO
'
.. "
.150 II
::::::::n:
:::::.:::::
"
..
150
.100 I J
.100.I
"
,,'
Variogram facies 3
.ZOO
.150.;I
'i,.'
J1
.100
.050
.050
.000
0
.000.
0
.000.
0
ZO.O
Distance
30.0
10.0 ZO.O 30.0 40.0
Distance
'_':"""::~:::::
.,f..'
,
.050
10.0
rest
' I
'L
10.0 ZO.O 30.0 40.0
Distance
Fig.2.4-A categorical map (top)withthree imbricatedfacies. Theoverallvariogramdoes not indicate significant anisotropy (middle), Three indicator facies maps derived from the three-facies
map (bottom); the three indicator variograms display the anisotropy pattern specific to each
component facies.
25
teristics for different ranges of values; for example, high permeability may be associated
with a specific direction with stronger spatial continuity than low permeability.
2.3.3 Issues of Stationarity and Trend. A note of caution should be made regarding the
calculation of any statistics, whether a histogram, scattergram, or variogram. Such statistics are calculated on the basis of data gathered or pooled from some given 3D volume (e.g.,
a specific layer). To meaningfully interpret the resulting statistics and characteristics such
as anisotropy and correlation length, the geological continuity within this 3D pool should
be fairly similar; that is, in mathematical terms, it should be stationary (see Chapter I). It
would not make sense to pool data from two regions with vastly different geological continuity.
The patterns of heterogeneity displayed in Fig. 2.3 do not show any major lateral or vertical discontinuities and, hence, are deemed stationary. In actual reservoirs, one would need
to determine the regions (compartments) with layers of similar geological heterogeneity.
Each such region or layer would display characteristic correlation lengths and anisotropy
directions yet still may display some vertical or horizontal trend of the reservoir property
under study. Variograms are, however, difficult to interpret in the presence of such a trend.
To account for such a trend, one could decompose the spatial variability of the property
into two parts: a reasonably smooth trend component and a more random residual component around that trend. Trends are often modeled deterministically using seismic data (impedance inversions, for example). They also can be modeled using appropriate geostatistical interpolation algorithms (kriging with trend).
2.3.4 Obtaining Variograms From Well Data. Actual reservoir data are typically
sparsely measured along a few vertical and deviated wells. Variograms are then calculated
from these well data, with (possibly) a prior coordinates transform into the depositional
space (see Fig. 1.2). Various textbooks in geostatistics tutor the reader on how this is done
in practice. Most current software packages provide excellent visual and interactive ways
to calculate experimental variograms from well data within complex 3D structures.
When only a few vertical or slightly deviated wells are available, the variogram in the
horizontal directions is often ill-defined; it appears to be a pure nugget effect (purely random) and therefore difficult to interpret. The vertical direction is typically more densely
sampled, and a range value can be determined readily. Consider the variogram in Fig. 2.5,
which is obtained by "drilling" five wells into the reservoir on the left. The variogram in
the vertical direction has identifiable characteristics (correlation length around 15 units),
while the experimental variogram in any horizontal direction appears as a pure nugget, despite the fact that strong channel-type continuity exists in horizontal planes!
What Are Possible Solutions?
Assume from prior expertise the missing variogram parameters such as horizontal
.
correlation lengths or anisotropy directions. This is better than accepting the default
values of an interpolation software, which often amounts to assuming no spatial correlation (pure nugget effect) or perfect correlation (layer-cake model). No correlation
or perfect correlation are extreme cases of spatial correlation and are not necessarily
safe or conservative choices. Practitioners often tryout various variogram models by
performing stochastic simulation (i.e., generating synthetic reservoirs such as the one
shown in Fig. 2.3). The variogram corresponding to simulated images that "look representative" for the underlying field is then retained.
26
Petroleum Geostatistics
Modeling
Geological
Continuity
27
0.33
00
0.26
";:::::
.....
0
.....
p.,
0.20
0.13
0.06
~u
0.00
'uo
E
.0160
Porosity vargram
~/
.0120J
r.
".
based o"five wells
or
.;::
"'id
~
en
Vertica! (jirection
OJ-OJ
- y~--~
§<"8
"E: 8
.~ bO
Yo080Jk--/
N45E direction
40.
o.
80.
120.
Distance
Fig. 2.5-Vertical
and horizontal
voir. While a clear continuity
variogram
calculated
4-<
0
I=i
0
~~.~
.~
"3
S
OJ OJ
"':::i en
.00
;::
0
.0000
u
from five wells drilled in a channel reser-
exists in the N45E-direction
(channeling
direction), the variogram
is noisy in that direction. Variograms are, therefore, typically used to describe the variability
petrophysical properties within major facies, not the spatial variability of such facies.
of
~
-"'-0
t.) '"
.~ ;::
~'"
0 .;,f
.0040
p.,
0
.....
....
"0
I=i
~
00
'uo
"0
I=i
~
I=i
0
";:::::
~
S
";:::::
00
IJ:.1
C')
.....
Another common practice is to borrow variogram parameters from outcrop data, such
as the anisotropy ratio. One also may consider borrowing horizontal variogram parameters directly from seismic data.
2.3.5 Obtaining Variogram Models: A Workflow. Fig. 2.6 presents an overview of a
three-stage workflow for quantifying geological heterogeneity with a variogram:
Pool data over stationary zones, removing clearly interpretable trends.
Calculate experimental variograms and interpret their characteristics.
Model the variograms using a few parameters such as nugget constant, ranges, and
anisotropy ratios (see the Advanced Reading Box).
2.3.6 Limitations of the Variogram. The application of traditional, variogram-based geostatistics in the area of reservoir modeling was essentially carried over from its original application in the mining industry. While mining has abundant drill-hole data, oil and
§.
...<:1
U
;i
0
~..
0
:!:
C)
,5
Qj
"C
0
E
"C
C
as
c
0
:;::;
as
:iu
iii
u
E
as
..
C)
.2
~I
CD
N
ciJ
u:
28
Petroleum Geostatistics
Modeling Geological Continuity
29
Advanced Reading Box
Variogram Modeling
Three-dimensional variogram modeling consists of fitting an analytical model defined by a few parameters to the experimental variograms. In the indicator case (categorical variables), this requires fitting a variogram model for each facies' experimental indicator variogram. There are two main reasons for doing so:
0.4
. Estimation
and stochastic simulation methods require the variogram to be
known for all distances, not only those experimental distances between sam-
.
ple data locations.
There are restrictions on the type of variogram models that can be used. Spatial estimation techniques provide, in addition to estimates, a quantification of
the error of that estimate in terms of an error variance (see Chapter 3). The
error variance necessarily needs to be positive. This requirement translates into
conditions on the variogram analytical model.
The latter reason makes variogram modeling a challenging task. In practice, one will
make use of predefined variogram models for which the positivity condition is
known to be satisfied. These basic models essentially serve as basis functions from
which, by linear combination, more-complex variogram models can be derived to fit
the experimental data. The details of such modeling are outside the scope of this
work and are the subject of more technically oriented books.
0.33
.~
0.26
0.20
0.13
(c)
0.03
(d)
0.00
y
.~
.0000,
,
. , , "
.0 10.0 20.0 30.0 40.0 50.0 60.0 70.0 80.0
Distance
Fig. 2.7- Three alternative geological scenarios exhibiting the same vertical and horizontal variograms. The variable is porosity.
gas reservoirs often lack this amount of data, and a direct inference of the variogram parameters is often not possible. In practice, one rarely has the opportunity to model "cleanlooking" experimental variograms from actual reservoir data. However, lack of adequate
data is not a good reason to dismiss geostatistics and resort to the arbitrary pure nugget variogram model implicit to many off-the-shelf interpolation software packages.
The major limitation of the variogram is its inability to model realistic geological features.
Reservoir models built solely with variograms as the geological heterogeneity quantifier are
often deemed unrealistic, appearing "too synthetic" and too "homogeneously heterogeneous." In addition, it is difficult to link variogram parameters to curvilinear geological
shapes and horizontal and vertical architectural elements as interpreted from outcrop data.
To demonstrate this point, consider the three alternative synthetic reservoirs in Figs. 2.7a
through 2.7c. The corresponding variograms in the horizontal and vertical directions are
shown in Fig. 2.7d. The large difference in geological variability and connectivity in Figs.
2.7a through 2.7c does not result in any significant difference between variograms. Note
that these experimental variograms are calculated from exhaustive data, a luxury never afforded in real applications! Even with exhaustive data, variograms are poor discriminators
of geological scenarios. This limitation arises because the variogram models correlation between only two spatial locations-it "explores the world using only two fingers"; therefore,
it cannot capture any curvilinear geological patterns, hence the earlier recommendation of
not using the variograms for modeling the geometry of major facies.
III
Adopting a variogram-based approach often may be appealing because defining the variogram requires setting only a handful of parameters, as opposed to drawing explicitly a full
3D picture of heterogeneity (training-image approach) or defining fully the geometry offacies objects (Boolean approach). Nevertheless, an important note of caution should be
made: as demonstrated by Fig. 2.7, variogram-based geostatistics shift the responsibility of
stating one's geological belief about heterogeneity from the reservoir modeler to the geostatistical algorithm. While the variogram is not fully explicit about geological heterogeneity, any geostatistical algorithm that uses a variogram will generate 3D numerical models with an explicit 3D heterogeneity model (as with any of the three models in Fig. 2.7).
Often, such variogram-based geostatistical algorithms will generate unrealistically homogeneous reservoirs. Hence, the decision to choose a specific variogram-based algorithm is
no less consequential than the decision to choose certain object types along with shape parameters or to adopt fully explicit 3D training images.
Nomenclature
h = lag vector; notation used to describe the distance between locations u and u+h
N(h) = number of data pairs {zen), z(u+h)} used to calculate the variogram for 3D
separation vector h
u = location in 3D space with coordinates (x,y,z)
,--
30
Petroleum Geostatistics
z(u) = unknown property z at location u
y(h) = variogram
e = direction
Suggested Reading
On Variogram Calculation and Modeling
Thefollowing referencesprovide useful suggestionsfor calculating and modeling variograms:
Armstrong, M.: "Improving the estimation and modeling of the variogram," Geostatistics
for Natural Resources Characterization, G. Verly et al. (eds.), Reidel, Dordrecht, The
Netherlands (1984) 1-20.
Deutsch, C.y. and lournel, AG.: GSLIB: The Geostatistical Software Library, Oxford U.
Press, Oxford, UK (1998).
Gringarten, E. and Deutsch, c.y.: "Methodology for Variogram Interpretation and Modeling for Improved Petroleum Reservoir Characterization," paper SPE 56654 presented at
the 1999 SPE Annual Technical Conference and Exhibition, Houston, 3-6 October.
Isaaks, RH. and Srivastava, R.M.: An Introduction to Applied Geostatistics, Oxford U.
Press, Oxford, U.K.
lournel, AG.: "Non-parametric estimation of spatial distributions," Mathematical Geology
(1983) 15, No.3, 445.
This paper provides thefoundation of indicator geostatistics.
Olea, R.A: "Fundamentals of semi-variogram estimation, modeling and usage," Stochastic Modeling and Geostatistics-Principles, Methods and Case Studies, I.M. Yams and
R.L Chambers (eds.), AAPG Computer Applications in Geology (1994) No.3, 27.
Yao, T. and lournel, AG.: "Automatic modeling of (cross) covariance tables using fast
Fourier transform," Mathematical Geology (1998) 30, No.6, 589.
This paper uses Fourier transforms to make variogram modeling more automatic.
On Boolean Methods
Deutsch, c.y. and Wang, L: "Quantifying object-based stochastic modeling of fluvial
reservoirs," Mathematical Geology (1996) 28, No.7, 857.
One of the first practical algorithmsfor object modeling.
Thefollowing papers represent a selectionfrom the large body of work on object modelsfrom the Norwegian School:
Haldorson, H.H. and Damsleth, E.: "Stochastic Modeling," lPT (April 1990) 404.
Holden, L et al.: "Modeling of fluvial reservoirs with object models," Mathematical Geology (1998) 30, No.5, 473.
Skorstad, A, Hauge, R., and Holden, L: "Well conditioning in a fluvial reservoir model,"
Mathematical Geology (1999) 31, No.7, 857.
On Training Images
Caers, 1. and Zhang, T.: "Multiple-point geostatistics: a quantitative vehicle for integrating
geologic analogs into multiple reservoir models," Integration of outcrop and modern
analog data in reservoir models, AAPG Memoir 80 (2004) 383-394.
This paper presents various suggestions and guidelines for constructing 3D training
images.
Chapter 3
Building High-Resolution
Geocell ular Models
3.1
Introduction
In this chapter, we discuss geostatistical methods and algorithms that carry the geological
knowledge quantified in Chapter 2 into high-resolution geocellular models. In addition, we
will discuss techniques for constraining these models to data derived from well logs or
cores and seismic surveys. There are two key objectives: (1) the geocellular model should
reflect the believed geological-continuity model adopted, be it a variogram, an object
model, or a training-image model; and (2) these models need to "match" wireline/core data
and seismic data.
3.1.1 What Is Meant by "Should Reflect the Believed Geological Continuity Model"?
Geological interpretation of subsurface continuity as modeled through a variogram, an object model, or a training-image model is often considered subjective information-more so
than the actual reservoir well-log/core and seismic data. Notwithstanding the fact that this
information results from various interpretations, subjectivity is no reason for not using any
particular piece of information. By taking a seismic impedance cube and regressing it directly into a porosity model (or by simply interpolating petrophysical properties between
wells), one is ignoring any prior model of subsurface continuity obtained through careful
geological analysis. In addition, any interpolation tool imposes, implicitly or explicitly, a
degree and style of continuity to a numerical model (see Fig. 1.1). The limited resolution
of seismic data, particularly in the vertical direction, will lead to an underestimation of
reservoir heterogeneity (too-smooth models) if models are built on the basis of seismic
alone. Through methods of stochastic simulation, geostatistics provides various tools for
explicitly imposing the interpreted geological variability, in addition to matching data from
wells and seismic.
3.1.2 What Is Meant by "Models Match the Well-Log/Core Data"? Wells provide direct access to reservoir petrophysical properties through core analysis and well-log interpretation. The grid-cell value in the geocellular model must identify (match) the datum provided by the intersecting well, if that datum is deemed "exact." Often, because of the
32
Petroleum Geostatistics
T
Building High-Resolution
missing-scale problem (see Chapter 1), petrophysical data (as opposed to categorical facies
data) need not be matched exactly.
3.2 Structural Modeling
3.2.1 The Workflow. The first and often most critical task in building a high-resolution
geocellular model lies in the modeling of the reservoir envelope, internal layering, and fault
network. Horizon and fault interpreted along wells, in combination with fault and horizon
interpreted from seismic data, are used to construct the joint horizon and fault network.
Fig. 3.1 shows the workflow of this process, which can be summarized as follows:
.
Creating the Data Set. From 3D seismic, one interprets, manually or semiautomatically, a set of datapoints that identify the various horizons and faults present (see Fig.
3.1, Step I). If a well intersects a horizon or fault, an additional marker-data point is
available. Marker data are considered as exact constraints for the 3D model, while
data points interpreted from seismic are "fuzzy" or "soft" constraints.
. Building a Consistent Fault Network. A fault network consists of a series of fault
surfaces interpolated from the available data points and constrained by an interpretation of the hierarchy and connectivity of the various faults.
Building the Horizons. From the fault blocks and the horizon points, one can create
a horizon one fault block at a time. Alternatively, the horizon can be created in one
step by cutting a "draft" horizon created from the horizon data by the fault network,
Models
33
Step 1: Creating the data set
3.1.3 What Is Meant by "Models Match the Seismic Data"? Seismic surveys provide a
wealth of information on the subsurface reservoir, but that information is not directly related to the petrophysical values of the geocellular model. First and foremost, the scale of
information provided by seismic is larger than that provided by well logs. Second, deciphering raw seismic data includes data processing, time-to-depth conversion, and inversion
and/or interpretation, all inherently subjective and interpretative tasks. Before the seismic
data reach the geostatistical modeling stage, the initial raw seismic data have already been
transformed considerably. The scale difference between seismic information and well-log
information, as well as the uncertain nature of seismic data, means that exact matching is
not desired; rather, a probabilistic-type matching suffices, as elaborated in this chapter.
3.1.4 Is There a Unique Reservoir Model That Matches Wells, Seismic, and Geology?
The answer is always "no." Data from wells, seismic, and production can never fully constrain a geocellular model. Geostatistics provides, through stochastic simulation, methods
for generating many different reservoir models (termed realizations in geostatistical jargon) that all fit the same reservoir data and reflect the prior geological-continuity model.
Because every realization fits the same criteria equally, they are termed equiprobable. This
means that, on the basis of these data, no realization can be deemed "better" than any other.
Building high-resolution geocellular models from wells and seismic is usually achieved
through a hierarchical approach, as discussed in Fig. 1.2.First, one needs to create the reservoir structure (structural model) from 3D seismic and well-marker interpretation. The
stratigraphic grid created around the structural model is converted into a Cartesian grid
within which property modeling takes place. In this chapter, we describe every step in more
detail.
Geocellular
Step 2: Creating the fault network
Resulting fault and horizon model
Step 3: Creating the horizons
Fig. 3.1-Flow chart for creating the structural model from well-marker and data points picked
from 3D seismic (prepared by Guillaume Caumon, School of Geology, Nancy; data provided by
Total).
then creating geologically or structurally consistent contacts that can be drawn between the various faults and horizons.
A critical issue in this workflow lies in the interpretative nature of the data points determined from 3D seismic. Selection of such data points from seismic sections with limited
resolution is subject to a great deal of uncertainty. The data points should therefore be interpreted as soft constraints; the horizon or fault surface need not honor these data points
exactly. The seismic image on which the interpretation of the data points is performed is itself subject to uncertainty. If the interpretation is performed in the depth domain, then the
prior time-to-depth conversion is subject to error owing to uncertainty in modeling the seismic velocity. Issues related to the various sources of uncertainty in structural modeling are
discussed further in Chapter 5.
.
3.2.2 Interpolation Methods. Each surface, either fault or horizon, can be created by triangulation and interpolation from the seismic data points and the well markers. The exact
manner in which this is done is outside the scope of this book; often, nongeostatistical de...i .
r-
34
Petroleum Geostatistics
terministic methods are preferred over geostatistical ones, the reasons for which are discussed briefly.
In nongeostatistical approaches, one often uses discrete smooth interpolation (DSI). DSI
interpolates geological objects accounting for various types of data and is particularly suited
for modeling the geometry of geological interfaces (horizons, unconformities, faults):
.
.
.
r
I
DSI can be applied to discrete objects (e.g., triangulated surfaces), which (a) need not
be square or rectangular like Cartesian grids, (b) can be discontinuous across faults,
(c) can have multiple values along the vertical direction, and (d) can be refined to
model high-resolution features. These features are important in reservoir modeling,
where the number and layout of fault blocks are never known in advance and are uncovered progressively during 3D modeling.
DSI tries to (1) honor all available data and (2) minimize the roughness of the objects,
meaning that surfaces must be as smooth as possible given the available data.
DSI honors "soft" and "hard" constraints. Soft constraints consist of data points interpreted from seismic and used to "attract" a geological surface to that cloud of
points. Hard constraints consist of well markers and geological rules such as sealed
contacts between horizons and faults, non-negative thickness of layers, etc.
Building High-Resolution
Models
35
3.3 Facies Modeling
3.3.1 Object-Based Facies Modeling. As discussed in Chapter 2, object models allows us
to realistically reproduce the shape of subsurface architectural elements, such as sinuous or
meandering channels. The aim of an object-based algorithm is to generate reservoir models by dropping objects into the model in such a way that they fit the well-log and seismic
data. In this context, object-based algorithms are the method of choice for building facies
models if the following conditions are met:
.
.
.
.
In a geostatistical approach, kriging provides a probabilistic way to interpolate the depth
of any point on a 2D fault or horizon surface. For each surface to be interpolated, kriging
requires a variogram (see Chapter 1) of the depth to that surface. This variogram models
the continuity or, in other words, roughness of that surface. Kriging is an exact interpolator
and, hence, has no problem honoring the well-marker data. Special forms of kriging exist
to take into account the fuzzy or soft constraints provided by the data points interpreted
from seismic, some of which (e.g., collocated cokriging) are discussed in the context of
modeling petrophysical properties. Because of its simplicity, kriging with external drift is
often a method of choice for interpolating surfaces. In this method, the seismic data are considered to provide the low-frequency component of the depth to a surface. More precisely,
the surface is considered to be a linear function of the seismic data plus an added residual
component. This residual component (the added noise) allows the kriging surface to interpolate the well markers exactly.
While kriging provides a more extensive theoretical framework than DSI, the need to
specify a variogram does not always make it the more practical method. In many cases, because of limited data, it may be extremely difficult to calculate an interpretable variogram
of depth to a surface from the few well-marker data at hand. This leaves the practitioner
with no other choice than to assume a variogram model. In such cases, one often resorts to
nongeostatistical methods in which the surface continuity/roughness is often implicit to the
method used.
3.2.3 Creating the Depositional Grid. A stratigraphic grid is built from the structural
model. From the stratigraphic grid a Cartesian grid is created, within which all geostatistical property modeling will take place. Ideally, the Cartesian grid provides a coordinate system related to the original depositional environment within which interpolation is best
done. There is a one-to-one relationship between each grid cell in the Cartesian grid and in
the stratigraphic grid. In the case of a simple structural model with few (mostly vertical)
faults,a simpleverticalstratigraphiccorrectionfromthe stratigraphicto the Cartesianbox
Geocellular
suffices. In structurally complex environments, the relation between original depositional
and reservoir coordinates should be established by an unfolding and unfaulting of the original structural model into a flat structure. Because of the multistage deformation and erosion in actual reservoirs, this is not a trivial task. Various techniques for achieving this are
still being researched.
All data, well paths, well logs, and 3D seismic data are imported in the Cartesian grid.
From now on, all grids shown will be Cartesian, although it is understood that there exists
an underlying stratigraphic grid.
Facies geometries can be described by a set of simple object shapes (e.g., sinuous
channels, ellipse, barchans).
Sufficient data and knowledge about the variability in space of these geometries is
available.
Well data are relatively sparse, unless the reservoir data are strongly consistent with
the predefined object shapes.
Facies distribution and geometry have been determined to be the driving factor in
subsurface flow.
Object-based models are more "rigid" than cell-based because "morphing" a set of objects into a reservoir model constrained to all data is not as trivial as changing a few individual grid cells to achieve the same task. This is particularly true for large, continuous objects such as sinuous channels. The existing software implementations rely on an iterative
approach to constrain Boolean models to reservoir data. A trial-and-error procedure is implemented to obtain adequate matching to subsurface data.
Current commercially available software implementation of object-based models can
handle the following types of constraining data:
.
..
..
\
1
Facies data observed in wells: this requires an interpretation of well-log and core data
in terms of the architectural elements of the Boolean model.
Proportion of each facies: often obtained from wells-hence, subject to bias.
Well contacts: geochemical analysis, geological interpretation, or well-test interpretation may indicate that channel observation in two different wells originates from
the same channel; in other words, the same single channel connects the two wells.
Interpreted object pieces from seismic.
Seismic-derived facies probabilities.
Most iterative approaches start by generatingan initialobjectmodelthatfollowsthepredefined shape description but does not necessarily fit the local data. For specific object
types, such as channels, various strategies have been developed to constrain the initial
r-----
36
Petroleum Geostatistics
T
.
37
After 200 iterations
After 198 iterations
model as much as possible to well observations. The most critical part in making the iterative approach successful is the way in which one generates a new object model that has improved data matching over the initial one. The type of perturbation performed will determine how efficient the iterative process is, how well the final object model matches the
data, and how well the predefined parameterization of object shapes is maintained. One iteration step in this iterative scheme consists of the following:
.
Building High-Resolution Geocellular Models
.some well data still
not honored
Proposing a perturbation that improves on the current one.
Accepting this perturbation with a certain probability a: this means that there is some
chance, namely I-a, that a model perturbation that improves the data matching will
be rejected. This is needed to cover as much as possible all possible spatial configurations of objects that match the data equally well.
After 202 iterations
Several theories have been developed to define the optimal perturbation and to determine
the probability a at each iteration step. Implementations are specific to the type of objects
present. Importing objects and arbitrarily morphing them to honor the data could be done
easily, but then odd or unrealistic shapes may be generated. The key lies in determining values for a that achieve two goals: (1) matching reservoir data and (2) honoring the predefined object parameterization. Fig. 3.2 shows an example of iteratively matching a channel
reservoir to facies data from 12 wells.
Regardless of numerous smart implementations, the most challenging obstacle in using
object-based algorithms lies in the mismatch between the object parameterization and the
actual subsurface data. Some discrepancy between the simplified geometrical shapes of architectural elements and the complex subsurface facies architecture should be expected.
Reducing that discrepancy may call for considerable CPU demand because of long iterations. It is often not possible to predict the level of discrepancy before starting the objectbased algorithms.
While the object-based approach is a general approach in the sense that any type of object could be modeled, the iterative approaches to constraining such models to data are usually object-specific. In this context, software implementation of fluvial-channel objects has
made great strides in the last few years in terms of constraining the model to dense well
data.
After 204 iterations
Final result: constrained to all wells
3.4 Cell-Based Models
3.4.1 Building Geological Continuity Sequentially, One Cell at a Time. Most of the
commercially available geostatistical tools for modeling facies and petrophysical properties are cell-based and rely on the principle of sequential simulation. Cell-based methods
have withstood the test of time and practice over a large variety of reservoirs in the world.
The theory behind the sequential-simulation approach is left to the Advanced Reading
Boxes. The "how" and "why" it works, however, can be explained intuitively. In a nutshell:
starting from an empty Cartesian grid in depositional space (Fig. 1.2), one builds a geocellular model one cell at a time by visiting each grid cell along a random path, assigning facies or petrophysical properties to each grid cell, until all cells are visited. Regardless of
how grid-cell properties are determined, the value assigned to a grid cell depends on the
values assigned to all previously visited cells along the random path. This sequential dependence is what forces a specific pattern of geological continuity into the reservoir model.
Courtesy: Norwegian
Computing
Center
Fig. 3.2-Matching a channel model to facies data from 12 wells. The channels are matched iteratively by adding/removing channels and by changing their position and geometry, while at
the same time honoring the predefined object parameterization. The final realization is obtained
after 1,000 iterations (prepared by Hagnar Hauge, Norwegian Computing Center).
-
38
Petroleum Geostatistics
Building High-Resolution Geocellular Models
Consider the cartoon example in Fig. 3.3. The goal is to generate a facies model for a 2x2
reservoir grid that would display a checkerboard pattern similar to the training image
shown at the top of Fig. 3.3. The sequential simulation ofthis 2x2 grid proceeds as follows:
1. Pick any of the four cells.
2. Question: What is the probability of having a black color in this cell?
Answer: Because there are not yet any previously determined cells, that probability
is equal to the overall estimated percentage of black pixels, in this case 13125=52%,
because there are 13 black cells and 12 white cells in the training image. Note that the
target overall proportion can be input as different from the training-image proportion
if desired.
3. Given the 52% probability, determine whether, by random drawing, a black or white
color should be given this cell. Suppose the outcome of this random drawing is black.
A training image
A reservoir
with a 2x2 grid
4. Randomly pick another cell.
5. Question: What is the probability of having a black color in this cell given that the
previous visited cell has been simulated as black?
Answer: This depends on the particular believed arrangement of black and white cells
(i.e., on the geological-continuity model). Given the pattern depicted in the training
image, the only possible outcome is to have a black cell; hence, the probability equals
100%.
6. The other two cells will be simulated white for the same argument.
By changing the order in which cells are visited or by changing the random drawing (Steps
3 and 5), one will get a different result. For this particular case, one can have only two possible final models, each with an almost equal chance of being generated. In geostatistical
jargon, each final result is termed a realization.
3.4.2 Sequential Simulation Based on Training Images. Fig. 3.3 shows that sequential
simulation forces a pattern in the 2x2 reservoir that is similar to the pattern of a training
image. In terms of actual 3D facies modeling, the training image expresses the pattern of
geological heterogeneity that one desires the facies model to depict.
The sequential procedure explained earlier is essentially similar for complex 3D reservoirs with large 3D training images. At each cell, one calculates the probability of having
a certain facies category, given any previously simulated facies categories. Take, for example, the situation in Fig. 3.4. The probability of the central cell being channel sand given
its specific set of neighboring sand and no-sand data values is calculated by scanning the
Traiuiug image
Simulation grid
Step I
Pick a cell
Step 2
Assign probability
Step 3
Assign color
Step 4
Pick a cell
Step 5
Assign color
Step 6
Final result
39
Pattern found
two times
~ Pattern found
one time
Probability for central value to be "saud"= 1/3
Another possible
realization
Fig. 3.3-Step-by-step
description of sequential simulation for a 2x2 reservoir.
~
Fig. 3.4-Simulation of a single cell in sequential simulation with a training-image model. The
neighboring data (termed "data event") near a randomly visited cell are extracted. Replicates of
this data event are searched for in the training image. From the set of replicates, the probability
of the central cell to be in sand can be calculated.
r
Petroleum Geostatistics
40
training image in Fig. 3.4 for "replicates"
of this data event: three such events are found,
Facies
Type
one of which yields a central sand value; hence, the probability of having sand is 1/3. By
random drawing, a facies category is assigned. This operation is repeated until the grid is
full. This procedure results in a simulated facies model that will display a pattern of geological continuity similar to that depicted in the training image.
In actual reservoirs, well-log and core data provide local constraints on the presence of
certain facies. In sequential simulation, such constraints are handled easily by assigning
(freezing) facies category values to those grid cells that are intersected by wells (see Fig.
3.4). The cells containing well constraints are never visited, and their facies values are
never reconsidered. The sequential nature of the algorithm forces all neighboring simulated
cell values to be consistent with the well data. Unlike object-based algorithms, sequential
simulation methods allow constraining to well data in a single pass over all grid cells; no
iteration is required.
Tidal sand flats should be eroded by sand bars.
Transgressive sands should always appear on top of estuarine sands.
An object parameterization for each facies type, except the background
given in Fig. 3.5.
Because
east part
Shale is
whereas
Stratigraphy
Length
(m)
Width
(m)
Models
41
Thickness
(ft)
Tidal bars
Elongated ellipses
with upper sigmoidal
cross section
Anywhere
2000 to
4000
500
3 to 7
Tidal
sand flats
Sheets (rectangles)
Anywhere,
eroded by
sand bars
2000
1000
6
Estuarine
sands
Sheets (rectangles)
Top of reservoir
4000
2000
8
Transgressive
Sheets (rectangles)
Top of estuarines
3000
1000
4
Training Image
shale, is
In addition to these geological rules and patterns, trend information is available from well
logs and seismic data. Trend information is usually not incorporated in the training image
itself but is entered as an additional constraint for generating a facies model. Because in sequential simulation, a facies model is built cell by cell, the nonstationary trend information
can be enforced into the resulting facies realization; no iteration is required. The training
image need only reflect the fundamental rules of deposition and erosion (the geological
concept) and need not be constrained to any specific reservoir data (well, vertical and aerial
proportion variations, or seismic data). In geostatistical jargon, the training image contains
the nonlocation-specific stationary information (patterns, rules), while reservoir-specific
data enforce the nonstationary components. In this example, the following nonstationary
information was considered:
.
.
Conceptual
Description
Geocellular
lags
3.4.3 Example. An example of modeling facies in a tidal-dominated reservoir further illustrates the concept of importing realistic geological patterns from training images. A
northeast-oriented stratigraphic grid of 149x119x15 cells with a grid-cell size of 40x40x 1
m is considered; see Fig. 3.5. The facies model includes five facies: shale (50%), tidal sand
bars (36%), tidal sand flats (1%), estuarine sands (10%), and transgressive lags (3%). Using
an unconstrained object-based algorithm, a training image was constructed with the following geological rules:
..
.
Building High-Resolution
Fig. 3.5- Table with facies stratigraphic and geometrical description of facies types. The corresponding training image was generated with an unconstrained Boolean simulation method
(data provided by Sebastien Strebelle, Chevron Corp.).
erated with this approach. The facies model honors the imposed erosion rules (depicted by
the training image of Fig. 3.5), matches exactly all data from 140 wells, and follows the
trends described by the proportion map and curves.
3.4.4 Sequential Indicator Simulation. If geological continuity is simple enough to be
captured by a variogram model, one could consider a method termed sequential indicator
simulation (sisim), which is based on the same sequential simulation principle as described
above. Sisim requires as input a variogram model for each facies indicator category (see
Chapter 2). Each facies may have a different variogram, with different correlation lengths
and anisotropy characteristics, reflecting the difference in spatial continuity of the various
facies existing in the subsurface.
of coastal influence, sand bars and flats are expected to prevail in the southof the reservoir.
dominant at the bottom of the reservoir, followed by sand bars and flats,
estuarine sands and transgressive lags prevail in the top part.
Using the facies data interpreted from 140 wells, a facies aerial proportion map and a vertical proportion curve are estimated for each facies. Fig. 3.6 shows a single realization gen-
.0:..
42
Petroleum Geostatistics
Aerial proportion
Building High-Resolution Geocellular Models
maps
Plan vieiWY
of stratigrapbi~
grid with location of
the 140 wells
l
~
\
,
_11
43
Advanced Reading Box
Sequential Gaussian Simulation
In sequential Gaussian simulation, the probability model of the central value given
the neighboring data is provided by a Gaussian distribution with a mean and variance
that are identified to the kriging mean and kriging variance of the corresponding estimate using neighboring data:
n
n
y*(u) = ~Aay(ua)
anda~ = I - ~Aap(hao)'
a=l
a=l
To fit the Gaussian formalism, all the original data values z(ua) are transformed into
standard normal values y(ua)' Once the simulation is completed, all simulated values are transformed back into the original data histogram, with appropriate extrapolation for extreme values,
01
Vertical proportion
..
OJ
.c
'"
~
=
=
<:>
..
~
.:0:
..
"
=
Facies model
..
cnrves
..
.... .
." ..
..Q.
.]
."en..
... ...
.. ..
. .
'"
..
; ..
.
.;::
" ...
~ .
.
...
.
'"
Facies interpreted
from well logs
.
'.'
~
a\..
.. .
.
~
./1'
'"
;,
:5
.
I
'" V ariogram
."
..'
'.
,
.:
S
-' ,-
j
Vertical
Fig,3.7.The faciesmodelis constrainedto thewell-log-interpretedfaciesshownat the top
u,
,.u
!
~
..,.,."
,
'=. Variogram
:
'
.
'
~:
~
,
~:
.
"-'
,
,/
,
~....
model facies 2
""'=~::::::::E;W
i
.. "
Facies I
I 'IFacies
2
Facies 3
/' '-'
~direction
Vertical
---------
,
.
~..~
~'r;
yEW
,
w"
- ,...
/,./
direction
Vertical
---------
/
!:!!§"1l!!f~!!:..
,~ Variogram model facies 3
The sisim algorithm generates high-resolution models that "reproduce" the input variogram models. In other words, the variogram calculated from a simulated high-resolution
model will approximate the input variogram models. An Advanced Reading Box provides
some more details on how this is achieved, The sisim algorithm is therefore limited to generating
models.facies models that at most reflect the difference in facies entered into the variogram
Facies interpretations from well logs can be used to constrain facies models generated
by sisim. An example is shown in Fig. 3.7. Three facies are present: a background mud
facies with global proportion of 55% contains an east/west-oriented sand-channel facies
(proportion=35%) crosscut by another sand facies with orthogonal anisotropy directions
and shorter correlation length. The variogram models for each facies category are shown in
"
.r
~.
i
I
Fig. 3.6-Aerial proportion map and vertical proportion curves, a single simulated facies model
constrained to data from 140 wells and reflecting the structure of the training image shown in
Fig. 3.5 (data provided by Sebastien Strebelle, Chevron Corp.).
~
!
'
ILp
model facies 1
E/W direction
Facies model
generated
.
Vertical
--------N/S direction
------
using sisim
Fig. 3.7-Example of a three-facies model generated by sisim constrained to facies data from
Well logs and honoring indicator variograms on the right. Note how facies 2 runs orthogonal to
facies 3.