Stochastic partial differential equation models for highway traffic
Bạn đang xem bản rút gọn của tài liệu. Xem và tải ngay bản đầy đủ của tài liệu tại đây (1.39 MB, 87 trang )
UNIVERSITY OF CALIFORNIA
Santa Barbara
Stochastic Partial Differential Equation Models for Highway Traffic
A Dissertation submitted in partial satisfaction of the requirement for the degree
of Doctor of Philosophy in Mathematics
by
Gunnar Gunnarsson
Committee in charge:
Professor Guillaume Bonnet, Committee Chairman
Professor Michael Crandall, Committee Chairman
Professor Bj¨orn Birnir
September 2006
UMI Number: 3233741
UMI Microform 3233741
Copyright 2006 by ProQuest Information and Learning Company.
All rights reserved. This microform edition is protected against
unauthorized copying under Title 17, United States Code.
ProQuest Information and Learning Company
300 North Zeeb Road
P.O. Box 1346
Ann Arbor, MI 48106-1346
The dissertation of Gunnar Gunnarsson is approved
Bj¨orn Birnir
Michael Crandall, Committee Chairman
Guillaume Bonnet, Committee Chairman
September 2006
Stochastic Partial Differential Equation Models for Highway Traffic
Copyright c 2006
by
Gunnar Gunnarsson
iii
Dedication
To my family.
iv
Acknowledgements
There are many people who I would like to thank for making my stay at the
University of California, Santa Barbara possible, and as great as it was.
First I like to thank my family. My parents for supporting my ambition to
get higher education. And my wife, Solla, for supporting me the whole time and
taking care of our wonderful daughter after she was born.
Academically, I would like to especially thank professor Guillaume Bonnet
for his endless support and help while I often found myself lost in the world of
stochastics. I am endebted to professor Michael Crandall for offering his help, at
a crucial time, when I switched fields of research and to professor Bj¨orn Birnir for
getting me in touch with Guillaume and for his guidance and assistance in many
other matters.
Lastly, I thank the wonderful staff and faculty at the department of mathematics as well as my fellow graduate students. My stay here, would certainly not
have been this nice if it were not for the good times I spent in Medina Teel’s office,
or with Bill Lyons in our shared office or on the balcony. Also, I might have completely lost touch with the world of soccer, were it not for professor Darren Long.
Finally, I thank professor Daryl Cooper for selflessly taking over my teaching load
in time of need. Thank you all.
v
Vita of Gunnar Gunnarsson
Education
PhD Mathematics, Sept. 2006, University of California, Santa Barbara
MA Mathematics, March 2002, University of California, Santa Barbara
BSc Mathematics, May 2000, University of Iceland, Reykjavik
Work Experience
Lecturer and Teaching Assistant, 2000 - 2006, UC, Santa Barbara, USA
Researcher, 2002, Decode Genetics, Reykjavik, Iceland
Programmer, 1998 - 2000, K¨ogun hf., Reykjavik, Iceland
Programmer, 1999, RISC, Research Inst. of Symbolic Computing, Linz, Austria
Teaching Assistant, 2001 - 2003, University of Iceland, Reykjavik, Iceland
Awards and Fellowships
Graduate Division Dissertation Fellowship, Fall 2005
UCSB Affiliates Dissertation Fellowship, Fall 2005
Memorial Fund of Helga Jonsdottir, Fall 2004
Teaching Award, Spring 2004
Thor Thors Fellowship, Spring 2001
Raymond L. Wilder Award, Spring 2001
Fulbright Fellowship, June 2000
vi
Abstract
Stochastic Partial Differential Equation Models for Highway Traffic
by
Gunnar Gunnarsson
We introduce a new model for multi-lane highway traffic, based on
stochastic partial differential equations. We prove that the model is
well-posed; has one and only one solution. We prove the existence
constructively and thus derive a numerical scheme to compute the
solution.
We examine measured traffic data and introduce a new method and
algorithm to estimate the fundamental diagram, an integral part of
almost every macroscopic highway traffic model.
vii
Contents
1 Background
1
1.1
Introduction . . . . . . . . . . . . . . . . . . . . . . . . . . . . . .
1
1.2
Notation . . . . . . . . . . . . . . . . . . . . . . . . . . . . . . . .
3
1.3
Models . . . . . . . . . . . . . . . . . . . . . . . . . . . . . . . . .
4
1.3.1
Macroscopic Models . . . . . . . . . . . . . . . . . . . . .
4
1.3.2
Microscopic Models . . . . . . . . . . . . . . . . . . . . . .
13
2 SPDE Model
18
2.1
Introduction . . . . . . . . . . . . . . . . . . . . . . . . . . . . . .
18
2.2
The SPDE Model . . . . . . . . . . . . . . . . . . . . . . . . . . .
23
2.3
Discrete System . . . . . . . . . . . . . . . . . . . . . . . . . . . .
26
2.4
Convergence to the SPDE System . . . . . . . . . . . . . . . . . .
35
2.4.1
Mild Formulation . . . . . . . . . . . . . . . . . . . . . . .
36
2.4.2
Tightness . . . . . . . . . . . . . . . . . . . . . . . . . . .
39
2.4.3
Martingale Problem Representation . . . . . . . . . . . . .
45
2.5
Uniqueness
. . . . . . . . . . . . . . . . . . . . . . . . . . . . . .
49
2.6
Conclusions and Remarks . . . . . . . . . . . . . . . . . . . . . .
54
3 Calibration and Simulation
56
viii
3.1
3.2
Data Analysis . . . . . . . . . . . . . . . . . . . . . . . . . . . . .
56
3.1.1
Viewing the Data . . . . . . . . . . . . . . . . . . . . . . .
57
3.1.2
Fundamental Diagram . . . . . . . . . . . . . . . . . . . .
60
3.1.3
Lane Shifting . . . . . . . . . . . . . . . . . . . . . . . . .
64
Numerical Simulations . . . . . . . . . . . . . . . . . . . . . . . .
65
Bibliography
67
A Relative Compactness Criteria
71
A.1 Arzela-Ascoli . . . . . . . . . . . . . . . . . . . . . . . . . . . . .
71
A.2 Relative Compactness in L2γ . . . . . . . . . . . . . . . . . . . . .
72
B The approximate heat kernels GN (t, x, y)
ix
73
List of Figures
1.1
Conservation of mass . . . . . . . . . . . . . . . . . . . . . . . . .
4
1.2
Stop and go traffic . . . . . . . . . . . . . . . . . . . . . . . . . .
6
1.3
Riemann initial data . . . . . . . . . . . . . . . . . . . . . . . . .
9
1.4
What would you do? . . . . . . . . . . . . . . . . . . . . . . . . .
9
1.5
Direction of travel . . . . . . . . . . . . . . . . . . . . . . . . . . .
10
2.1
Lane numbering . . . . . . . . . . . . . . . . . . . . . . . . . . . .
19
2.2
An example of a non-convex fundamental diagram . . . . . . . . .
26
2.3
Discretization . . . . . . . . . . . . . . . . . . . . . . . . . . . . .
29
2.4
Definition of the xn and jn . . . . . . . . . . . . . . . . . . . . . .
34
3.1
Bird’s eye view (cars driving across page) . . . . . . . . . . . . . .
57
3.2
Density . . . . . . . . . . . . . . . . . . . . . . . . . . . . . . . .
58
3.3
Density of one vehicle . . . . . . . . . . . . . . . . . . . . . . . . .
59
3.4
ρ as a function of time and space . . . . . . . . . . . . . . . . . .
60
3.5
Density ranges . . . . . . . . . . . . . . . . . . . . . . . . . . . . .
61
3.6
Finding the linear trend . . . . . . . . . . . . . . . . . . . . . . .
62
3.7
Inverse of estimated slopes . . . . . . . . . . . . . . . . . . . . . .
63
3.8
Estimate of fundamental diagram . . . . . . . . . . . . . . . . . .
64
3.9
Densities around lane switches (the diagonal is only for show) . .
65
x
3.10 Density on one of the lanes . . . . . . . . . . . . . . . . . . . . . .
xi
66
Chapter 1
Background
1.1
Introduction
Highway traffic modeling started in the 50s when car manufacturers started to
fear that increasingly crowded roads would lead to a drop in car sales. Due to
increasing traffic congestion in metropolitan areas the traffic problem has received
increased attention in the last few years. Researchers from many fields, including
mathematics, physics, civil engineering, computer science and economics, have
studied the problem from different perspectives, each with their own methodology.
The complexity of traffic is so great that it is unlikely that in the near future
there will be any unified theory applicable to every situation. Instead, each model
must be evaluated on its ability to describe or predict what it is designed for.
The benefits of finding accurate models are clear. Real-time traffic prediction
would enable drivers to avoid traffic jams, and thus reduce their impact. The
ability to predict the influence of road geometry and design before construction of
the road is obviously tremendously valuable. Testing new methods of controlling
traffic using mathematical models is easier, cheaper and safer than it is to test
1
them in real life. And finally, the importance of being able to effectively evacuate
large populated areas has recently been discussed in the media in the US. Those
are just few examples of the utility of traffic modeling.
Different disciplines may consider traffic problems from different perspectives.
In economics, for example, one could see the problem at the scale of a highway
system, and could try to control the overall traffic flow by introducing toll roads
[28]. In civil engineering, one might focus on developing methods of measuring
the traffic or designing roads for more efficient traffic flow. A physicist would
perhaps treat the traffic as a system of interacting particles and then apply the
tools of statistical mechanics to derive equations for the large scale behaviour of
the traffic flow. This approach gives rise to kinetic macroscopic models which
we discuss further below. Computer scientists might treat each car as a dot in a
grid, whose behaviour is determined by the position of the dots around it. Such
a system of dots is called a cellular automata. Of course one can also attempt to
accurately model the small scale behaviour of individual drivers. We will call all
models that treat individual vehicles, microscopic. Such models are also called carfollowing models since one postulates an equation, describing the behaviour of a
driver based on information about the vehicle in front. Finally, a mathematician’s
role in the greater scheme of things could be to prove the well-posedness of models
or to study some of their qualitative properties.
In table 1.1 we list some of the different kinds of models, and give historical
references. In the sections that follow we take a closer look at the entries in the
table that are labeled with an ∗.
2
Scale
Microscopic
Macroscopic
Type of equation
ODEs∗
Delay equations
Cellular automata
First order PDE∗
Second order PDE∗
Historical references
Treiber et. al [27]
Newell [18]
Nagel et. al [25]
Lighthill, Whitham [30]
Aw, Rascle [3], Helbing [12],
Zhang [31]
Table 1.1: Different traffic models and related references
1.2
Notation
We will use the following notation throughout this document.
• We denote by (t, x), time and space, t ∈ [0, ∞), x ∈ I ⊆ R. If units are
required we will measure time in seconds and length in feet since those are
the units of the data we work with in Chapter 3.
• We denote by ρ(x, t) ∈ [0, 1] the renormalized density of cars, i.e. ρ represents the number of cars per mile, divided by the maximum number of cars
per mile. This maximum is of course somewhat arbitrary since the maximum number of cars per mile is not well defined, it depends on the lengths
and types of vehicles.
• The flux of cars past a point x at time t will be denoted by q(x, t) (#cars/sec).
• The traffic flow velocity will be denoted by v. We have, by definition,
v(x, t) = q/ρ when ρ = 0, 0 otherwise.
When using the above quantities we are considering traffic as a kind of anisotropic
fluid.
3
1.3
Models
In this section we take a closer look at some of the aforementioned models.
1.3.1
Macroscopic Models
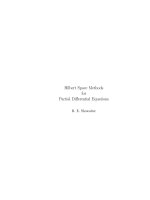
Conservation of Mass
A basis for almost every kind of PDE model for fluid dynamics is the equation for
the conservation of mass, i.e. if the highway has no exits or entries then no cars
are lost or produced on the road.
q(x0 , t)
q(x1 , t)
x1
x0
Figure 1.1: Conservation of mass
Assuming for now that ρ and q are continuous differentiable quantities we get,
see Figure 1.1,
d
dt
x1
x0
ρ(x, t)dx = q(x0 , t) − q(x1 , t),
(1.3.1)
i.e. the change in mass is only due to flux through the endpoints. Now dividing
by x1 − x0 and letting x0 → x1 gives
ρt (x, t) + qx (x, t) = 0
(1.3.2)
In the context of highway traffic, this step it is not as easy to justify as it is
in fluid dynamics, where the ratio of the size of the particles to the size of the
domain of interest is a lot smaller.
4
Simplest model
The single equation (1.3.2) has two unknowns, so to close the system we need
another equation. The simplest assumption is that q = Qeq (ρ), e.g. Qeq (ρ) =
ρ(1 − ρ)2 , leading to the equation
ρt + (Qeq (ρ))x = 0
(1.3.3)
where Qeq is the so called equilibrium flux. The graph of ρ → Qeq (ρ) is called the
fundamental diagram and is an essential part of macroscopic modeling of highway
traffic. This equation can then be solved if we are given the initial distribution
of cars, i.e. ρ(x, 0) = f (x). This model is usually called the Lighthill-WhithamRichards (LWR) model, after the authors that first introduced it [24], [16].
The behaviour of the solution of this model can be deduced using the method
of characteristics. In this case the characteristics are straight lines. Generally the
solution forms a shock and one resorts to weak solutions called entropy solutions.
For more on this equation, its solutions and shock fitting see [30].
The assumption q = Q(ρ) is somewhat dubious. It comes from assuming that
the behaviour of drivers depends only on the density of cars around them. One
could for example that drivers also respond to the rate of change of density.
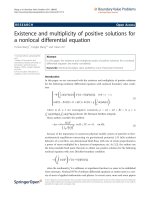
Another drawback of this model is its inability to predict stop-and-go traffic.
This situation in large cities is where drivers experience one traffic jam after
another and travel almost freely between them. In the (x, ρ) plane this would be
described by large amplitude waves, see Figure 1.2. The reason for this inability
is that the solution of equation (1.3.3) satisfies a maximum principle:
ρ(x, t) ∈ [inf ρ(y, 0), sup ρ(y, 0)]
y
y
5
ρ
Jams
Free travel
x
Figure 1.2: Stop and go traffic
for all x and t. So, if the initial profile does not have waves of large amplitude,
then the solution will not develop such waves at a later time.
This of course does not mean that the model is worthless, it just means that
it is not useful for predicting the aforementioned phenomenon.
Second Degree Models
Above we discussed problems related to the assumption that q = Q(ρ). In this
section we discuss two types of models that have been proposed to be able to
produce stop and go traffic, or so called “phantom” traffic jams (see Figure 1.2).
In the first kind of models, one assumes that drivers reduce their speed to
account for an increasing density. This assumption leads to the following relationship q = Q(ρ, ρx ). We consider only the special case
Q(ρ, ρx ) = Qeq (ρ) − ερx
(1.3.4)
where ε is some positive constant. Substituting this into (1.3.2) gives the second
degree equation
ρt + (Q(ρ))x = ερxx
6
(1.3.5)
Later on, we will propose a new stochastic model, (2.1.11), based on this equation.
The presence of the Laplacian ρxx will be essential for our analysis. Solutions to
this equation also satisfy a maximum principle and therefore it does not solve the
problem discussed above.
In the second kind of models, one includes effects of momentum and inertia.
This is often done by assuming that for a given traffic situation, drivers will adjust
their speed towards some desired velocity. It relates to the flux (1.3.4) by
Vdes = Q/ρ = Veq (ρ) − ε
ρx
ρ
(1.3.6)
where Veq (ρ) := Qeq (ρ)/ρ is thought of as the equilibrium velocity that drivers
would choose in uniform traffic of density ρ.
This leads to another way of closing equation (1.3.2), by a new equation (1.3.7)
for the velocity, v. In the model we introduce a relaxation time τ > 0 which
measures how fast v “relaxes” to the desired velocity Veq . Finally, we get the
following equation for the acceleration
vt + vvx =
1
dv
(x(t), t) =
dt
τ
V (ρ) − ε
ρx
−v .
ρ
(1.3.7)
Remark 1.3.1. As expected, if ρ is constant then the desired velocity reduces to
the equilibrium velocity Veq (ρ).
Remark 1.3.2. In equation (1.3.7) the function x(t) represents the position of a
car in the stream, or an “embedded particle”. More precisely, the function t → x(t)
describes the trajectory of a single car while v(x, t) describes the velocity of the
flow at every point. These two different ways of representing flows are called, in
fluid mechanics, the Lagrangian and Eulerian descriptions respectively.
7
Using q = ρv to couple this equation with (1.3.2) we arrive at the system
ρt + (ρv)x = 0
vt + vvx =
1
τ
Veq (ρ) − ε
ρx
−v ,
ρ
(1.3.8)
which is often called the Payne-Whitham (PW) model, suggested independently
in [20] and [30].
Remark 1.3.3. If we let ε = 0, then we ignore the effect of drivers taking into
account increasing density ahead, making the desired velocity Veq (ρ), and letting
τ → 0 makes the flow relax at a faster and faster rate, so in the limit τ = 0 we
can imagine it relaxing instantaneously. Thus if we let ε = τ = 0, we get the
simpler theory of the previous section.
The model (1.3.8) can be derived heuristically from a microscopic car following
model, we refer the interested reader to [30].
Remark 1.3.4. In 1995 Daganzo [5] pointed out serious inconsistencies with the
second degree models discussed so far, i.e. (1.3.8) and (1.3.5), and all other models
of the same kind known at that time.
• Some information travels faster than the cars, i.e. cars respond from stimuli
from behind, which is not realistic in traffic, since experience tells us that
drivers are mostly affected by what is happening in front of them. In fluid
dynamics terms we would phrase this by saying that the flow of cars is highly
anisotropic.
• The second order term ερxx in (1.3.5) has a smoothing effect that causes the
model to predict cars moving backwards. The system (1.3.8) has the the same
8
flaw; it predicts cars moving backwards. This can be seen by considering
Riemann initial data (see Figure 1.3). Then the last cars at the traffic jam,
ρ
t=0
x0
x
ρ
t>0
x0
x
Figure 1.3: Riemann initial data
ending at x0 , move backwards giving approximately the profile on the right
in Figure 1.3 after some small time t > 0.
More Models
In the last years, several new models that fix the defects described by Daganzo
(see Remark 1.3.4), have been introduced.
Two noticeable attempts are by Zhang [31] and Aw and Rascle [3]. Aw and
Rascle noticed that in certain situations the PW-model does not predict the right
behaviour of drivers. For example, in the situation in Figure 1.4, what would a
ρ
vhump > vyou
vyou
you
x
Figure 1.4: What would you do?
reasonable driver do? This is the situation at the time a driver enters a crowded
highway; having waited for a decrease in the density before entering, and finding
that when on the highway the cars ahead are going faster. The PW-model predicts
slowing down since the density in front of the driver is increasing, i.e. ρx > 0,
9
while most reasonable drivers would accelerate, i.e. catch up with the “hump” in
front.
This difference stems from the fact that cars are not travelling in the x direction
in the (t, x) plane, but rather in the direction (v, 1), as seen in Figure 1.5. Indeed
x
slope v
∆x
(t, x)
∆t
t
Figure 1.5: Direction of travel
we have
D(x,t) ρ(v, 1) = ∇ρ · (v, 1) = ρt + vρx = −vx ρ < 0
where the last equality used is the conservation law (1.3.2) and the inequality
comes from the fact that the cars ahead are going faster. To incorporate this in
the model (1.3.8) we first write the PW model as
ρt + (ρv)x = 0
1
vt + vvx = (V (ρ) − v) − p(ρ)x
τ
(1.3.9)
were p is some increasing function of ρ.
Remark 1.3.5. p(ρ)x = p′ (ρ)ρx so the constants ε and τ have been incorporated
in the function p.
Now the observation above about the travelling direction tells us that P (ρ)x
should be replaced by the convective or material derivative,
D := ∂t + v∂x
10
of p(ρ), giving the system
ρt + (ρv)x = 0
(1.3.10)
1
D(v + p(ρ)) = (V (ρ) − v)
τ
This model can be shown not to have the flaws Daganzo points out, at least in
the case of Riemann initial data for the homogeneous equations
ρt + (ρv)x = 0
(1.3.11)
D(v + p(ρ)) = 0
For more details see [22], [3].
This model can be derived from a microscopic model,
v˙ i = C
1
vi−1 − vi
+A
xi−1 − xi
τ
V
L
xi−1 − xi
− vi
(1.3.12)
where xi ,vi are the position and velocity of the ith vehicle, respectively, and C, A, τ
and L are constants, L representing a typical car length. Details of that derivation
can be found in [2]. Below in section 1.3.2 we introduce a very simple “heuristic”
method of turning almost any microscopic model into a macroscopic one. In
particular, when we use our method on (1.3.12) we do indeed obtain (1.3.10).
Continuous Kinetic Models
By analogy with the derivation of macroscopic models in particle physics, such
as the Boltzmann equation of fluids, one obtains a macroscopic model through a
continuum limit where the number of cars tends to infinity and the “total effect”
of their —sometimes probabilistic— behaviour is obtained via some kind of an
11
averaging process. Indeed in gas dynamics one averages out the random collisions
of single atoms to get equations for the large-scale behaviour of the gas. This
procedure typically leads to a system of deterministic PDEs.
This approach was first used in the context of vehicular traffic by Prigogine
and Herman in 1971, [21], and Paveri-Fontana in 1975, [19]. Recently some more
work has been done with this approach by Dirk Helbing, see [12].
Let us look a little closer to get a feeling for this method. Let A be the set
of vehicles under study. For example, in [12] the acceleration of vehicle α ∈ A, is
written in the following very general form,
dvα
= fα (vα ) +
fαβ (xα , vα , xβ , vβ ) + ξα (t)
dt
β=α
(1.3.13)
where x, v are as usual, position and velocity, fα represents the driver’s will to
travel at a certain speed (see below), fαβ represents the effect that car β has on
car α and ξα is a stochastic term that models variations in the driver’s behaviour.
• One “natural” choice of fα would be
fα (v) =
Vα − v
τ
where Vα is a desired velocity (possibly dependent on other factors such
as traffic density, vehicle type, etc.) and τ is as usual a relaxation time,
measuring how fast the driver reacts.
• On one lane, A ⊆ Z and vehicle n is just the n-th in line. If on the other
hand there are multiple lanes there is no natural way to index the vehicles.
• The model above is very general so one must make some simplifying as12
sumptions to be able to derive macroscopic equations.
From here, one proceeds by trying to mimic the effect of the fαβ with a Boltzmann-like interaction function. A good example can be found in [12].
In the next section we present a very simple heuristic method to obtain a
macroscopic model from a particular case of (1.3.13).
1.3.2
Microscopic Models
We consider a large subclass of the car-following models, (1.3.13). We denote the
velocity and position of a leading car by w and y respectively, and by xc and vc
for the vehicle under consideration. We assume
x˙c = vc
(1.3.14)
v˙c = F (y − xc , w − vc , vc ).
(1.3.15)
In particular, we assume that drivers’ behaviour depends only on their current
velocity, the distance to the next car in front and the velocity difference between
the two cars. Let
∆x = y − xc ,
∆v = w − vc .
Example 1.3.6. Examples of follow-the-leader models:
• The model (1.3.12) is given by F of the form
F (∆x, ∆v, vc ) = α V
L
∆x
− vc + β
where V is a given function and α, β are constant.
13
∆v
∆x
(1.3.16)