Effective way to measure brand attitudinal equity
Bạn đang xem bản rút gọn của tài liệu. Xem và tải ngay bản đầy đủ của tài liệu tại đây (1.22 MB, 63 trang )
UNIVERSITY OF ECONOMICS HO CHI MINH CITY
International School of Business
------------------------------
Nguyen Thi Minh Thu
EFFECTIVE WAY TO MEASURE
BRAND ATTITUDINAL EQUITY
MASTER OF BUSINESS (Honours)
Ho Chi Minh City – Year 2015
UNIVERSITY OF ECONOMICS HO CHI MINH CITY
International School of Business
------------------------------
Nguyen Thi Minh Thu
EFFECTIVE WAY TO MEASURE
BRAND ATTITUDINAL EQUITY
ID: 22110061
MASTER OF BUSINESS (Honours)
SUPERVISOR: Dr. Tran Ha Minh Quan
Ho Chi Minh City – Year 2015
EFFECTIVE WAY TO MEASURE BRAND ATTITUDINAL EQUITY
1
Acknowledgement
Firstly, I would like to thank all the lecturers and staffs in ISB who have been
supporting me throughout the course.
Secondly, I would like to express my special gratitude to Dr. Tran Ha Minh
Quan, my master thesis‟s supervisor, for providing me supporting materials, spending
time to review the draft and giving many comments and recommendations on my
work.
Finally, I would not be able to complete the thesis without supporting and
encouragement from my family and my friends in searching for necessary data and
information during the study process, I would like to thank all of them.
EFFECTIVE WAY TO MEASURE BRAND ATTITUDINAL EQUITY
2
Abstract
In Vietnam, market research is an emergent industry since 15 years around.
Regardless the Vietnamese companies or the international ones, domestic market
research industry cannot avoid the global trend: Brand needs agencies to be faster,
more predictive on what consumers‟ plan to do and even cheaper – “conflicted”. This
research is aimed to introduce a effective way to measure brand equity to solve this
problem in both tracking projects and ad-hoc usage and attitude project. This
measurement can be used as a strong product for local agencies. This also probably
helps the agencies shorten the questionnaire length and cost as a consequence.
Specifically, the objective of this research is to validate whether this new
measurement that can be used for calculating the brand equity is strong/ powerful
enough in Vietnam market, which means:
(1) Brand Attitudinal Equity has the positive impact on Brand Claimed Share of
Wallet
(2) Brand Attitudinal Equity has the positive impact on real brand market share
In order to achieve objectives, the researcher employed quantitative methods.
Primary data was collected through a survey by questionnaire. The questionnaire was
based on literature review and focused on variables to measure brand attitudinal
equity. In order to validate two hypotheses, the author applied linear regression, curve
regression. The results showed that that there is positive impact of brand attitudinal
equity to brand claimed share of wallet (individual level) and to real brand market
share (aggregate level). Some limitations and implication for future research are also
mentioned in this study.
Key words
Brand attitudinal equity, measurement, brand equity, Zipf distribution
EFFECTIVE WAY TO MEASURE BRAND ATTITUDINAL EQUITY
3
TABLE OF CONTENT
Chapter 1: Introduction ................................................................................................6
1.1. Background: .......................................................................................................6
1.2. Research questions .............................................................................................7
1.3. Research significance .........................................................................................8
1.4. Research boundary .............................................................................................8
1.5. Research structure ..............................................................................................9
Chapter 2: Literature review and research model ...................................................11
2.1. Brand Equity and Brand attitudinal equity: .....................................................11
2.1.1. Brand Equity: ............................................................................................11
2.1.2. Brand attitudinal equity: ............................................................................16
2.2. New approach – Zipf distribution: ...................................................................17
2.2.1. The Zipf distribution (or power law): .......................................................17
2.2.2. The Zipf distribution applied to calculate brand attitudinal equity: .........21
2.3. Research Model................................................................................................23
2.4. Measurement explanation: ...............................................................................24
2.4.1. Attitudinal equity: .....................................................................................24
2.4.2. Claimed Share of Wallet: ..........................................................................24
2.4.3. Market share: .............................................................................................25
Chapter 3: Research Method .....................................................................................27
3.1. Research philosophy ........................................................................................27
3.2. Research method: .............................................................................................29
3.3. Research design: ..............................................................................................30
EFFECTIVE WAY TO MEASURE BRAND ATTITUDINAL EQUITY
4
3.3.1. Quantitative research: ................................................................................30
3.3.2. Target respondents: ...................................................................................31
3.3.3. Sampling method: .....................................................................................32
3.3.4. Questionnaire design: ................................................................................34
3.4. Data analysis ....................................................................................................35
3.5. Limitation of the method: ................................................................................35
3.6. Research ethics:................................................................................................36
Chapter 4: Research Result ........................................................................................37
4.1. Background information analysis: ...................................................................37
4.2. Calculation of brand attitudinal equity: ...........................................................37
4.3. Hypothesis Validation: .....................................................................................39
4.3.1. Validation among respondent level:..........................................................39
4.3.2. Validation among aggregate level:............................................................44
4.3.2.1.
Building of aggregate “brand attitudinal equity” variable: ................44
4.3.2.2.
Curvilinear regression: .......................................................................44
4.4. Result: ..............................................................................................................46
Chapter 5: Research Implication ...............................................................................48
5.1. Research contribution: .....................................................................................48
5.2. Specific Implications: ......................................................................................50
5.2.1. Build up questionnaire: .............................................................................50
5.2.2. Build up calculation: .................................................................................51
5.2.3. Possible further analysis:...........................................................................51
5.3. Research limitation: .........................................................................................52
5.4. For further research: .........................................................................................53
EFFECTIVE WAY TO MEASURE BRAND ATTITUDINAL EQUITY
5
References.....................................................................................................................54
APPENDIX...................................................................................................................56
EFFECTIVE WAY TO MEASURE BRAND ATTITUDINAL EQUITY
6
Chapter 1: Introduction
1.1.
Background:
In Vietnam, market research is an emergent industry since 15 years around. One
of the first and the biggest companies shoot the lively shot for this industry is AC
Nielsen. Up to this day, the game for market research is blooming with many players
joined including not only international companies such as Kantar World Panel,
Millward Brown, TNS, FTA, Ipsos, Epinion, Chimigo,… but also local agencies such
as Tita, FFL, AMCO, The Window… However, regardless the Vietnamese companies
or the international ones, domestic market research industry cannot avoid the global
trend: “the research will be much cheaper, more insightful, predictive and faster. The
existing model of market research, in particular the large trackers, is broken. It is too
slow, too expensive, and not sufficiently useful.” – Jan Hofmeyr (2013) – TNS Chief
Researcher – gave his points of view regarding the market research trend in the future
In the Mobile World (MRMW) Conference 2013 in London. And the analytics seems
like usually report what did happen weeks or months ago rather than predicting what is
likely to happen next. Obviously, there is sign of changing raised in the market
research industry on the world. Many market research companies have adjusted their
strategy in order to focus on new products/ models – which are not only simpler/ easier
to measure but also more helpful in predicting.
Brand needs agencies to be faster, more predictive on what consumers‟ plan to
do and even cheaper – which means, the current status of research agencies in Viet
Nam does not meet brand‟s expectation. This is the conflict that needs to be solved.
Look at the conflict given, especially for trackers (as mentioned) where people
usually spend at least 45 – 60 minutes to answer the full questionnaire (Mai, 2014),
would the market research companies need to review their model again – to make their
EFFECTIVE WAY TO MEASURE BRAND ATTITUDINAL EQUITY
7
questionnaire length shorter but the model is still powerful? Remember that the adult
brain can effectively focus and concentrate for up to 25 minutes only (Chrapko, 2014).
Cases of international companies seem to be more optimistic than the local ones
due to the development from mother branch. Sooner or later, these companies would
be able to change their focusing and change more easily and quickly. They can get
more advantages than Vietnam market research companies since they have the power
to “grow” research products. Usually, local companies don‟t have any new products
which are validated worldwide and improved time-to-time. The old/ backward and
modest methodology makes Vietnam companies losing their competitions among
blooming market research field.
This research is aimed to introduce an effective way to measure brand equity
with well-validation in Vietnam market. Brand equity is the most important section in
both tracking projects and ad-hoc usage and attitude project. This measurement can be
used as a strong product for local agencies. This also probably helps the agencies
shorten the questionnaire length and cost as a consequence.
1.2.
Research questions
The objective of this research is aimed to validate whether this new
measurement that can be used for calculating the brand equity is strong/ powerful
enough in Vietnam market.
This study would answer the above question. With the result of the study, not
only local market research agencies or Vietnamese market research team – who do not
have the specific model to measure brand equity can consider applying without any
doubt, but also international companies – who have already built their model globally
can consider improving their product more competitive.
EFFECTIVE WAY TO MEASURE BRAND ATTITUDINAL EQUITY
1.3.
8
Research significance
Firstly, mentioning about brand equity, there is a huge storage of research topics,
studies talking about this. However, brand attitudinal equity is totally difference.
Attitude is not behavior, it is more about the one‟s perception towards a brand, it lead to
the probability buy or not buy if consumers want or do not want buy a brand. The first
significance of this research is – talking about measurement “brand attitudinal equity”
but “brand equity”.
Secondly, this research is aimed to provide a measurement that can be applied
during research work in research agencies. If this measurement is well-validation in
Vietnam, it can be used regardless any individual company. They can use without
“black box” confidential requirements to consult their clients.
Finally, there is no research in Vietnam doing the validation this “brand
attitudinal equity” measurement based on Zipf distribution.
1.4.
Research boundary
To validate a new measurement, the previous researcher has used many sources
of sample to compare together: building panel samples, conducting many surveys
across countries, conducting surveys across categories….Due to limitation of time,
capability and the ability to access information, this research focuses on the validation
within study, within Vietnam market only and with three categories of beverages.
Moreover, the target respondents were also chosen based on the assumption that these
population account for 80% of categories‟ user.
However, the result provided is still able to answer whether this measurement is
strong enough to be used for Vietnam market or not.
EFFECTIVE WAY TO MEASURE BRAND ATTITUDINAL EQUITY
1.5.
9
Research structure
Chapter 1 – Introduction
This chapter gives an overview of the research. Chapter 1 –introduction is built
with the meaning as its name. In this chapter, the background information about the
topic is discussed, such as the context, the significance of the research. The concepts of
topic are mentioned in a general way, which builds the topic of the research. The
research aim and objectives are also discussed. This chapter also introduces the
boundary and structure of the research.
Chapter 2 – Literature review
This chapter analyzes the aspects of brand equity, especially the effective way to
measure brand attitudinal equity – Zipf distribution. In the first part, the concept of
brand equity, brand attitudinal equity and the current measurements of brand equity in
the world (public research and “black box” products of some market research
companies. In the second part, the author talks more deeply about Zipf distribution and
how to apply it in order to calculate brand attitudinal equity. The third and most
important section of chapter 2 is building models to be validated in chapter 3 and
chapter 4.
Chapter 3 – Research methodology
This chapter describes the research strategy, including collecting information
methods, data sources and methods of analysis used in the research. This chapter also
identifies the limitations of research method as well as potential problems may be
encountered with the chosen research technique and strategy
EFFECTIVE WAY TO MEASURE BRAND ATTITUDINAL EQUITY
10
Chapter 4 – Research result
This chapter presents and analyzes the data collected in the implementation
research. Within the scope of this research, despite limitation of time and ability to
access information, the research result answers the research questions. Chapter 4 ends
with conclusion of the hypothesis provided in chapter 2: whether rejected null
hypothesis or not.
Chapter 5 – Research Implication
This chapter summarizes the main ideas, the main findings of the research and
offers recommendations drawn from these findings. Simultaneously, this chapter also
draws the limitations of the research, which suggest directions for further researches.
EFFECTIVE WAY TO MEASURE BRAND ATTITUDINAL EQUITY
11
Chapter 2: Literature review and research model
A effective measure of brand attitudinal equity based on the Zipf
distribution
2.1.
Brand Equity and Brand attitudinal equity:
2.1.1. Brand Equity:
Brand Equity concept is a “multiheaded monster” (Franzen & Moriaty, 2009).
There is a variety of definition with practically no common ground. Aaker (1991) has
defined the concept of brand equity as follows: “A consumer perceives a brand‟s
equity as the value added to the functional product or service by associating it with the
brand name” or clearer “Brand equity is a set of assets (and liabilities) linked to a
brand‟s name and symbol that adds to (or subtracts from) the value provided by a
product or service to a firm and/or that firm‟s customers” (Aaker, 2002). Meanwhile,
Kohli confirms that brand equity is defined as “the differential effect of brand
knowledge on customer response”, three elements of this definition need to be
emphasized. On the other hand, Travis considers that brand loyalty is the ultimate
objective and meaning of brand equity – brand loyalty is brand equity. According to
the classic definition of brand loyalty (Jacoby & Kyner, 1973), loyal consumers are the
ones who use a brand repeatedly since they are strongly attached to it. This means that
true brand loyalty is „high share of wallet‟ underpinned by attitudinal preference. In
general, regardless many different definitions, the author‟s subjective understanding of
brand equity obviously refers to the consumers‟ perception of the brand.
There has been little convergence on how to measure brand equity:
Originally it was proposed that brand equity could be measured by the „Brand
Equity Ten‟ (Aaker, 1991) which recommended the use of ten measures. In a more
12
EFFECTIVE WAY TO MEASURE BRAND ATTITUDINAL EQUITY
recent academic journal article on the topic (Vogel et al, 2008) four measures were
proposed:
Brand Loyalty (Reduced marketing costs, Trade leverage, Attracting new
customers via awareness and reassurance, Time to respond to competitive
threats)
Brand Awareness (Anchor to which other associations can be attached,
Familiarity which leads to liking, Visibility that helps gain consideration, Signal
of substance/commitment)
Brand Associations, including Perceived Quality (Help communicate
information,
Differentiate/Position,
Reason-to-buy,
Create
attitude/feelings)
Basis for extensions.
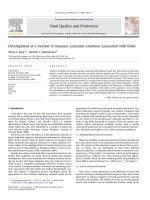
Keller (1993) also proposes another model to calculate the brand equity:
Table 2.1: Dimension of Brand Knowledge
Source: Journal of Marketing, Vol. 57, No. 1 (Jan., 1993)
positive
EFFECTIVE WAY TO MEASURE BRAND ATTITUDINAL EQUITY
13
Meanwhile, marketing research firms have developed their own methods:
Ipsos Company:
The Equity Builder: is comprised of specific questions that can be incorporated
into any kind of tracking program. It provides a single number called Brand
Health Index (BHI) representing the value of the brand in the minds of
consumers. All of these key performance indicators can be tracked over time,
compared between competitive brands or for the same brands across different
markets, and reviewed by key samples (such as brand users and non-users)
Brand Health Index:
Variables:
Consumer perception (Familiarity, Uniqueness, Relevance, Popularity,
Quality):
Category involvement (Brand sensitivity, Substitutability)
Price perception (Price comparison, Price evaluation)
EFFECTIVE WAY TO MEASURE BRAND ATTITUDINAL EQUITY
14
Questions to build variables:
Consumer perception: Using a scale from 1 to 10, please indicate how much you
agree or disagree with each of the following statements for each of the
brands outlined below. ‟1‟ means you don‟t agree at all and „10‟ means
you agree very much. For each statement, please give any score from 1 to
10 for the first brand, then move across and rate the next brand, then the
third brand, and so on. Then repeat for each of the statements. The more
you agree, score closer to 10. The less you agree, score closer to 1. Please
give a score for each brand based on your impressions, even if you are
not very familiar with the brand.
Category involvement: As a consumer, each month you make many brand
choices when purchasing different products and services. Thinking of
/category/, how much do you care about your choice between the
different brands? Please give a score from 1 to 10, where ‟1‟ means you
don‟t care at all, and „10‟ means you care very much about your choice
between brands.
Price perception: How would you rate the price of each brand compared to other
brands currently available in the market? [SA FOR EACH BRAND]
This brand is usually priced…......... 5-point scale.
EFFECTIVE WAY TO MEASURE BRAND ATTITUDINAL EQUITY
15
Nielsen Company:
The Winning Brands: Nielsen calculates the brand equity of a brand by using
Brand Equity Index (BEI). BEI is measured from 3 different factors: based on
consumers‟ response to their (1) favorite brand, (2) brand they would
recommend and (3) willingness to pay a price premium.
Variables:
Preferred brand
Recommended brand
Willingness to pay price premium
Millward Brown Company:
The BrandDynamics: Brand Equity is reflected in the Bonding level of the
Brand Pyramid, which portrays the journey a brand goes through in solidifying
its relationship with target consumers.
Variables:
Presence (Awareness of brand “Do I know about it?”)
Relevance (Personal relevance “Does it offer me something?)
EFFECTIVE WAY TO MEASURE BRAND ATTITUDINAL EQUITY
16
Performance (Adequate performance “Can it deliver?”)
Advantage (Superior performance “Does it offer something better than
others?”)
Bonding (Bond with brand “Nothing else beats it?”)
Consumers are allocated to a level of the pyramid based on their experience of
and attitude to the brand. The levels relate to engagement with the brand. The
closer a consumer feels to the brand, the more likely they are to buy (or
use/choose) it. A consumer at one level is also counted in the % of consumers at
all lower levels.
These above measurements only have the aggregate level for brand equity.
2.1.2. Brand attitudinal equity:
Perception is not behavior.
Perception is always a part of behavior, and behavior is a special kind of body
process (Gendlin, 1998). It means that there can be a difference between preference
(what people want to do) and behavior (what they actually do). Market circumstances
may interfere with what people use or buy. An important aspect of the schema is the
17
EFFECTIVE WAY TO MEASURE BRAND ATTITUDINAL EQUITY
separation of the dependent variables for modeling, into attitudinal and behavioral
components. This is because marketers can only know what‟s driving the strength of
the desire to use or buy their brands if they have an attitudinally pure outcome against
which to model. The measure of attitudinal equity aims to provide such an outcome.
All of which stake their claims at measuring brand equity in some way or
another. However, there is no measurement can give the equity per each observation
level.
2.2.
New approach – Zipf distribution:
Applying Zipf Distribution model in measuring the brand attitudinal Equity
comes from a study of Jan Hofmeyr and Paul Holtzman (2008). The study was
published in International Journal of Market Research Vol. 50 Issue 2 with huge
number of observations across many countries but Vietnam (e.g UK, Spain, Australia,
Greece…). By using mathematic of Zipf distribution, the prediction for brand equity
was well-validated.
2.2.1. The Zipf distribution (or power law):
Zipf's law arose out of an analysis of language by linguist George Kingsley Zipf
(1902–1950), who theorized that given a large body of language, the frequency of each
word is close to inversely proportional to its rank in the frequency table. That is:
where a is close to 1.
Before the first proposal of Zipf law, actually the French stenographer JeanBaptiste Estoup (1868–1950) appears to have noticed the regularity. It was also noted
in 1913 by German physicist Felix Auerbach (1856–1933). However, until Zipf‟s
delivery, this distribution become an empirical law formulated using mathematical
statistics,
refers
to
the
fact
that
many
types
of
data
studied
in
EFFECTIVE WAY TO MEASURE BRAND ATTITUDINAL EQUITY
18
the physical and social sciences can be approximated with a Zipfian distribution, one
of a family of related discrete power law probability distributions.
The Zipf distribution can be used to account for the relative popularity of a few
members of a population and the relative obscurity of other members of a population.
Examples include the following.
There are a few websites that get lots of hits, a greater number of
websites that get a moderate number of hits, and a vast number of
websites that hardly get any hits at all (like this one).
A library has a few books that everyone wants to borrow (best sellers), a
greater number of books that get borrowed occasionally (classics), and a
vast number of books that hardly ever get borrowed.
A natural language has a few words that are used with high frequency
(“the” and “of” rank first and second in English), a greater number of
words that get used with lower frequency (like “butter” and “joke”), and
a vast number of words that hardly ever get used at all (like
“defenestrate” which means to throw out of a window, “lucubration”
which means a study or composition lasting late into the night, or
“mascaron” which means a grotesque face on a door-knocker).
EFFECTIVE WAY TO MEASURE BRAND ATTITUDINAL EQUITY
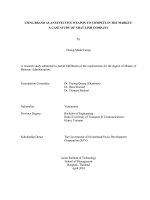
19
Figure 2.1: Relationship curve between word length and word usage frequency
The world population lives in several large cities, a greater number of
medium-sized cities, and a vast number of small towns
There are some other examples that illustrate the relationship between “rank”
and “frequency plots” according to Newman, 2006:
EFFECTIVE WAY TO MEASURE BRAND ATTITUDINAL EQUITY
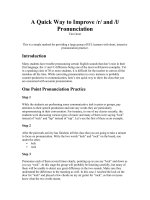
20
Figure 2.2: Cumulative distribution or “rank/frequency plots” of nine quantities
reputed to follow power law
(a) Numbers of occurrences of words in the novel Moby Dick by Hermann Melville.
(b) Numbers of citations to scientific papers published in 1981, from time of
publication until June1997.
(c) Numbers of hits on web sites by 60 000 users of the America Online Internet
service for the day of 1 December 1997.
(d) Numbers of copies of bestselling books sold in the US between 1895 and 1965.
(e) Number of calls received by AT&T telephone customers in the US for a single day.
(f) Magnitude of earthquakes in California between January 1910 and May 1992.
Magnitude is proportional to the logarithm of the maximum amplitude of the earthquake, and
hence the distribution obeys a power law even though the horizontal axis is linear.
EFFECTIVE WAY TO MEASURE BRAND ATTITUDINAL EQUITY
21
(g) Diameter of craters on the moon. Vertical axis is measured per square kilometre.
(h) Peak gamma-ray intensity of solar flares in counts per second, measured from
Earth orbit between February 1980 and November 1989.
(i) Intensity of wars from 1816 to 1980, measured as battle deaths per 10 000 of the
population of the participating countries.
To summary, Zipf distribution specifies a mathematical relationship between
the rank of a phenomenon and its frequency or size.
Formally, let:
N be the number of elements;
k be their rank;
s be the value of the exponent characterizing the distribution.
Zipf's law then predicts that out of a population of N elements, the frequency of
elements of rank k, f(k;s,N), is:
(Equation 2.1)
The ranking criterion is usually the frequency or size of each observation.
2.2.2. The Zipf distribution applied to calculate brand attitudinal equity:
When applied to survey data in order to specify the likelihood that a person will
use or buy a brand, the appropriate form of the law is:
(Equation 2.2)
j be the brand being scored;
m be the number of brands that are relevant to that person;
s be the value of the exponent characterizing the distribution.
EFFECTIVE WAY TO MEASURE BRAND ATTITUDINAL EQUITY
22
The estimates sum to 1 at respondent level. Although these are point-in-time
estimates, they should correlate with share-of-wallet behavior as estimated during or at
the same time.
“S” exponent
Basically, what the “s” does is determine how steep the curve of distribution
will be. Therefore, they calculated it by optimizing against claimed share. “S” would
vary as a function of the size of someone‟s brands chosen, and of course would be
different among countries. “s” exponent by setting the calculation as below:
-
Turn the brand ratings into respondent-level brand rankings
-
Estimate values for the parameter “s” in equation (2). By ranking and allowing
ties, we preserve two important principles of attitudinal brand commitment –
namely, that people may be ambivalent about which brands they prefer
(Hofmeyr & Rice 2000); and, second, that the performance of a brand relative
to its competitors counts for more than its absolute rating (e.g. Bowman &
Narayandas 2004).
-
To optimize “s”, plug brand rankings into equation (2) and use the “solver”
function in Excel. Since there should be an association between a brand‟s
attitudinal equity and the likelihood that a person will use or buy a brand –
using claimed share of wallet as the dependent variable.
To simplify it, as discussion with Hofmeyr, the author decided to use the unique
“s” to calculate the brand attitudinal equity. In fact, the result of Hofmeyr‟s model
showed that:
The best correlation with claimed share, overall, is achieved with s = 1.35. I
have subsequently confirmed this with panel data. However, we also noticed
that you can get better results if you allow the “s” to vary as a function of the
size of someone‟s evoked set. So we optimized “s” for different sizes of evoked
EFFECTIVE WAY TO MEASURE BRAND ATTITUDINAL EQUITY
23
set. Basically, what happens as people use more brands is that the curve
flattens. Then we discovered that even though we got better results when we
allowed the “s” to vary, aggregating up didn‟t actually lead to much
improvement in prediction. So, based on Occams Razor (the principle that all
the additional computation didn‟t lead to much better prediction), we decided to
stick to the one value. – quoted from Hofmeyr‟s email (2014)
Come into the validation, Hofmeyr used both claimed share of wallet and the
real-world brand metrics to validate the result of this calculation:
-
Within-survey validation against claimed share (individual level)
-
Validation against behavior measured in panels (individual level)
-
Other forms of validation: correlation with real market share (aggregate level)
-
Consumer behavior in a scanner panel
With four validations, Hofmeyr (2008) concluded “Changes in respondent-level
attitudinal equity are associated with changes in real behavior, circumstances
allowing.” In the other hand, this approach works.
2.3.
Research Model
With the same approaching with Hofmeyr as above, the authors applied in
Vietname market with three categories of beverages: ready to drink tea, energy drink
and herbal tea. There are also three steps that need to be worked on:
-
Validating against claimed share of wallet (individual level)
-
Validating against market share (retail audit data) (aggregate level)
Due to the limitations of resources, the author does not build the behavioral
panel to compare. The model for validation should be as below: