Access to Credit and Household Income in the Northern Mountains of Vietnam (LV thạc sĩ)
Bạn đang xem bản rút gọn của tài liệu. Xem và tải ngay bản đầy đủ của tài liệu tại đây (5.42 MB, 237 trang )
JUSTUS-LIEBIG UNIVERSITÄT GIESSEN
Fachbereich 09: Agrarwissenschaften, Ökotrophologie und Umweltmanagement
Access to Credit and Household Income in the Northern
Mountains of Vietnam
Inaugural-Dissertation zur Erlangung des Doktorgrades (Dr. Agr.)
Fachbereich Agrarwissenschaften, Ökotrophologie und Umweltmanagement
Institut für Betriebslehre der Agrar - und Ernährungswirtschaft
Professur für Projekt – und Regionalplanung
Eingereicht von: Do Xuan Luan (MSc.)
Erstgutachter: Prof. Dr. Siegfried Bauer
Zweitgutachter: Prof. Dr. Rainer Kühl
Giessen – November, 2015
Số hóa bởi Trung tâm Học liệu – ĐHTN
PREFACE
This volume provides a comprehensive analysis on the issues of rural credit conducted in the
Northern Mountainous Region of Vietnam. The study has been carried out within the
―Agricultural Economics and Related Sciences‖ program at the University of Giessen,
Germany. A crucial advantage of this study is that it combined various econometrics tools
using data collected from the national household surveys to examine the extent to which credit
serves the poor, with regard to access constraints and income impacts.
The empirical findings reveal that the poor, especially the poorest households are still
underserved by overall rural credit. The Agribank credit tends to provide to wealthier
households and informal credit serves households that are closer to and above the relative
poverty line. Subsidized credit successfully targeted the poor, implying that governmental
subsidies are necessary to reach the poor. Credit accessibility analysis has highlighted the
importance of social capital and agricultural extension services in determining credit
accessibility by rural households. Whereas a significant increase in household income can be
achieved through accessing commercial and informal loans, there is no significant increase in
all income components for associated recipients of subsidized credit. Based on the findings of
the study, a set of policy implications aimed at improving poverty targeting and credit access
can increase the impact of credit on reducing poverty in a sustainable manner.
For the editors: Siegfried Bauer, University of Giessen, Germany
ACKNOWLEDGEMENTS
First and foremost, I am deeply indebted to my first supervisor Prof. Dr. Siegfried Bauer for his
continuous guidance, moral support and encouragement throughout this process. I am also
thankful to my second supervisor Prof. Dr. Rainer Kühl for his constructive suggestions.
Guidance and understanding from both supervisors proved crucial to the successful completion
of this work. My thanks also go to the members of the examination committee, Prof. Dr.
Ingrid-Ute Leonhäuser, Prof. Dr. Joachim Aurbacher and Prof. Dr. Michael Schmitz. The
administrative support and cooperation of Mrs. Schlocker, Dr. Evelina and Dr. Tarig is also
worth mentioning. I would also like to express my appreciation to Heinz Lakos for his
technical support, to Mr. Danner McCulloh for his English correction of the text, to Mr.Max
and Dr. Aaron for their correction of the German summary. I also acknowledge the Vietnamese
Ministry of Education and Training for the doctoral scholarship. My sincere thanks go to the
faculty of economics and rural development at Thai Nguyen University of Agriculture and
Forestry. I would like to thank the Central Institute for Economic Management (CIEM) of
Vietnam for providing the data and Dr. Kieu Thi Thu Huong for supporting me in my
application for the doctoral program. I would like to take this opportunity to thank Mr. Nguyen
Thanh Vu and international colleagues for their support.
The inspiration and support of my father Do Xuan Luong, mother Vu Thi Sau, my brothers and
sisters were my main source of strength. My heartfelt appreciation goes to them. My deepest
thanks go to my son Do Anh Duc, my daughter Do Khanh Linh and my wife Duong Thi Thu
Hang for their inspiration, support and sacrifice.
Số hóa bởi Trung tâm Học liệu – ĐHTN
i
TABLE OF CONTENTS
TABLE OF CONTENTS
TABLE OF CONTENTS ......................................................................................... i
LIST OF TABLES ................................................................................................ viii
LIST OF FIGURES ................................................................................................. x
LIST OF ACRONYMS AND ABBREVIATIONS ............................................... xi
1. INTRODUCTION ............................................................................................... 1
1.1 Background of the study................................................................................ 1
1.2 Statement of the problem .............................................................................. 1
1.3 Objectives ...................................................................................................... 3
1.4 Hypotheses of the study ................................................................................ 4
1.5 Scope and limitations of the study ................................................................ 4
1.6 Contribution of the study............................................................................... 4
1.7 Structure of the study .................................................................................... 5
2. AN OVERVIEW OF ECONOMY, POVERTY AND RURAL CREDIT
SYSTEM IN VIETNAM ......................................................................................... 6
2.1 Geography ..................................................................................................... 6
2.2 Macroeconomic performance ........................................................................ 6
2.2.1
Key development indicators ................................................................. 6
2.2.2
GDP, credit and inflation in Vietnam ................................................... 7
2.2.3
Economy‘s structure share in Vietnam ................................................. 8
2.3 Agriculture and Poverty ................................................................................ 9
2.3.1
Agricultural performance...................................................................... 9
2.3.2
Rural labors ......................................................................................... 11
2.3.3
Fragmentation of agricultural land ..................................................... 11
2.3.4
Poverty in Vietnam ............................................................................. 12
2.3.5
Agricultural insurance in Vietnam ..................................................... 13
2.4 Rural credit in Vietnam ............................................................................... 14
2.4.1
Brief history of rural credit policy in Vietnam ................................... 14
2.4.1.1 Credit cooperatives before 1986 ..................................................... 14
Số hóa bởi Trung tâm Học liệu – ĐHTN
ii
TABLE OF CONTENTS
2.4.1.2 Replacement of the mono-tier banking system after 1986 ............. 15
2.4.1.3 The separation between preferential and commercial lending ....... 16
2.4.1.4 Incorporation of microfinance institutions in the financial system 17
2.4.1.5 Priorities for lending agricultural and rural sector .......................... 18
2.4.2
Rural credit demand ........................................................................... 18
2.4.3
Supply side of rural credit in Vietnam ............................................... 20
2.4.3.1 Formal, semiformal and informal credit ......................................... 20
2.4.3.2 Market share and financial sustainability ....................................... 22
2.5 Summary of the chapter .............................................................................. 24
3. THEORETICAL AND EMPIRICAL FOUNDATIONS OF THE STUDY .... 25
3.1 Concept of credit and general issues ........................................................... 25
3.1.1
The credit concept .............................................................................. 25
3.1.2
Types of credit .................................................................................... 26
3.1.3
The triangle of credit .......................................................................... 27
3.1.4
Challenges for the provision of credit to rural households ................ 28
3.1.4.1 Principle of marginal return to capital ............................................ 28
3.1.4.2 Information asymmetry ................................................................... 29
3.1.4.3 Characteristics of farming activities ............................................... 30
3.1.4.4 Principal – agent problem in rural credit market ............................ 31
3.1.4.5 Transaction cost and borrowers‘ risk management ........................ 32
3.2 Poverty outreach of credit ........................................................................... 33
3.2.1
Depth of outreach concept and measurement .................................... 33
3.2.1.1 Concept ........................................................................................... 33
3.2.1.2 Measurement ................................................................................... 33
3.2.2
Empirical evidence on poverty outreach of credit ............................. 35
3.2.2.1 The extent to which credit serves the poor ..................................... 35
3.2.2.2 Reasons explaining the credit exclusion of the poor ...................... 35
3.2.3
Credit subsidy ..................................................................................... 37
3.2.4
Summary............................................................................................. 37
3.3 Access to credit ........................................................................................... 38
3.3.1
Concepts and approaches of analyzing credit accessibility ............... 38
iii
TABLE OF CONTENTS
3.3.2
Empirical determinants of credit access at household level ............... 40
3.3.3
Summary ............................................................................................. 41
3.4 Credit repayment ......................................................................................... 42
3.4.1
Role of credit repayment .................................................................... 42
3.4.2
Measurement for repayment performance .......................................... 42
3.5 Welfare impact of credit .............................................................................. 44
3.5.1
How credit affect households ............................................................. 44
3.5.2
A foundation for impact estimation .................................................... 46
3.5.3
Empirical evidence on impact of credit .............................................. 47
3.5.3.1 Significantly positive impact of credit ............................................ 47
3.5.3.2 Limited impact of credit and reasons .............................................. 49
3.5.3.3 Mixed impacts of credit under certain conditions ........................... 50
3.5.4
Summary ............................................................................................. 50
3.6 International experiences in rural credit development ................................ 51
3.6.1
Germany.............................................................................................. 51
3.6.2
Bangladesh .......................................................................................... 52
3.6.3
Philippines .......................................................................................... 54
3.6.4
Indonesia ............................................................................................. 55
3.6.5
Thailand .............................................................................................. 56
3.6.6
Lessons to be learnt ............................................................................ 57
3.7 Conceptual framework ................................................................................ 58
4. RESEARCH AREA AND ANALYSIS OF SAMPLED HOUSEHOLD
CHARACTERISTICS ........................................................................................... 60
4.1 Overview of the Northern Mountainous Region of Vietnam ..................... 60
4.1.1
Overall socio-economic conditions .................................................... 60
4.1.2
Overview of the selected communes .................................................. 62
4.2 Data source .................................................................................................. 63
4.3 Composition of selected households by sources of loans ........................... 66
4.3.1
Loan characteristics ............................................................................ 68
4.3.1.1 Loan amount, duration and interest rate .......................................... 68
4.3.1.2 Collateral security............................................................................ 69
Số hóa bởi Trung tâm Học liệu – ĐHTN
iv
TABLE OF CONTENTS
4.3.1.3 Mode of repayment ......................................................................... 70
4.3.1.4 Credit use purposes ......................................................................... 70
4.4 Demographic characteristics of selected households.................................. 72
4.5 Main agricultural activities ......................................................................... 74
4.5.1
Crop production .................................................................................. 74
4.5.2
Livestock production .......................................................................... 75
4.5.3
Land size and land use certificate....................................................... 76
4.6 Access to extension services ....................................................................... 78
4.6.1
Receives of extension services categorized by sources of loans........ 78
4.6.2
Feedback of household to extension services .................................... 79
4.6.3
Extension and credit access ................................................................ 81
4.6.4
Extension and household income ....................................................... 82
4.6.5
Extension and other household endowments ..................................... 84
4.7 Shocks and economic losses ....................................................................... 86
4.7.1 Type of shocks and distribution of shock affected households by loan
sources and provinces ..................................................................................... 86
4.7.2
Economic losses due to shocks .......................................................... 88
4.7.3
Household endowments categorized by shock affected ..................... 89
4.7.3.1 Income difference ........................................................................... 89
4.7.3.2 Differences in selected variables between shock-affected and shock
non- affected households ............................................................................ 91
4.7.4
Household responses to shocks .......................................................... 93
4.8 Household savings ...................................................................................... 94
4.8.1
Savings and credit access ................................................................... 94
4.8.2
Motives for savings ............................................................................ 96
4.8.3
Savings and household endowments .................................................. 98
4.8.3.1 Savings and income ........................................................................ 98
4.8.3.2 Savings and other household endowments based on loan sources . 99
4.9 Ethnicity and credit access ........................................................................ 101
4.9.1
Credit recipients categorized by ethnicity group.............................. 101
4.9.2
Ethnicity and credit volumes ............................................................ 102
v
TABLE OF CONTENTS
4.9.3
Ethnicity and household endowments .............................................. 103
4.10 Summary of the chapter .......................................................................... 106
5. POVERTY OUTREACH OF RURAL CREDIT ............................................ 108
5.1 Introduction ............................................................................................... 108
5.2 The methodology for evaluating poverty outreach ................................... 108
5.2.1
Principal Component Analysis: main ideas ...................................... 108
5.2.2
Selection of variables for Principal Component Analysis ................ 110
5.2.2.1 Point-Biserial Correlation ............................................................. 111
5.2.2.2 A description of selected variables ............................................... 112
5.3 Empirical results and discussion ............................................................... 114
5.3.1
Results of Principal Component Analysis ........................................ 114
5.3.2
Poverty outreach of rural credit ........................................................ 116
5.3.2.1 Depth of outreach based on relative poverty ................................ 116
5.3.2.2 The association between poverty scores and loan amount ........... 118
5.3.2.3 Depth of outreach based on categories of credit exclusion ........... 119
5.3.3
Summary of the chapter .................................................................... 120
6. DETERMINANTS OF CREDIT ACCESSIBILITY BY RURAL
HOUSEHOLDS ................................................................................................... 121
6.1 Introduction ............................................................................................... 121
6.2 Methodology ............................................................................................. 121
6.2.1
Choice of explanatory variables ....................................................... 121
6.2.1.1 Social capital ................................................................................. 121
6.2.1.2 Human capital................................................................................ 123
6.2.1.3 Financial capital ............................................................................ 124
6.2.1.4 Physical capital .............................................................................. 125
6.2.2
Bayesian Model Average applied to the Heckman Selection Model126
6.2.2.1 Credit access model ....................................................................... 127
6.2.2.2 Credit Amount Model ................................................................... 129
6.3 Results and discussions ............................................................................. 131
6.3.1
Endowment difference between household groups .......................... 131
6.3.2
Result of Bayesian Model Averaging (BMA) .................................. 134
Số hóa bởi Trung tâm Học liệu – ĐHTN
vi
TABLE OF CONTENTS
6.3.3
Determinants of credit access ........................................................... 135
6.3.3.1 Determinants of accessing overall credit ...................................... 136
6.3.3.2 Determinants of accessing subsidized credit ................................ 140
6.3.3.3 Determinants of accessing Agribank credit .................................. 141
6.3.3.4 Determinants of accessing informal credit ................................... 144
6.4 Summary of the chapter ............................................................................ 146
7. INCOME IMPACT OF CREDIT ON RECIPIENTS ..................................... 147
7.1 Introduction ............................................................................................... 147
7.2 Impact Estimation by Using Propensity Score Matching ......................... 147
7.2.1
Reasons for choosing Propensity Score Matching ........................... 147
7.2.2
Main ideas of Propensity Score Matching ....................................... 148
7.2.3
Assumptions of Propensity Score Matching .................................... 150
7.2.4
Choice of matching algorithm .......................................................... 151
7.2.4.1 Nearest neighbor matching and radius matching .......................... 151
7.2.4.2 Kernel matching ............................................................................ 153
7.2.4.3 Stratification matching .................................................................. 153
7.2.5
Assessment of the matching quality ................................................. 154
7.2.6
Bootstrapping with Propensity Score Matching............................... 155
7.3 Estimation Results..................................................................................... 156
7.3.1
Income Impact of Credit without Using Matching Techniques ....... 156
7.3.2
Income Impact of Credit by Using Matching Techniques ............... 159
7.3.2.1 Income impact of overall rural credit............................................ 160
7.3.2.2 Income impact of subsidized credit .............................................. 162
7.3.2.3 Income impact of commercial credit by the Agribank (VBARD) 166
7.3.2.4 Income impact of informal credit ................................................. 169
7.3.2.5 Income impact per VND million of credit .................................... 171
7.4 Summary of the chapter ............................................................................ 172
8. SUMMARY OF THE STUDY: RATIONALE, MAIN FINDINGS,
CONCLUSIONs AND POLICY RECOMMENDATIONS ............................... 173
8.1 Introduction ............................................................................................... 173
8.2 Rationale of the study ............................................................................... 173
TABLE OF CONTENTS
vii
8.3 Methodological approaches ....................................................................... 174
8.4 Main findings ............................................................................................ 174
8.4.1
Household characteristics ................................................................. 174
8.4.2
Poverty outreach of credit ................................................................. 176
8.4.3
Determinants of credit access ........................................................... 176
8.4.4
Income impact of credit .................................................................... 177
8.5 Conclusions ............................................................................................... 177
8.5.1
The extent to which credit reaches the poor ..................................... 177
8.5.2
Factors influencing credit access ...................................................... 178
8.5.3
Income impact of rural credit ........................................................... 178
8.6 Policy implications .................................................................................... 179
8.6.1
Improve the extent to which credit reaches the poor ........................ 179
8.6.2 Credit schemes should be adaptable to the farming seasonality and the
cash flow of households ................................................................................ 179
8.6.3
Development of risk copping measures for the poor........................ 180
8.6.4
Encouraging the provision of commercial loans .............................. 180
8.6.5
Informal credit still retain as a necessity for the poor ...................... 181
8.6.6
Facilitating access to extension services .......................................... 181
8.6.7
Mobilization of rural savings as the important source of credit ....... 182
8.7 Limitations and suggestions for further studies ........................................ 182
ZUSAMMENFASSUNG .................................................................................... 183
REFERENCES .................................................................................................... 188
APPENDIX.......................................................................................................... 200
Số hóa bởi Trung tâm Học liệu – ĐHTN
viii
LIST OF TABLES
LIST OF TABLES
Table 2.1: Development indicators of Vietnam ...................................................... 7
Table 2.2: Production of main agricultural commodities...................................... 10
Table 2.3: Rural labors in Vietnam 2001-2011 ..................................................... 11
Table 2.4: Poverty headcount and composition by regions and sector in 2010
(Based on General Statistics Office- World Bank poverty line) ........................... 12
Table 2.5: Percentage of crops and livestock covered by agricultural insurance . 13
Table 2.6: Financial sustainability of credit institutions as of June 30th 2009 ..... 23
Table 4.1: Socio-economic indicators of the Northern Mountainous Region
(NRM) in relation to other regions and the whole country ................................... 61
Table 4.2: Commune characteristics in selected provinces (% of communes) ..... 63
Table 4.3: Loan characteristics by lenders ............................................................ 68
Table 4.4: Share of loans with collateral (% of borrowed households) ................ 69
Table 4.5: Modes of repayment by sources of loans (% of accessed households) 70
Table 4.6: Credit use purposes by sources of loans (% of households) ................ 71
Table 4.7: Demographic characteristics of households categorized by credit
sources ................................................................................................................... 73
Table 4.8: Crop production per household by provinces (kg) .............................. 75
Table 4.9: Average number of livestock reared per household ............................ 76
Table 4.10: Average number of plots per household and land size per plot ......... 77
Table 4.11: Share of land plots with red book (%) ............................................... 78
Table 4.12: Feedback of receivers to extension services (% of households with
access to agricultural extension)............................................................................ 80
Table 4.13: Feedback of households to formal extension categorized by provinces
............................................................................................................................... 81
Table 4.14: Income of household groups categorized by extension access and loan
sources (VND 1000 per household) ...................................................................... 83
Table 4.15: Description of selected household endowments ............................... 84
Table 4.16: Differences in household‘s endowments based on credit sources and
extension access..................................................................................................... 85
Table 4.17: Share of shock affected households (% of households) .................... 87
Table 4.18: Mean and standard deviation of shock losses by credit access and
provinces................................................................................................................ 88
Table 4.19: Total income of household groups categorized by shock-affected and
loan sources (VND 1000 per household) .............................................................. 90
Table 4.20: Test for the difference in means of endowments between household
groups .................................................................................................................... 92
Table 4.21: Household responses to shocks by sources of loans (% of affected
households) ............................................................................................................ 93
ix
LIST OF TABLES
Table 4.22: Household responses to shocks of households categorized by
provinces (% of affected households) ................................................................... 94
Table 4.23: Credit amount of households categorized by savings status (VND
1000 per household) .............................................................................................. 96
Table 4.24: Reasons for household savings categorized by lenders (% of
households) ............................................................................................................ 97
Table 4.25: Reasons for household savings categorized by provinces (% of
household with savings) ........................................................................................ 97
Table 4.26: Total income of household groups categorized by savings and loan
sources (VND 1000 per household) ...................................................................... 98
Table 4.27: Differences in household endowments based on credit sources and
savings ................................................................................................................. 100
Table 4.28: Differences in means of endowments between ethnic minority
households and Kinh majority households ......................................................... 104
Table 4.29: Total income of household groups categorized by ethnicity and loan
sources (VND 1000 per household) .................................................................... 105
Table 5.1: Descriptive statistics for selected variables used in PCA .................. 113
Table 5.2: Results of Principal Component Analysis.......................................... 115
Table 5.3: Poverty outreach of rural credit .......................................................... 117
Table 5.4: Correlation coefficient between relative poverty scores and loan
amount ................................................................................................................. 118
Table 5.5. Depth of outreach based on the categories of exclusion .................... 119
Table 6.1: Description and assumptions of selected explanatory variables ........ 126
Table 6.2: Difference in explanatory variables used in Bayesian credit model .. 132
Table 6.3: Probability of inclusion by Bayesian Model Averaging .................... 134
Table 6.4: Probit estimation of accessing overall credit ..................................... 136
Table 6.5: Determinants of credit volumes ......................................................... 138
Table 6.6: Probit estimation of accessing subsidized credit ................................ 140
Table 6.7: Probit estimation of accessing Agribank credit ................................. 142
Table 6.8: Determinants of Agribank loan volumes ........................................... 143
Table 6.9: Probit estimation of accessing informal credit ................................... 144
Table 6.10: Determinants of informal loan volumes ........................................... 145
Table 7.1: Comparison of income between household groups without matching
(VND 1000 per household) ................................................................................. 157
Table 7.2: Income impact of rural credit on accessed households ...................... 161
Table 7.3: Income impact of preferential credit on recipients ............................ 163
Table 7.4: Income impact of commerical credit by the Agribank....................... 167
Table 7.5: Income impact of informal credit on accessed households ................ 170
Số hóa bởi Trung tâm Học liệu – ĐHTN
x
LIST OF FIGURES
LIST OF FIGURES
Figure 1.1: Agricultural credit share in total national credit disbursed (%) ........... 2
Figure 2.1: GDP, credit and inflation growth in Vietnam (%) ............................... 8
Figure 2.2: Real GDP structure by economic sectors (%) ...................................... 9
Figure 2.3: Vietnam‘s exports by products in 2005 and 2010 .............................. 10
Figure 2.4: Labour forces and the structure of poverty in Vietnam ...................... 18
Figure 2.5: Demand for credit and other financial services of low income
population .............................................................................................................. 19
Figure 2.6: Rural credit suppliers in Vietnam ....................................................... 20
Figure 2.7. Market share of main credit suppliers (%) ......................................... 22
Figure 3.1: The triangle of credit .......................................................................... 27
Figure 3.2. Marginal returns to capital of poorer and wealthier households ........ 28
Figure 3.3: The problem of information asymmetries in rural credit market ....... 30
Figure 3.4. Credit cycle ......................................................................................... 42
Figure 3.5. Access to credit influences household income ................................... 45
Figure 3.6: Evaluation basic for welfare impact of credit ..................................... 47
Figure 3.7. The conceptual framework of the study ............................................. 58
Figure 4.1: Map of the research area and selected provinces ............................... 60
Figure 4.2: Ethnicity structure in the Northern Mountains of Vietnam ................ 62
Figure 4.3: Share of households with access to different credit sources .............. 66
Figure 4.4: The share of households with access to extension services by source of
loans (%) ................................................................................................................ 79
Figure 4.5: Loan amount by extension access ...................................................... 82
Figure 4.6: Types of shocks and number of affected households ......................... 87
Figure 4.7: Distribution of shock losses across household categories .................. 89
Figure 4.8: Share of risk losses in total income across household groups (%) ..... 91
Figure 4.9: Share of households with and without savings categorized by loan
sources (% of households) ..................................................................................... 95
Figure 4.10: Share of savings in total household income (%) ............................. 99
Figure 4.11: Poverty headcount (%) for the Kinh majority versus ethnic minorities
in Vietnam ........................................................................................................... 101
Figure 4.12: Distribution of households in terms of credit sources and ethnicity
............................................................................................................................. 102
Figure 4.13: Distribution of loan amounts categorized by ethnic groups ........... 103
Figure 7.1: Box plot for income distribution across household groups .............. 159
Figure 7.2: Income impact per VND million of credit........................................ 171
LIST OF ACRONYMS AND ABBREVIATIONS
xi
LIST OF ACRONYMS AND ABBREVIATIONS
ADB
AMK
ANOVA
ASA
ATTE
BARC
BIC
BMA
BRI
CEP
CIEM
DANIDA
DOI
FAO
FSS
GDP
GNI
GSO
ILSSA
ISPARD
KMO
MFI
MRA
NGO
NRM
OSS
PCA
PCF
PKSF
PPP
PSM
ROSCA
TYM
Asian Development Bank
Angkor Mikroheranhvatho Kampuchea
Analysis of variances
Association for Social Advancement
Average Treatment on Treated Effect
Bangladesh Rural Advancement Committee
Bayesian Information Criterion
Bayesian Model Average
Bank Rakyat Indonesia
Capital Aid Fund for Employment of the poor
Central Institute for Economic Management
Organization of the Danish International Development Assistance
Depth of outreach indicator
Food and Agricultural Organization
Financial self-sustainability
Gross Domestic Product
Gross National Income
General Statistics Office of Vietnam
Labor Science and Social Affairs
Institute for Policy and Strategy for rural development
Kaiser-Meyer-Olkin measure of sampling adequacy
Microfinance Institution
Micro-Credit Regulatory Authority
Non-governmental Organization
Northern Mountainous Region
Operational self-sustainability
Principal Component Analysis
People's Credit Fund
Palli Karma Sahayak Foundation
Purchasing Power Parity
Propensity Score Matching
Rotating Savings and Credit Association
Tao Yeu May
Số hóa bởi Trung tâm Học liệu – ĐHTN
xii
VARHS
VBARD
VBP
VBSP
VHLSS
VND
WB
LIST OF ACRONYMS AND ABBREVIATIONS
Vietnam Access Resources Household Survey
Vietnam Bank for Agriculture and Rural Development
Vietnam Bank for the poor
Vietnam Bank for Social Policy
Vietnam Household Living Standard Survey
Vietnam Dong
World Bank
1
INTRODUCTION
1. INTRODUCTION
1.1
Background of the study
Rural development is widely believed to be effective in reducing poverty where a
majority of the poor live and depend on farming activities as their main source of
income. The poor are able to play a part in creating wealth and improving their
livelihood if they begin a small business, improve farming productivity or access
employment. If the poor do not have the chance to become economically
independent, the economy is wasteful with human capital and the society then
needs to spend more in assisting the poor. Nevertheless, the main disadvantage of
the poor is that they lack of access to development resources to help in achieving
this aim. The poor, in general, have a low level of education, limited production
skills and limited access to additional resources and that is why they are poor.
Improving access of the poor to financial services has therefore long been a
question of great interest.
In the history of rural development, credit has been thought of as a key factor in
creating employment for farmers, helping them expand production and increase
welfare. To this point, a number of studies have emphasized the importance of a
broad access to appropriate and sustainable credit services in poverty reduction.
For example, GUIRKINGER (2008) argued that access to credit is an important tool
in alleviating poverty, as it helps farmers buy necessary inputs such as fertilizer,
seed varieties, pesticides, animal feed, irrigation services and to invest in
favorable crops and livestock, fostering in gains in productivity and income.
However, many people around the world have limited to access to credit. The
credit outreach to the poorest communities remains low (ZELLER & SHARMA,
2000). Nearly half of the world‘s rural poor households have no access to credit
services. In Asia and the Pacific region, more than 300 million households are
constrained to access credit by both formal and informal sources (W. WORLD
BANK, 2007). Lack of access to credit is regarded as one of the most crucial
reasons explaining why the poor rural households in developing countries remain
poor (COLLINS et al., 2009). Poor people's access to credit is therefore a topic of
interest not only for the policy makers, non-governmental organizations and
donors but also for the academic researchers.
1.2
Statement of the problem
While the aforementioned problem could hold true for developing countries in
general, they are particularly applicable to Vietnam, a developing country in the
Southeast Region of Asia. The country has determined three essential pillars for
the national sustainable development, including economic growth in association
Số hóa bởi Trung tâm Học liệu – ĐHTN
2
INTRODUCTION
with social equity, poverty reduction, and environmental protection. However,
those tasks pose a host of other challenges. Specifically, about 70% of the total
population lives in rural areas and 53.9% of total national labor force works in the
agricultural sector, which contributes nearly 22% percent of total national
domestic product (GSO, 2012). The rural areas in Vietnam are also where nearly
94% of the poor lives. Most low-income households are rural households, which
account for 44.8% total national households (GSO, 2012).
Despite the fact that agriculture and rural areas play an important role in national
development, their share of annual investment only represents nearly 7% of total
annual national investment. Although the Vietnamese government always pays
more attention to poverty reduction through a number of credit schemes, the share
of national credit allocated to the agricultural sector decreased remarkably during
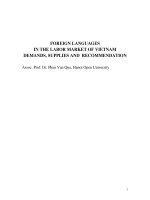
the period 2002-2012, as shown in Figure 1.1. Furthermore, average annual credit
growth for the agriculture sector in this period was 22%, which was lower than
25% for the whole economy (GENERAL STATISTICS OFFICE OF VIETNAM, 2012).
30%
18%
Average 2002-2008
2009
20%
2012
Figure 1.1: Agricultural credit share in total national credit disbursed (%)
Source: GENERAL STATISTICS OFFICE OF VIETNAM (2012)
In addition, MARSH et al. (2006) showed that although a number of policies have
been implemented to improve access to credit, market failure in the rural credit
markets have led to severe credit restrictions by small household farms, and the
rural sector in general in Vietnam.
The W. WORLD BANK (2012) indicated that sustainable growth of the country
cannot be achieved without investing in all people across every region and
national community. This is particularly the case for Vietnam, where the
development of the Northern Mountainous Region has been seen as a necessity
3
INTRODUCTION
for national socio-economic development as well as national security. Although
the region represents 28.79% of the total area and 12.83% of the total population,
it is still the most disadvantaged region (GENERAL STATISTICS OFFICE OF
VIETNAM, 2012). This is also the place, where most of ethnic minorities in the
country live and draw their primary income from agriculture. The poverty rate in
the region is 114.41% higher than the average rate of the whole country, and
households in this area also have fewer opportunities to access credit schemes.
According to the national statistics, only 9.86% of the national loan outstanding is
allocated to the Northern Mountainous Region, compared to 49% of the Southeast
Region and the Mekong River Delta (GENERAL STATISTICS OFFICE OF VIETNAM,
2012). Although Vietnam can look back at an impressive record in reducing
poverty during the last two decades, disparities are still emerging. Poverty
intensity is still substantially higher in in the Northern Mountains.
The amount of literature recognizing the importance of rural credit in Vietnam has
grown significantly in recent years. For instance, CUONG (2008) and QUACH
(2005) replied to the Vietnam Household Living Standard Survey (VHLSS) to
evaluate the impact of credit on poverty reduction at the national level. However,
it is hypothesized that the success of credit schemes is highly dependent on
specific regional contexts. Although several studies of rural credit have been
conducted in the Northern Vietnam, such as T. DUFHUES and BUCHENRIEDER
(2005), SAINT-MACARY and ZELLER (2012), their conclusions are based on a
rather small sample size drawn at some communes of one or two districts. Further
confirmation of the results by a larger and more representative study is therefore
desirable.
A key motivation for this study is that very little is actually known as to whether
or not rural credit, especially subsidized credit, is an effective tool in fighting
poverty or other policy options applied to disadvantaged rural areas. Appropriate
development of rural credit based on well-informed policies is a key prerequisite
for success in reducing poverty.
1.3
Objectives
Keeping in mind the importance and related issues of rural credit to sustainable
rural development as well as the existing literature gap, this study aims to achieve
three main objectives:
(1) To evaluate the extent to which rural credit serves poor households;
(2) To investigate determinants of credit accessibility by rural households;
(3) To estimate and assess the income impact of both formal and informal
credit on credit recipients.
Số hóa bởi Trung tâm Học liệu – ĐHTN
4
1.4
INTRODUCTION
Hypotheses of the study
This study is based on following hypotheses:
Hypothesis 1: Credit targets the poor households as part of its contribution to
national rural development and poverty reduction.
Hypothesis 2: Rural households, especially poor ones, continue to experience
constrained access to credit.
Hypothesis 3: There seem to be various reasons explaining the poverty reduction
in Vietnam in the last two decades. One of these argues that the decrease in
poverty may be due to the provision of credit to rural households, especially the
government policy targeting credit at reduced rates to the most vulnerable groups
of society.
1.5
Scope and limitations of the study
Credit issues can also be influenced at the macro and intermediator levels through
policies of government or characteristics of lenders. However, the unit of analysis
in this study is limited to the rural household level. This study is also limited to
the Northern Mountainous Region of Vietnam.
The classification of formal credit into preferential and commercial credit is very
relative. One formal credit source might be considered to be preferential in this
region but could be non-preferential in others, depending on specific contexts. In
addition, formal credit policies could also be changed over time. The idea behind
the category is to differentiate issues related to the nature of credit and relevant
targeted households.
This study is also limited to cross-sectional data of rural households; therefore,
poverty outreach, credit accessibility, and over-the-year impact of credit is not
analyzed in this study.
1.6
Contribution of the study
This study contributes to the existing literatures in the field through various
points. Few previous studies have investigated rural credit in any comprehensive
way, with regard to poverty targeting, access constraints, and impact. Those
components are widely assumed to be represented in an overall credit picture.
Poverty targeting is an important component in the rural credit system and is
fundamental to understanding the extent to which credit serves the poor. If
households having a high demand for credit are bypassed, it is difficult for them
to improve their income and reduce poverty. Exploring the determinants of credit
5
INTRODUCTION
access plays a vital role in designing credit schemes. On top of that, poverty
reduction is considered a key factor in in the sustainable development of rural
credit.
Additionally, this study focuses on a rural disadvantaged region in Vietnam. The
success of credit depends on specific conditions under which recipients benefit
from accessing credit. Few studies exist, which differentiate between credit issues
regarding both formal and informal credit sectors. Each particular type of loan
might have different targeting policies, loan characteristics as well as the policy of
loan recovery, and so on. These discrepancies are significant in examining issues
of each loan source.
This study uses the Bayesian Model Average to address the problem of model
uncertainty, which has received scant attention in the current research literature.
All matching algorithms and bootstrapping applied to the PSM model are key
instruments in increasing the reliability of estimation results.
1.7
Structure of the study
This study is organized as follows: In chapter 2, a review of Vietnam‘s economy,
its agricultural sector and credit system are described. Chapter 3 presents the
theoretical and empirical framework with discussion of credit-related issues
including the poverty outreach, credit access, and impact. In chapter 4, the
characteristics of the research area and selected households‘ characteristics in
relation to credit issues are described. Chapter 5 contains the analysis of poverty
targeting by both formal and informal credit sources. Chapter 6 deals with the
problems of credit access using Bayesian Model Average applied to the Heckman
Selection Model. It focuses on household‘s participation in both formal and
informal credit and investigates access determinants to both sources. Chapter 7
presents the empirical estimation of the impact of credit on household income
using all matching algorithms of Propensity Score Matching approach. Chapter 8
reviews the results of the preceding analyses and discusses their limitations. It
then considers their relevance of findings for policy makers toward credit services
for rural households in Northern Vietnam and other developing countries. This
chapter also suggests directions for future research to further explore the function
of rural credit and related issues.
Số hóa bởi Trung tâm Học liệu – ĐHTN
6 AN OVERVIEW OF ECONOMY, POVERTY AND RURAL CREDIT SYSTEM IN VIETNAM
2. AN OVERVIEW OF ECONOMY, POVERTY AND
RURAL CREDIT SYSTEM IN VIETNAM
2.1
Geography
Vietnam is located on the Eastern margin of the Indochinese Peninsula and has a
total natural area of 331,210 square kilometers, ranking 65th in the world.
Vietnam covers the length of the Indochinese peninsula, bordering the sea in the
East, Laos and China in the North, and Cambodia in the West. The geographic
position of Vietnam is within a major transport connection between the Indian
Ocean and Pacific Ocean.
The country is divided into 6 main geographical regions, including the Red River
Delta, the Northern Mountainous Region, the North Central and Central Coastal
Areas, the Central Highlands, the South East and the Mekong River Delta. There
are two major cities in Vietnam, namely Ho Chi Minh City in the South. In 2013,
the total population of Vietnam was around 89.7 million, of which about 67.44%
remained rural residents. The country has total 64 cities under provinces, 49 urban
districts, 47 towns, 548 rural districts, and 9001 communes (GSO, 2013).
2.2
Macroeconomic performance
2.2.1 Key development indicators
Before the year 1986, Vietnam applied the command economy model, in which
the central government decided production, domestic trade, and international
trade. There were no commercial transactions among individual production units
like households or enterprises horizontally. With regard to the agricultural sector,
production solidarity groups and cooperatives were common models with which
land and equipment were shared, and a system of work points determined
distribution of income. Under this economic model, a lack of household
incentives limited the expansion of production and improvement of productivity.
In 1986, Vietnam introduced the economic reform widely known as ―Doi Moi,‖
which has facilitated the transition from a centralized and command economy to a
―socialist-oriented market economy‖. Accordingly, ineffective agricultural
collectives were removed and households have since been encouraged to be ―
autonomy production units‖, which are able to sell their goods in the marketplace.
The success of the reform process has encouraged economic growth, increased
income per capita, and improved life expectancy (see Table 2.1 for further
details).
7
AN OVERVIEW OF ECONOMY, POVERTY AND RURAL CREDIT SYSTEM IN VIETNAM
Table 2.1: Development indicators of Vietnam
Indicators
2004
2006
2008
2010
2012
2013
GNI per capita, PPP
(current international $)
2780
3310
3810
4230
4780
5030
Population (million)
81.43
83.31
85.12
86.93
88.77
89.71
GDP (current billion
US$)
49.42
66.37
99.13
115.93
155.82
171.39
GDP growth (annual %)
7.54
6.98
5.66
6.42
5.25
5.42
Life expectancy at birth,
total (years)
74.47
74.77
75.04
75.31
75.61
..
Source: GSO (2013)
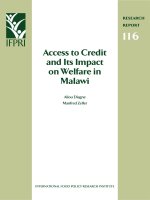
2.2.2 GDP, credit and inflation in Vietnam
Macroeconomy of Vietnam was quite stable from about the year 2001 to 2006.
The GDP growth reached an average of 7.5%, and the inflation rate was under
10% (see Figure 2.1 for further details). Vietnam joined the World Trade
Organization in 2007 and has attracted a huge amount of foreign investment.
Credit growth in the economy increased remarkably from 25.3% in 2006 to 54.0%
in 2007. From 2007 on, the economy faced instability with the rising inflation
rates and higher interest rates. When the global financial crisis hit in 2008,
Vietnam‘s economy also faced high inflation rising unemployment, slowing
growth. In the agricultural sector, high volatility of prices of agricultural
commodities also caused difficulty in rural financial markets. In response to the
financial crisis, the government introduced a tight fiscal policy including a
reduction in public expenses to reduce the budget deficit. As a result, credit
growth declined significantly. The reduced credit availability of the whole
economy was caused by the collapse of the real estate market in 2012 (GSO,
2013). Many real estate projects could not be sold, leading to defaults on real
estate loans and a higher rate of bad debts, which in turn reduced lending
opportunities in the banking system.
Số hóa bởi Trung tâm Học liệu – ĐHTN
8 AN OVERVIEW OF ECONOMY, POVERTY AND RURAL CREDIT SYSTEM IN VIETNAM
25
60
50
20
40
15
30
10
20
5
10
0
0
GDP growth
Inflation
Credit growth
Figure 2.1: GDP, credit and inflation growth in Vietnam (%)
Source: GENERAL STATISTICS OFFICE OF VIETNAM (2012)
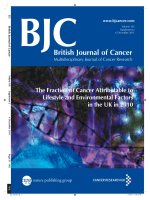
2.2.3 Economy’s structure share in Vietnam
Since the shift from a central planned economy to a market based economy,
Vietnam has implemented industrialization, modernization and world integration
policies. The economy has been heading for open market free trading and
attracting foreign investment. The industrial, construction, and service sectors
significantly contributed to the total GDP (see Figure 2.2 for further details). The
top manufacturing sectors include food processing, cigarettes and tobacco,
textiles, chemicals and electrical goods. In 2010, services accounted for 38% of
GDP. Vietnam is regarded as one of the top 25 most attractive destinations for
tourism in Asia. The most popular cities for tourism include Ha Noi, Ho Chi Minh
city, Hoi An and Ha Long.
The agricultural sector, however, remained an important sector in the national
economy. Total value of agricultural, forestry and fishery products was about
USD 14.5 billion, accounting for 20.23% of GDP in 2010, a 3 % decline as
compared to the year 2000. Most of the population and the poor live in rural areas
and derive their income predominantly from farming activities. However, the
higher proportion of agricultural employment when compared to the contribution
of the agricultural sector to the GDP reflects a low rate of productivity in this
sector. The savings and loan portfolios of rural financial institutions can therefore
be affected by agriculture even if clients earn income in other sectors.
AN OVERVIEW OF ECONOMY, POVERTY AND RURAL CREDIT SYSTEM IN VIETNAM
24%
41%
35%
Agriculture, forestry and
fishery
Services
Industry and construction
9
21%
38%
41%
2000
2010
24%
21%
41%
35%
38%
41%
Figure 2.2: Real GDP structure by economic sectors (%)
Source: GENERAL STATISTICS OFFICE OF VIETNAM (2011)
2.3
Agriculture and Poverty
2.3.1 Agricultural performance
In spite of considerable efforts in industrialization, Vietnam‘s economy is still
dominated by agricultural production, where economic reforms have so far had
most success. The agricultural sector saw remarkable performance during the tenyear period of 2001-2011. The agricultural sector including crops, livestock,
forestry, aquaculture and fisheries represented 20% of GDP, 30% of export
revenue and 60% of employment. Key policies for the agricultural sector
introduced in 1986 are the allocation of land to individual households and the
encouragement of market incentives for agricultural commodities. These policies
have contributed to the development potential of the agricultural sector and rural
areas in Vietnam. Agricultural growth reached an average of 4% per year. The
agricultural sector produced 558.4 trillions VND, accounting for 22% of total
GDP, contributing 0.66 percentage points in 5.89% of GDP growth in 2011. As
shown in Table 2.2, total production of the main agricultural products in 2011
increased in comparison to the year 2001 (GENERAL STATISTICS OFFICE OF
VIETNAM, 2011).
Số hóa bởi Trung tâm Học liệu – ĐHTN
10 AN OVERVIEW OF ECONOMY, POVERTY AND RURAL CREDIT SYSTEM IN VIETNAM
Table 2.2: Production of main agricultural commodities
Rice (million tons)
42,3
Compared to
year 2001
(%)
+ 31,8
Pork meat (million tons)
3,1
+ 103
4,7
+ 95,8
5.43
+ 122,5
Production
in 2011
Agricultural commodities
Wood and wooden products
(million cubic meters)
Fishery products (million tons)
Source: GSO (2011)
Figure 2.3 presents the most important goods for exportation in Vietnam (ranked
by value) for the year 2005 and 2010. Exports represented for about 70% of total
GDP of Vietnam in 2010. Vietnam‘s main industrial exportation goods included
textiles, sewing products, crude oil, footwear, electronic goods and parts, wood
and wooden parts, and coal. In 2010, the export value of agricultural products was
USD 15.65 billion, accounting for 21.7% of the total export value of Vietnam, of
which the agricultural and forestry product was USD 11.4 billion and fishery
product was USD 4.25 billion. The main export products were rice (USD 3.2
billion), coffee (USD 1.9 billion), rubber (USD 2.4 billion), timber products (USD
3.4 billion) and fishery products (USD 2.7 billion). The value of export for each
particular good increased significantly from 2005 to 2010.
Textile, sewing products
Crude oil
Footwear
Fishery products
Electronic goods and parts
Wood and wooden products
Rice
Rubber
Coffee
Coal
11.2
4.8
5
5.1
3
7.4
5
2.7
3.6
1.4
1.6 3.4
1.4
2010
3.2
2005
0.8 2.4
0.7 1.9
0.71.6
0
5
10
USD billions
Figure 2.3: Vietnam’s exports by products in 2005 and 2010
Source: GENERAL STATISTICS OFFICE OF VIETNAM (2011)
15