JM02002 spectrum analysis
Bạn đang xem bản rút gọn của tài liệu. Xem và tải ngay bản đầy đủ của tài liệu tại đây (893.37 KB, 31 trang )
Spectrum Analysis
The Key Features of Analyzing Spectra
Summary
This guide introduces machinery maintenance workers to
condition monitoring analysis methods used to detect and
analyze machine component failures. It informs the reader about
common analysis methods. It intends to lay the foundation for
understanding machinery analysis concepts, and show the reader
what is needed to perform an actual analysis on specific
machinery.
Jason Mais
31 pages
May 2002
SKF Reliability Systems
@ptitudeXchange
4141 Ruffin Road
San Diego, CA 92123
United States
tel. +1 858 244 2540
fax +1 858 244 2555
email:
Internet: www.aptitudexchange.com
Use of this document is governed by the terms
and conditions contained in @ptitudeXchange.
Spectrum Analysis
Introduction......................................................................................................................................5
Common Steps in a Vibration Monitoring Program........................................................................6
Step 1: Collect Useful Information ..................................................................................................6
Identify Components of the Machine that Could Cause Vibration ..........................................6
Identify the Running Speed ......................................................................................................6
Other Key Considerations.........................................................................................................7
Identify the Type of Measurement that Produced the FFT Spectrum ......................................7
Step 2: Analyze Spectrum................................................................................................................7
Common Components of Vibration Spectrums........................................................................7
Identify and Verify Suspected Fault Frequencies.....................................................................8
Determine Fault Severity..........................................................................................................8
Misalignment ...................................................................................................................................9
Angular Misalignment ..............................................................................................................9
Parallel Misalignment...............................................................................................................9
Causes .......................................................................................................................................9
Effects .......................................................................................................................................9
Diagnoses................................................................................................................................10
Phase Analysis ........................................................................................................................11
Bearing Cocked on a Shaft .....................................................................................................12
Summary.................................................................................................................................12
Unbalance ......................................................................................................................................12
Static Unbalance .....................................................................................................................12
Couple Unbalance...................................................................................................................13
Dynamic Unbalance................................................................................................................13
Cause.......................................................................................................................................13
Effects .....................................................................................................................................13
Diagnoses................................................................................................................................14
© 2003 SKF Reliability Systems All Rights Reserved
2
Spectrum Analysis
FFT Spectrum Analysis ..........................................................................................................14
Phase Analysis ........................................................................................................................14
Summary.................................................................................................................................14
Mechanical Looseness ...................................................................................................................15
Causes .....................................................................................................................................15
Effects .....................................................................................................................................15
Diagnosis ................................................................................................................................15
Spectrum Analysis ..................................................................................................................16
Summary.................................................................................................................................16
Bent Shaft.......................................................................................................................................16
Causes .....................................................................................................................................16
Effects .....................................................................................................................................17
Diagnosis ................................................................................................................................17
Spectrum Analysis ..................................................................................................................17
Phase Analysis ........................................................................................................................17
Summary.................................................................................................................................17
Rolling Element Bearing Defects ..................................................................................................17
Bearing Defects ......................................................................................................................17
Velocity Measurements ..........................................................................................................18
Vibration - Spectral Analysis..................................................................................................19
Acceleration Enveloping Spectral Analysis ...........................................................................21
Summary.................................................................................................................................24
Gears ..............................................................................................................................................24
Gear Mesh Frequency.............................................................................................................24
Gear Mesh Frequency Sidebands ...........................................................................................25
Blades and Vanes...........................................................................................................................27
Electrical Problems ........................................................................................................................28
© 2003 SKF Reliability Systems All Rights Reserved
3
Spectrum Analysis
2x Line Frequency ..................................................................................................................28
Stator Problems.......................................................................................................................29
Rotor Problems .......................................................................................................................29
Step 3: Multi-Parameter Monitoring..............................................................................................30
Conclusions....................................................................................................................................30
Further Reading .............................................................................................................................30
© 2003 SKF Reliability Systems All Rights Reserved
4
Spectrum Analysis
Introduction
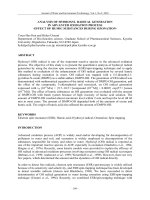
A vibration FFT (Fast Fourier Transform)
spectrum is an incredibly useful tool for
machinery vibration analysis. If a machinery
problem exists, FFT spectra provide
information to help determine the source and
cause of the problem and, with trending, how
long until the problem becomes critical.
FFT spectra allow us to analyze vibration
amplitudes at various component frequencies
on the FFT spectrum. In this way, we can
identify and track vibration occurring at
specific frequencies. Since we know that
particular machinery problems generate
vibration at specific frequencies, we can use
this information to diagnose the cause of
excessive vibration.
The key focus of this article hinges on the
proper techniques regarding data collection
and common types of problems diagnosable
with vibration analysis techniques. This article
can be used as a reference source when
diagnosing vibration signatures.
Figure 1. Example of a velocity spectrum that contains running speed (at F = 2700 RPM or 45 Hz), harmonics of
running speed (at F=4500 RPM or 75 Hz), and bearing defect frequencies (at F = ~31,000 RPM (516 Hz) and
~39,000 RPM (650Hz) marked with bearing overlay markers).
© 2003 SKF Reliability Systems All Rights Reserved
5
Spectrum Analysis
Common Steps in a Vibration
Monitoring Program
There are several steps to follow as
guidelines to help achieve a successful
vibration monitoring program. The
following is a general list of these steps:
1. Collect Useful Information - Look,
listen, and feel the machinery to check
for resonance. Identify what
measurements are needed (point and
point type). Conduct additional testing if
further data is required.
2. Analyze Spectral Data – Evaluate the
overall values and specific frequencies
corresponding to machinery anomalies.
Compare overall values in different
directions and current measurements
with historical data.
3. Multi-Parameter Monitoring - Use
additional techniques to conclude the
fault type. (Analysis tools such as phase
measurements, current analysis,
acceleration enveloping, oil analysis and
thermography can be used.)
4. Perform Root Cause Analysis (RCA) in order to identify the real causes of the
problem and to prevent it from occurring
again.
5. Reporting and planning actions – Use
a Computer Maintenance Management
System (CMMS) to rectify problem and
take action to achieve plan.
In this article, only steps 1 through 3 are
investigated. The reader is referred to other
@ptitudeXchange articles on RCA and
CMMS to explain these additional
monitoring technologies.
Step 1: Collect Useful
Information
order to conduct an analysis. The
identification of components, running speed,
operating environment and types of
measurements should be determined initially
to assess the overall system.
Identify Components of the Machine
that Could Cause Vibration
Before a spectrum can be analyzed, the
components that cause vibration within the
machine must be identified.
For example, you should be familiar with
these key components:
•
If the machine is connected to a fan or
pump, it is important to know the
number of fan blades or impellers.
•
If bearings are present, know the bearing
identification number or its designation.
•
If the machine contains, or is coupled, to
a gearbox, know the number of teeth and
shaft speeds.
•
If the machine is driven with belts, know
the belt lengths.
The above information helps assess
spectrum components and helps identify the
vibration source. Determining the running
speed is the initial task. There are several
methods to help identify this parameter.
Identify the Running Speed
Knowing the machine’s running speed is
critical when analyzing an FFT spectrum.
Running speed is related to most
components within the machine and
therefore, aids in assessing overall machine
health. There are several ways to determine
running speed:
•
When conducting a vibration program,
certain preliminary information is needed in
© 2003 SKF Reliability Systems All Rights Reserved
Read the speed from instrumentation at
the machine or from instrumentation in
the control room monitoring the
machine.
6
Spectrum Analysis
•
•
Look for peaks in the spectrum at 1800
or 3600 RPM (1500 and 3000 RPM for
50 Hz countries) if the machine is an
induction electric motor, as electric
motors usually run at these speeds. If the
machine is variable speed, look for
peaks in the spectrum that are close to
the running speed of the machine during
the time at which the data is captured.
determine which type of measurement
displays the required.
•
Was the measurement displacement,
velocity, acceleration, acceleration
enveloping, etc.? Depending upon the
information needed, a particular
measurement should be tailored to
capture the proper results.
An FFT’s running speed peak is
“typically” the first significant peak in
the spectrum when reading the spectrum
from left to right. Look for this peak and
check for peaks at two times, three
times, four times, etc. Multiples of the
running speed frequency can be an
indication of machine health.
•
How was the sensor positioned:
horizontal, vertical, axial, in the load
zone, etc.? Sensor response varies
depending upon mounting orientation.
•
Are previously recorded values, FFTs, or
overall trend plots available? History
can help determine a machine’s normal
vibration level, or how quickly a
machine is degrading.
Other Key Considerations
There are many other considerations to take
into account when analyzing a machine. For
example:
•
•
•
If the machine operates in the same
vicinity as another machine, it is
important to know the running speed of
the adjacent machine. Occasionally,
vibration from one machine can travel
through the foundation or structure and
affect vibration levels on an adjacent
machine.
Know if the machine is mounted
horizontally or vertically. Mounting
orientation affects machine response to
vibration.
Know if the machine is overhung, or
connected to anything that is overhung.
Machine support can affect the response
of the vibration sensor.
Identify the Type of Measurement
that Produced the FFT Spectrum
Step 2: Analyze Spectrum
Once machine vibration identification and
collection is completed, the process of
analyzing the spectrum can be conducted.
Analysis usually follows a process of
elimination: eliminate the components or
issues that do not contribute to the system.
From the remaining components, identify
what is the contributing factor affecting the
machine health.
Common Components of Vibration
Spectrums
The most common components of a
vibration spectrum should be analyzed
initially to determine whether or not the
spectrum indicates a possible problem.
•
Compare overall measurement values to
prior measurements to determine if a
significant increase has occurred.
•
Evaluate the alarm status of a
measurement point. If overall alarms are
set properly, this can help indicate when
a measurement needs further evaluation.
Vibration monitoring programs use many
types of measurements to determine the
condition of machinery. It is important to
© 2003 SKF Reliability Systems All Rights Reserved
7
Spectrum Analysis
•
Identify the type of measurement that
indicates a problem. For example,
enveloped signals can indicate bearing
damage or gear tooth damage. While
velocity measurements relate more to
overall machine health.
Once an assessment of the measurement is
conducted, specific frequencies should be
identified.
Identify and Verify Suspected Fault
Frequencies
Spectra may produce peaks at identified
fault frequencies. These peaks may or may
not represent the indicated fault. By looking
for harmonics of the fault frequency,
additional information can be assessed as to
whether the generated frequencies are an
indication of the fault. For example:
•
If a peak appears at the fundamental
fault frequency and another peak appears
at two times (2x) the fundamental fault
frequency, it is a very strong indication
that the fault is real.
•
If no peak appears at the fundamental
fault frequency but peaks are present at
two, three, and maybe four times the
fundamental fault frequency, there is a
strong indication the fault is valid.
•
Identifying any harmonics of running
speed (2x, 3x, etc.) helps determine if a
fault is present.
•
Identifying any bearing fault frequencies
helps determine if a fault is present.
•
Identifying fan or vane pass frequencies,
if applicable, helps determine if a fault is
present.
•
Identifying the number of gear teeth and
the shaft on which the gear is mounted,
if applicable, helps determine if a fault is
present. Moreover, this helps determine
if there is a problem with a particular
gear.
•
Identifying pump impeller frequencies,
if applicable, helps determine if a fault is
present.
•
As mentioned in the prior section,
identifying adjacent machinery
vibration, if applicable, helps determine
if a fault is present.
Once the vibration source is determined, the
level of severity must be assessed to
evaluate whether corrective action should be
taken.
Determine Fault Severity
Great importance should be placed upon
determining the severity of a particular fault.
Some components of a machine may vibrate
at very high levels and still be operating
within acceptable limits. Other components
may be vibrating at very low levels and be
outside acceptable limits. Thus, amplitude is
relative so the entire system should be
evaluated, not just the amplitude.
•
Compare the amplitude with past
readings taken while operating under the
same consistent conditions to determine
the severity.
•
Compare the amplitude of a particular
reading with the same type of reading
from a similar machine. A higher than
normal reading on one of the machines
may indicate a problem in that particular
machine.
•
Obtain prior history on the machine to
help identify the various levels at which
the machine has operated and aids in
assessing machine health at its current
state.
•
Determine whether or not a baseline
measurement (a measurement taken
upon installation of a new or
© 2003 SKF Reliability Systems All Rights Reserved
8
Spectrum Analysis
reconditioned machine) was taken. If so,
compare the new reading to the baseline
reading to help indicate the severity of
vibration.
Once the information is collected and
components are identified, you can begin to
use the colleted spectra to diagnose
machinery problems. The following sections
help evaluate common machinery problems
and identify their associated causes and
effects. In addition, examples of resulting
spectra are included to use as templates
when identifying these common issues.
Issues such as misalignment, unbalance,
looseness, bent shafts, and bearing defects
are discussed.
Figure 3. Parallel Misalignment.
Causes
Common causes of misalignment are:
•
Thermal Expansion: Expansion or
growth of a component due to the
heating and cooling of that component.
•
Cold Alignment: Most machines are
aligned cold and heat as they operate.
Thermal growth causes them to grow
misaligned.
•
Alignment of components during
coupling is not correctly achieved.
Therefore, misalignment is introduced
into the system during installation.
•
Improper alignment due to imparted
forces from piping and support
members.
•
Misalignment due to uneven foundation,
shifting in foundation, or settling.
Misalignment
Misalignment is created when shafts,
couplings, and bearings are not properly
aligned along their centerlines. The two
types of misalignment are angular and
parallel, or a combination of both.
Angular Misalignment
Angular misalignment occurs when two
shafts are joined at a coupling in a manner
that induces a bending force on the shaft
(Figure 2).
Figure 2. Angular Misalignment.
Parallel Misalignment
Parallel misalignment occurs when the shaft
centerlines are parallel but displaced or
offset (Figure 3).
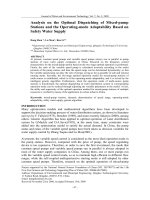
Effects
Misalignment usually causes the bearing to
carry a higher load than its design
specification, which may cause bearing
failure due to early fatigue. Fatigue is the
result of stresses applied immediately below
the load carrying surfaces and is observed as
spalling of surface metal. Effects on
coupling in the form of damage to the
coupling or excessive heat due to friction
can also be seen. Figure 4 indicates
misalignment in the system.
© 2003 SKF Reliability Systems All Rights Reserved
9
Spectrum Analysis
Misalignment
Figure 4. High 2x running speed peak at 3600 RPM or 60 Hz (running speed is 1800 RPM or 30Hz) is an indication
of misalignment. The first peak is most likely a belt frequency due to a worn or loose drive belt. The second peak is
the running speed of the machine (1800 RPM). NOTE: 2X amplitude is not always present.
Diagnoses
The most effective analysis techniques
commonly use overall vibration values and a
phase measurement that helps distinguish
between various types of misalignment or
unbalance.
A common practice when analyzing
misalignment is to look at the ratio between
1x (unbalance) and 2x (misalignment), and
compare the values. When analyzing an FTT
spectrum where misalignment is indicated, a
higher than normal 1x amplitude divided by
2x amplitude may occur. The indication of
amplitude can vary from 30% of the 1x
amplitude to 100% - 200% of the 1x
amplitude. An example of this is seen in
Figure 5. The 2x amplitude (0.90 mm/sec) is
almost twice that of 1x (0.45 mm/sec).
© 2003 SKF Reliability Systems All Rights Reserved
10
Spectrum Analysis
Very Slight Misalignm
Figure 5. FFT Spectrum showing severe misalignment (the second peak in the spectrum at ~8500 RPM (141 Hz)
indicates severe misalignment, as it is almost twice the amplitude of the running speed. The peak marked with the
marker is running speed (4237.5 RPM (71Hz)).
With concern to coupling, some general
rules are applied:
•
Couplings with 2x amplitudes below
50% of 1x are usually acceptable and
often operate for a long period of time.
•
When the vibration amplitude at 2x is
50% - 150% of 1x, it is probable that
coupling damage will occur.
•
A machine exhibiting vibration at 2x
running speed that is greater than 150%
of the 1x indicates severe misalignment.
The machine should be scheduled for
repair as soon as possible.
As mentioned earlier in this section, phase
readings are another factor that help
determine the precise problem.
Phase Analysis
Phase measurements are a very useful tool
for diagnosing misalignment. If possible,
measure the phase shift between axial
readings on opposite ends of the machine.
NOTE: All phase values are ± 30° because
of mechanical variance.
Angular Misalignment: In the axial
position, a phase shift of 180° exists across
the coupling or machine.
Parallel Misalignment: In the radial
direction, a phase shift of 180° exists across
the coupling or machine. A 0° or 180° phase
© 2003 SKF Reliability Systems All Rights Reserved
11
Spectrum Analysis
shift occurs as the sensor is moved from the
horizontal to the vertical position on the
same bearing.
•
If the radial 2x amplitude is abnormally
high, and the system contains a coupling
or belt, there may be misalignment.
Combination Angular and Parallel
Misalignment: In the radial and axial
positions, a phase shift of 180° exists across
the coupling or machine.
•
If the axial 1x amplitude is abnormally
high, and the system contains a coupling
or belt, there may be misalignment.
NOTE: With severe misalignment, the
spectrum may contain multiple harmonics
from 2x to 10x of running speed. If vibration
amplitude in the horizontal plane is
increased 2 or 3 times, misalignment is
indicated again.
Another common indication of poor
machine health is unbalance in the system.
Unbalance can cause excessive forces that
affect the machine.
Bearing Cocked on a Shaft
Like misalignment, a cocked (aligned
improperly in the housing) bearing usually
generates considerable axial vibration.
However, phase measurements from the
axial position help differentiate the two.
Figure 6. Four Sensor Locations.
If the phase readings among the four sensor
locations in Figure 6 (12 o’clock, 3 o’clock,
6 o’clock, and 9 o’clock) vary considerably,
a cocked bearing is indicated.
Summary
•
If there is abnormally high 2x amplitude
divided by 1x amplitude, and the system
contains a coupling or belt, there may be
misalignment.
Unbalance
Unbalance occurs when the shaft’s mass
centerline does not coincide with its
geometric centerline. In general, there are
three types of unbalance:
•
Static unbalance
•
Couple unbalance
•
Dynamic unbalance
Figure 7. Point U is the unbalance weight a distance
r from the center of the rotor or disk. This type of
situation in a machine is considered unbalance.
Static Unbalance
With static unbalance only one force is
involved. For example, if you have a bicycle
tire that has mud buildup on one area or
portion of the tire, when stopped the wheel
naturally settles with the clump of mud at
the bottom of the wheel. Similarly, a rotor
turns until the heavy spot is located at 6
o’clock (Figure 8). The term “static” implies
that this type of unbalance can be observed
at rest.
© 2003 SKF Reliability Systems All Rights Reserved
12
Spectrum Analysis
unbalance can occur, couple unbalance is
usually more prominent in the system.
When balancing a machine, always balance
out static unbalance first, then couple
unbalance. When balancing couple
unbalance, it is important to note that
balancing must occur within several planes.
Figure 8. Static Unbalance.
Cause
Couple Unbalance
Unbalance can be caused by a number of
factors. Several examples include:
Unlike static unbalance, couple unbalance
cannot be measured at rest. With couple
unbalance, two equal forces (weights) are
180° from each other, which causes the rotor
to appear balanced at rest (diagram shown
above). However, when the rotor rotates,
these forces move the rotor in opposite
directions at their respective ends of the
shaft. This causes the rotor to wobble, which
produces a 180° out-of-phase reading from
opposite ends of the shaft.
•
Improper component manufacturing
•
Uneven build up of debris on the rotors,
vanes, or blades
•
The addition of shaft fittings without an
appropriate counter balancing procedure
•
Vane / blade erosion or thrown balance
weights
Key characteristics of vibration caused by
unbalance:
•
It is a single frequency vibration whose
amplitude is the same in all-radial
directions.
•
It is sinusoidal, occurring at a frequency
of once per revolution (1x).
•
The spectrum generally does not contain
harmonics of 1x running speed, unless
the unbalance is severe.
Figure 9. Couple Unbalance.
•
Amplitude increases with speed.
Dynamic Unbalance
Effects
In reality, most unbalance is dynamic.
Dynamic unbalance is the combination of
static and couple unbalance. On simple
machines, there is usually more static
unbalance than couple unbalance. On more
complex machinery, with more than one
coupling or several areas on the rotor where
Just like misalignment, unbalance usually
causes bearings to carry a higher dynamic
load than their design specifications, which
causes bearing to fail from early fatigue.
Fatigue, in a bearing, is the result of stresses
applied immediately below the load carrying
surfaces and is observed as spalling away of
surface metal.
© 2003 SKF Reliability Systems All Rights Reserved
13
Spectrum Analysis
Diagnoses
The use of overall vibration, FFT spectra,
and phase measurements aids in diagnosing
unbalance problems.
FFT Spectrum Analysis
Vibration caused by pure unbalance is a
once per revolution sinusoidal waveform.
On an FFT spectrum, this appears as a
higher than normal 1x amplitude. While
other faults can produce high 1x amplitude
they usually also produce harmonics. In
general, if the signal has harmonics above
once per revolution, the fault is not
unbalance. However, harmonics can occur
as unbalance increases, or when horizontal
and vertical support stiffness differs by a
large amount.
shift across the machine or coupling in the
same measurement position.
Summary
Some general guidelines for phase
relationships follow:
•
If the radial measurement’s 1x amplitude
is high and harmonics (except vane
passing) are less than 15% of the 1x,
there may be unbalance.
•
If the majority of vibration is in the
radial plane, the 1x amplitude is medium
to high in amplitude, and the phase from
the vertical and horizontal measurements
differs by 90°, there may be unbalance.
•
If the primary vibration plane is both
axial and radial, the machine has an
overhung mass, and the axial phase
measurements across the machine are in
phase, there may be unbalance.
Phase Analysis
The use of phase measurements aids in the
diagnosis of unbalance problems.
NOTE: All phase readings are ± 30° due to
mechanical variance.
The sensor show a 90° phase shift between
the horizontal and vertical positions when
readings are compared.
When the system involves predominantly
static unbalance, there is usually no phase
The spectrum on the following page, Figure
10, is an indication of unbalance in a
machine.
NOTE: Increasing unbalance forces place
increasing loads on nearby bearings. If the
bearing’s specified load is exceeded,
damage can occur and the bearing’s life is
drastically reduced.
© 2003 SKF Reliability Systems All Rights Reserved
14
Spectrum Analysis
Unbalance
Very Slight Misalignment
Figure 10. FFT showing unbalance in the spectrum (at F = 4237.5 RPM or 70 Hz). Additionally, there is an
indication of slight misalignment (the smaller peak) at 8475 RPM or 141 Hz.
Mechanical Looseness
•
Mounting is cracked or broken.
A long string of rotating frequency
harmonics or 1/2 rotating frequency
harmonics at abnormally high amplitudes,
generally characterizes mechanical
looseness, or an improper fit between
component parts (see Figure 11).
•
A machine component came loose.
•
The bearing developed a fault, which
wore down bearing elements, or the
bearing seat caused excessive clearance
in the bearing.
NOTE: These harmonics may be random
and unorganized. For example, looseness
may display peaks at 2x, 3x, 4x, 5x, 6x, etc.
or at 3x, 3.5x, 4x, 5.5x, 6x, etc.
Effects
If looseness is generated from a component,
there is a possibility the part will become
detached and cause secondary damage.
Causes
Diagnosis
Possible causes of wear / looseness are:
Looseness can be exhibited in varying
amplitudes, both overall vibration and
individual frequency amplitudes. Looseness
is best diagnosed using FFT spectra and
phase.
•
The machine came loose from its
mounting.
© 2003 SKF Reliability Systems All Rights Reserved
15
Spectrum Analysis
Looseness
Figure 11. FFT spectrum indicating looseness in the machine. Notice all of the repeating multiples of running speed
or ½ of running speed.
Spectrum Analysis
Figure 11 displays vibration signatures
associated with components or systems.
Typically, looseness is identified by
abnormally high running speed amplitude
followed by multiples or 1/2 multiples.
Harmonic peaks may decrease in amplitude
as they increase in frequency (except at 2x,
which, when measured in the vertical
position, can be higher in amplitude).
high, there may be mechanical
looseness.
Bent Shaft
With overall vibration and spectral analysis,
a bent shaft problem usually emits a
vibration signature that appears to be
identical to a misalignment problem. The
use of phase measurements is needed to
distinguish between the two.
Summary
Causes
•
There are several causes that can result in a
bent shaft:
•
If there are a series of three or more
synchronous or 1/2 synchronous
multiples of running speed (range 2x to
10x), and their magnitudes are greater
than 20% of the 1x, there may be
mechanical looseness.
If the machine is rigidly connected (no
coupling or belt), and the radial 2x is
•
Cold Bow: A shaft with a high length to
width ratio can, at rest, develop a bend.
•
Improper handling during assembly or
transportation
•
High torque
© 2003 SKF Reliability Systems All Rights Reserved
16
Spectrum Analysis
Effects
As with unbalance, a bent shaft usually
causes the bearing to carry a higher dynamic
load than its design specification, which
causes the bearing to fail.
Diagnosis
The use of overall vibration measurements,
spectral analysis, and phase measurements
can be effective to analyze a bent shaft.
Spectrum Analysis
A bent shaft typically produces spectra that
have misalignment type characteristics. A
higher than normal 1x divided by 2x
amplitude may occur. High 2x amplitude
can vary from 30% of the 1x amplitude to
100% - 200% of the 1x amplitude.
Phase Analysis
Phase measurements are essential when
diagnosing a bent shaft.
Rolling Element Bearing
Defects
Most often the bearing defect is not the
source of the problem. Usually, some other
machinery component or lubrication
problem is causing the bearing defect. When
a bearing defect is detected you should
automatically look for other root cause
problems such as misalignment and
unbalance. Then schedule the repair of both
the defective bearing and the fault causing
the bearing defect.
Bearing Defects
To understand how to monitor bearings, an
understanding of how a bearing defect
progresses should be achieved.
NOTE: The following discussion relates to
typical spall or crack type bearing defects on
rolling element bearings.
Bearing failure may be caused by:
NOTE: All phase values are ± 30°.
•
Ineffective lubrication
Radial phase measurements (vertical and
horizontal) typically appear “in phase” with
the shaft.
•
Contaminated lubrication
•
Heavier loading than anticipated
Axial phase measurements are typically
180° out of phase with the shaft.
•
Improper handling or installation
•
Old age (subsurface fatigue)
If both of the prior conditions are true, the
problem is most likely a bent shaft.
•
Incorrect shaft or housing fits
•
False brinelling due to external vibration
sources while machine stands still
•
Passage of current through bearing
Summary
•
If the primary vibration plane is in the
axial direction, there is a dominant 1x
peak, and there is a 180° phase
difference in the axial direction across
the machine, there may be a bent shaft.
Often, initial bearing fatigue results in shear
stresses cyclically appearing immediately
below the load-carrying surface. After time
these stresses cause cracks that gradually
extend to the surface. As a rolling element
passes over these cracks, fragments break
away. This is known as spalling or flaking.
The spalling progressively increases and
© 2003 SKF Reliability Systems All Rights Reserved
17
Spectrum Analysis
eventually makes the bearing unusable. This
type of bearing damage is a relatively long
process, and makes its presence known by
increasing noise and vibration.
bearing problem and potentially extend the
bearing’s life.
Acceleration and velocity vibration
measurements are also useful tools for
measuring the final stages of a bearing’s life.
These measurements typically provide
indications of imminent bearing failure (less
than 10% of residual bearing life).
Velocity Measurements
Figure 12. Spalling or Flaking on the Outer Ring of a
Bearing.
Another type of bearing failure is initiated
by surface distress. Surface distress causes
cracks to form on the surface and grow into
the material. Surface distress is usually
caused by excessive load or improper
lubrication.
In both cases, the failing bearing produces
noise and vibration signals that if detected,
give the user adequate time to correct the
cause of the bearing problem or replace the
bearing before complete failure.
Acceleration enveloping is an effective tool
to detect and monitor the early stages of
bearing failure caused by local defects.
Again, this provides enough pre-warning
time to possibly correct the cause of the
The prior examples and many other types of
problems can cause bearings to fail. It is
important to assess and understand the
proper types of measurements to take and
their results. One of the most common
measurements used in vibration analysis is
velocity. These measurements are very
useful for detecting and analyzing low
frequency rotational problems such as
unbalance, misalignment, looseness, bent
shaft, etc. The following section describes
velocity measurements and provides an ISO
classification to help determine severity
levels.
Table 1 illustrates the ISO 2372 Standard for
an overall severity of vibration. Please keep
in mind that the levels are machinery and
environment dependent, and have to be fine
tuned in practice.
© 2003 SKF Reliability Systems All Rights Reserved
18
Spectrum Analysis
Table 1. ISO 2372 Standards.
Vibration - Spectral Analysis
Due to the nature of bearing defect
frequencies, they occur at much higher
frequencies and much lower amplitudes than
frequencies related to unbalance and
looseness. ISO severity charts were not
developed to aid in setting parameters for
detecting early bearing degradation. For
bearing related issues, it is important to
evaluate the bearing’s FFT spectrum and its
related defect frequencies.
To help determine if machine problems
include a faulty bearing, bearing defect
frequencies can be calculated and used as
overlays to aid in diagnosis. There are
several naming conventions that were
adapted for use when discussing frequency
analysis. The two most common
conventions are listed below. The four
primary bearing frequencies:
•
Ford – Frequency Outer Race Defect
•
Fird – Frequency Inner Race Defect
•
Fbd – Frequency Ball Defect
•
Fc – Frequency Cage
Or:
•
•
© 2003 SKF Reliability Systems All Rights Reserved
BPFO– Ball Pass Frequency Outer Race
BPFI– Ball Pass Frequency Inner Race
19
Spectrum Analysis
•
BPF– Ball Pass Frequency
•
FTF– Fundamental Train Frequency
When the defect frequencies (Ford, Fird, Fbd,
Fc) align with peak amplitudes in the
vibration spectrum, it is commonly accepted
that there are defects within that particular
component of the bearing. Notice that the
ball defect frequency is by definition twice
the ball spin frequency, as the ball defect
hits the inner and outer race during one
rotation.
NOTE: In many condition monitoring
programs, the following are interchangeable.
The use of one set or the other set is
suggested, but do not interchange them.
•
Ford
=
BPFO
•
Fird
=
BPFI
•
Fbd
=
2 * BSP
•
Fc
=
FTF
If bearing analysis software is not available,
bearing defect frequencies should be
mathematically calculated.
Ford = (n/2) (RPM/60) (1 – (Bd/Pd)(cos ø))
Fird = (n/2) (RPM/60) (1 + (Bd/Pd)(cos ø))
Fbd = 2 * (1/2)(Pd/Bd)(RPM/60) [1–(Bd/Pd) 2cos2ø]
Fc = (1/2) (RPM/60) (1 – (Bd/Pd)(cos ø))
Where:
n
=
number of balls
Bd
=
ball diameter
Pd
=
pitch diameter
ø
=
contact angle
Figure 14 shows a typical bearing defect in
its final stages. The size and width of the
hump at ~9x running speed indicates that the
defect is approaching failure. In early stages
this hump may appear as non-synchronous
peaks, or may not exist.
© 2003 SKF Reliability Systems All Rights Reserved
20
Spectrum Analysis
Bearing Frequencies
(~9 x running speed)
Figure 13. Velocity measurement with typical bearing frequencies indicated as a ‘hump’ in the spectrum at
approximately 9x running speed. The other peaks to the left side of the spectrum are unbalance, misalignment, and
some looseness due to the loss of loading properties.
Acceleration Enveloping Spectral
Analysis
In the early stages of degradation, a bearing
defect may not be detectable on normal
acceleration or velocity vibration spectra.
This is due in part to:
•
The vibration that is present in the
bearing frequency range may not be
shown by the FFT.
•
The vibration’s amplitude is so small
that low frequency rotational vibrations
mask it.
Acceleration enveloping measurements
monitor bearing frequency ranges at which
the defect’s repetitive impacts occur and
filter out all non-repetitive impact signals
(i.e. low frequency rotational events). The
repetitive impact signals are enhanced and
appear as peaks at the defect’s frequency. To
assist in determining if a machine’s
problems include a faulty bearing, bearing
defect frequencies can be calculated and
overlaid on the vibration spectra.
The enveloped time domain of an
acceleration measurement and spectra for an
inner ring defect are shown in Figure 15.
When collecting acceleration enveloping
readings it is important to also collect time
domain data. Time domain data can be very
useful in the diagnosis of vibration problems
in components such as gears and bearings.
Figures 15 through 19 show examples of
spectrum and time waveform data. All of the
illustrations contain captions to describe
each figure and its data.
© 2003 SKF Reliability Systems All Rights Reserved
21
Spectrum Analysis
Inner Ring Defect Frequencies
Figure 14. Inner ring defect frequencies displayed in an enveloped spectrum. The first peak, from left to the right, is
running speed (5775 RPM). The large peaks at ~51,000, 115,000 RPM…are peaks in the spectrum related to the
defect frequency of the inner ring of the bearing. These peaks indicate a possible defect on the bearing’s inner ring.
Figure 15. Enveloped spectrum with outer race defect and bearing frequency overlays. This spectrum indicates a
defect is present on the bearing’s outer race.
© 2003 SKF Reliability Systems All Rights Reserved
22
Spectrum Analysis
Figure 16. Enveloped time waveform (defect outer race). The defect is indicated by the modulation of this signal.
The expansion and contraction of the peaks from a high amplitude (2 gE) then toward the center (zero) indicate that
energy is being generated as the rolling element over-rolls the defect.
Figure 17. Enveloped time waveform (defect inner race). The defect is indicated by the modulation of this signal.
The expansion and contraction of the peaks from a high amplitude (0.2 gE) then toward the center (zero) indicate
that energy is being generated as the rolling element over-rolls the defect.
© 2003 SKF Reliability Systems All Rights Reserved
23
Spectrum Analysis
Figure 18. Enveloped spectrum with inner race defect and bearing frequency overlays. This spectrum indicates a
defect is present on the bearing’s inner race.
Summary
Figures 15 through 19 are advanced
examples of data from an FFT Analyzer.
Time waveform and spectrum analysis are
difficult subjects to explain thoroughly in an
article that overviews the key features of
spectrum analysis. There are extensive
training courses on analyzing vibration data.
Some key issues to consider when using
vibration analysis as a method of
determining machinery health are:
•
•
•
Collect both spectrum and time
waveform data to complete a thorough
data analysis.
Develop skills around condition
monitoring through training and
application.
Build a knowledge bank of machinery
responses and problems. This helps you
apply previously gained knowledge and
minimizes repeat mistakes.
Gears
Gears are used to transmit power from one
system to another. It is important to
understand how gears work and what
symptoms to look for when performing an
analysis. Moreover, you should fully
understand the two key elements to
consider:
•
Gear Mesh Frequency (GMF)
•
Sidebands of GMF
By monitoring these two elements, you can
establish how the gear affects the system
and the significance of the problem.
Gear Mesh Frequency
Gear mesh frequency equals the number of
teeth on the gear multiplied by the speed of
the shaft to which the gear is attached.
© 2003 SKF Reliability Systems All Rights Reserved
24
Spectrum Analysis
GMF = (# of teeth on the gear)(speed of the
shaft to which the gear is attached)
Example:
GMF = (50 teeth)(1180 RPM)
GMF = 59,000 CPM or 983.3 Hz
In addition to evaluating GMF it is
important to use the proper span (Fmax)
regarding frequency range to observe the
GMF at higher frequencies in the same
vibration signature. To achieve this span,
GMF should be multiplied by a factor of
3.25.
Example: Using the above GMF,
Fmax = 3.25 x GMF
Fmax = (3.25)(59,000 CPM)
Fmax = 191,750 CPM or 3195.8 Hz
If the GMF is not known, use
Fmax = 200 x Shaft Running Speed
Fmax = 200 x 1180 RPM
The factor of 3.25 relates to a gear
characteristic that wear problems do not
necessarily occur at fundamental gear mesh
frequency (1xGMF), but may occur at 2x or
3x GMF. In fact, one of the most common
frequencies at which gear mesh is detected
is 3x GMF. This is attributed to the three
motions of gear interaction; engaged sliding,
rolling and disengaged sliding. Hence, 3
pulses per revolution. The consideration of
this factor should be evaluated when
collecting gear mesh data.
Gear Mesh Frequency Sidebands
Gear mesh frequency sidebands can be more
significant than GMF. The sidebands are
spaced around the GMF relative to the RMP
of each mating gear. When the amplitude of
the sidebands increases, and the number of
sidebands present increases, there is likely a
problem with the gearbox components.
Additionally, if one or both interfacing gears
have worn teeth, the spectrum also exhibits
sidebands around GMF. These sidebands are
spaced at a distance equal to the shaft speed.
Fmax = 236,000 CPM or 3933.3 Hz
© 2003 SKF Reliability Systems All Rights Reserved
25