JM02014 vibration monitoring of bearings
Bạn đang xem bản rút gọn của tài liệu. Xem và tải ngay bản đầy đủ của tài liệu tại đây (1.02 MB, 18 trang )
Vibration Monitoring
of Bearings
Example Bearing Failure Cases Detected by
Vibration
Summary
Many decisions are made concerning the mechanical condition
of production machinery in the daily operation of a production
facility. Often these decisions are made based on opinions - not
facts. Vibration analysis provides decision makers with better
information to enable better decisions. Because all rotating forces
are carried through the bearings, knowledge of the condition of
these bearings and the machine is important in the daily
production decisions. This paper demonstrates how condition
monitoring can provide decision makers with better information
for better decisions. The case study examples include damaged
cages, inner and outer rings, and looseness. Low speed and
journal bearing examples are also included.
Dr. Robert Jones
18 pages
May 2003
SKF Reliability Systems
@ptitudeXchange
4141 Ruffin Road
San Diego, CA 92123
United States
tel. +1 858 244 2540
fax +1 858 244 2555
email:
Internet: www.aptitudexchange.com
Use of this document is governed by the terms
and conditions contained in @ptitudeXchange.
Vibration Monitoring of Bearings
Introduction......................................................................................................................................3
Background ......................................................................................................................................3
Data Gathering Techniques..............................................................................................................3
Bearing and Vibration Terminology................................................................................................5
Signal Processing .............................................................................................................................6
Case Histories ..................................................................................................................................6
Cage Problems ..........................................................................................................................6
Cracked Inner Race...................................................................................................................8
Damaged Outer Raceway .......................................................................................................11
Loose Bearing Installation......................................................................................................13
Low Speed Applications.........................................................................................................14
Journal Bearings .....................................................................................................................16
Odds and Ends ........................................................................................................................17
Conclusion .....................................................................................................................................18
Resources .......................................................................................................................................18
© 2003 SKF Reliability Systems All Rights Reserved
2
Vibration Monitoring of Bearings
Introduction
Deciding which machines to rebuild is a
common problem. If you look at five similar
machines, and you have time to overhaul two
of them during the next shutdown, which two
do you select? Do you work on the two that
have been in operation the longest, the two
with the poorest performance numbers, or the
two that the operators believe need rework? At
various times each of these criteria has been
used to pick the next candidate for overhaul.
Along the same line of thought, how many
times have we seen a smooth operating piece
of equipment taken out of service for overhaul
simply because it has reached its time limit as
set by the manufacturer? This paper
demonstrates how condition monitoring
provides the information needed to make
correct maintenance decisions.
Background
All rotating equipment has one thing in
common: bearings. Bearing condition is of
prime importance when monitoring equipment
health. For example, if bearings are in good
condition, even an out of balance, misaligned
machine will operate. However, if bearings
are damaged, the machine will soon fail even
if properly assembled and balanced. Today,
technology has developed new techniques for
non-intrusive determination of bearing
condition.
With the advent of portable vibration
measuring equipment, some operators noted
that the high frequency energy generated by a
failing bearing would excite the natural
frequency of the bearing. Based on this
information, they could recognize a bad
bearing.
The next step in this evolution was to use
velocity measurements to look for specific
frequencies generated by bearing elements as
they rotated. With this improvement, the
accuracy increased, but good technicians
would often miss bearing flaws on very slow
rotating machinery (considering anything
below 100 RPM as slow). With the inclusion
of enveloping algorithms, the accuracy
improved. A few bad bearings still get
misdiagnosed, but they are rare.
The techniques explained in this paper apply
to all rolling element bearings and provide
some information about the condition of
sleeve or journal bearings. Moreover, this
information applies to all bearing
manufacturer’s products. What is unique is
that each vibration data collector manufacturer
uses different algorithms in processing the
electronic signal generated by the
accelerometer. Therefore, the results and
reliability of other data gathering equipment
may not be equal to that used by the author.
The mathematical processing of an electrical
signal known as enveloping has been in
existence for over 20. However, only in the
past few years, with the advent of portable
equipment with sufficient storage and
computer power, has the technology been
made available to plant technicians and
engineers in the field. A simple explanation of
the process: by using selective high frequency
bypass filters, the repetitive signals generated
as the rotating elements pass over a flaw is
mathematically enhances. Then, this
processed signal is demodulated and presented
to the user in the frequency range he desires.
Therefore, if you have a pump with a bad
bearing, the bearing signals, which are
repetitive, are enhanced, while the nonrepetitive flow and possible cavitation noise
are degraded. It is not the purpose of this
paper to provide a full mathematical
explanation of the process, but if the reader is
interested, consult other @ptitudeXchange
articles.
Data Gathering Techniques
Just as vibration is created when you run your
thumbnail down a comb, rolling element
© 2003 SKF Reliability Systems All Rights Reserved
3
Vibration Monitoring of Bearings
bearings generate a vibration as they roll over
a defect in the race of a bearing. If the flaw is
on the inner race, it generates a specific
frequency different from the outer race
frequency, as the relative speed of the rolling
elements is different for the two races. (Faster
on the inner race than the outer, when the
inner is rotating). In like manner if there is a
flaw on the rolling element, it also generates a
vibration, although it is at a different
frequency. And it follows that if the cage has a
defect, it generates another frequency. So it is
possible that a defective bearing could
generate four specific frequencies, all at the
same time; however, rarely more than two
occur at once. Experience has shown that a
stationary outer race, which is always in the
load zone, is usually the site where “normal”
initial degradation occurs. The inner race is
rotating, so the load zone is spread over the
entire race rather than at one point as in the
outer race.
Common to most modern portable electronic
data collectors is the accelerometer. These are
generally constructed with a manmade piezoelectric crystal that generates an output
voltage directly proportional to the
acceleration force applied. The accelerometer
is usually placed on the bearing cap, or as near
as possible. Since one of the analysis
techniques involves trending of vibration
levels, it is important that the data collection
location is marked and the same location is
consistently used each time.
In those instances where it is not possible to
safely position the accelerometer by hand, the
accelerometer may be permanently stud
mounted to the machine, and the signal wire
terminated in a safe location. Generally, the
accelerometer is mounted using a magnet.
Both methods are acceptable for general
vibration monitoring. In rare instances a
stinger may be attached to the accelerometer
to reach a bearing cap located in a tight space,
but stingers alter the signal amplitude and
frequency, and are not recommended for
general usage.
For continuous machine monitoring, all of the
points of interest use a stud or epoxy mounted
accelerometer. The signal wires are then
terminated at a common point where they are
multiplexed and routed to a permanently
mounted data collector. The signals from the
data collector pass to a computer controller
that is programmed to store and process the
data. One accelerometer signal can be
processed into four presentations:
acceleration, velocity, displacement, and
enveloped acceleration. These presentations
may be processed for different frequency
ranges as needed. In other words, the velocity
signal may be presented in one spectrum from
0-30 Hz to check for balance and alignment. A
second spectrum may be generated with a
range of 0-1000 Hz to disclose the rotor bar
pass frequency, checking for stator damage. In
addition, other types of sensors can collect
operational data such as shaft position, speed,
temperature, flow, pressure, etc. Generally,
any sensor that provides a voltage output can
be monitored, and the signal can be collected
and stored for evaluation.
Historically, velocity measurements are used
to monitor general machinery conditions.
Various engineering groups have derived
acceptable amplitude limits for warnings and
shutdowns. It was accepted that slow speed
equipment was very difficult to monitor
because the signals were usually so low that
they would be buried in the data collector’s
noise floor. There are good physical reasons
for this; velocity is the resultant of dividing
distance by time. In low speed equipment the
distance it moves divided by a relative long
time results in a velocity of extremely low
amplitude. Since we have difficulty measuring
velocity, measuring the acceleration enables
us to measure the amount of forces generated
inside the bearing. One can apply a force to a
machine, which can be measured, but the
© 2003 SKF Reliability Systems All Rights Reserved
4
Vibration Monitoring of Bearings
machine may not move (no velocity). When a
rolling element passes over a defect in a
bearing a force vector is generated. As stated
before, these minute repetitive forces are then
processed in a manner that allows them to be
evaluated with reference to their severity.
Unlike velocity measurements, which are not
speed related, the evaluation of an enveloped
signal requires knowledge of the rotating
speed. When we say “speed related” we mean
that a velocity reading of 0.35 inches per
second (IPS) indicates a “rough running”
machine, and it doesn’t matter if the rotation
speed is 1785 RPM or 3560 RPM. However,
with enveloped (gE) readings, machine speed
is very important. A damaged conveyor
bearing rotating at 10 RPM with an amplitude
of 0.03 gE would be of concern; however, if
this reading was taken on a pump bearing
rotating at 1780 RPM, there would be no
concern.
Bearing and Vibration
Terminology
Where:
BPFO = Ball Pass Frequency Outer Race
BPFI = Ball Pass Frequency Inner Race
BSF = Ball Spin Frequency
FTF = Cage Frequency
N = Number of balls or rollers
Bd = Ball diameter (in or mm)
Pd = Bearing Pitch diameter (in or mm)
∅ = Contact angle, ball to race
These formulas apply to bearings mounted on
the shaft with a rotating inner ring. If the outer
ring is rotating, reverse the (+) and (-) in the
formulas.
Another handy rule of thumb to use when you
are in the field:
BPFO = (RPM) (N) (0.4)
BPFI = (RPM) (N) (0.6)
Bearings are constructed of four parts: rolling
elements, an inner ring, an outer ring, and the
cage. As previously stated, each of these
components, if damaged, usually generates a
unique frequency. As can be seen in the
following frequency calculations, the
frequency generated is based on the number of
rolling elements, the shaft rotation speed, ball
diameter, pitch diameter, and the contact
angle. Formulas are provided below.
The first four formulas give the frequency
results in Hertz (Hz). Hz is cycles per second.
If you desire them in cycles per minute,
(CPM), multiply by 60.
•
Displacement (distance) is measured in
"Mils" - one mil equals 0.001 inches.
Metric measurements are in millimeters.
Bearing frequency formulas:
•
Velocity (speed) is measured in Inches Per
Second, IPS. For metrics, the units are
mm/sec. For a quick approximation, 1
mm/sec equals 0.04 IPS
•
Acceleration (force) is measured in G’s,
for both English and Metric units
•
Enveloped Acceleration (Derived force) is
a special measurement gE of acceleration,
© 2003 SKF Reliability Systems All Rights Reserved
5
Vibration amplitudes are measured in the
following units:
BPFO = (N/2) (RPM/60) (1 - (Bd/Pd)(cos ∅))
BPFI = (N/2) (RPM/60) (1 + (Bd/Pd)(cos ∅))
BSF = (1/2) (RPM/60) (Pd/Bd) *
(1 - [(Bd/Pd)(cos∅)]2 )
FTF = (1/2) (RPM/60) (1 - (Bd/Pd)(cos∅))
Vibration Monitoring of Bearings
and there is no comparison or conversion
to the standard acceleration measurements.
Signal Processing
Although this paper does not focus on signal
processing, it is necessary to examine some
characteristics of the process. All major data
collectors receive the accelerometer signal,
and either store or display it as a time vs.
amplitude signal. This is the signal one would
see if looking at an oscilloscope: amplitude on
the “Y” axis and time on the “X” axis. A
Fourier transform must be applied in order to
see this same presentation in the frequency
domain. The resultant is a display with the
amplitude again in the “Y” axis but the “X”
axis is now displayed as a frequency range,
which the user can select in either Hz or CPM.
For history buffs, Jean Baptiste Fourier was a
famous French mathematician who developed
the basic theories for signal analysis. One
great benefit in using an enveloped Fourier
transform is that it provides us with positive
evidence of the presence of bearing damage.
Although a pure sine wave only exists is in the
laboratory, a loaded rotating bearing generates
an approximation. If there is no damage, and
the bearing is heavily loaded, the Fourier
transform (FFT) produces a single frequency
spike of energy at the bearing BPFO. The
process is sensitive enough to detect the
minute outer ring movement that takes place
as three, then four, then three rolling elements
pass through the load zone. If the bearing is
not heavily loaded, no signal is generated so
nothing appears in the spectrum. However, if
there is damage, the sine wave is clipped or
truncated. An FFT of a clipped sine wave
results in the fundamental frequency, BPFO
for example, plus harmonics of that frequency.
If there is no BPFO signal, or if it is present
and there are no harmonics then the user
knows there is no damage in the bearing. If
harmonics of the bearing components are
present, there is damage. Then the user has to
evaluate these damage indicators based on
amplitude and shaft speed. For general
machine condition, if the FFT displays
multiple harmonics of the shaft rotation
speed, this indicates looseness in the machine
parts and not damage in the bearing.
Case Histories
Cage Problems
At a new construction site it is common to see
many new pieces of production equipment
sitting at various locations covered with
plastic or a tarp, because they have arrived
before the building was completed. If this
occurs over an extended period of time, the
bearings will be damaged. No matter what
time of the year, metal gets warmer in the
daytime and cooler at night, producing
condensation. When this condensation occurs
inside the bearing, trouble begins in two
forms. First the hydrogen molecule in the
water attaches to metal molecules resulting in
hydrogen embrittlement. Second, the oxygen
oxidizes the metal, creating rust. Then several
months later, when the equipment is installed
and activated, loud grinding and scraping
noises emit from the bearings. This was the
case at a new plant in Richmond, Virginia.
They were able to obtain seven of the needed
eight replacement bearings from the local
bearing shop but could not locate the eighth.
In desperation they obtained a bearing from a
junk shop and proceeded with the installation.
When this machine ran, it was vibrating much
more than the other. Thus, we were called in
to determine the cause.
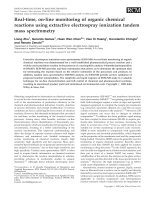
We were told that the bearings were SKF
22222s, and that the fan speed was about 1600
RPM. Figure 1 is the frequency spectrum we
collected on the suspect bearing. We can
overlay on the spectrum the frequency
markers for each of the bearing components.
What is immediately seen is that the cage
frequency (FTF) lines up with an energy
spike. For clarity, the other three bearing
© 2003 SKF Reliability Systems All Rights Reserved
6
Vibration Monitoring of Bearings
frequency markers are not shown. The secret
to frequency analysis is identifying the
sources for the energy seen in the spectrum. In
this case, the only thing in this machine that
would generate 675 CPM is a damaged cage
in an SKF 22222 bearing.
photograph of the bearing showing the
damaged cage. Using the serial number on the
bearing, it was determined that it was over 21
years old! Sometime during its life, someone
had struck the brass cage and deformed it,
either during an installation or removal.
Based on this analysis, the bearing was
removed and inspected. Figure 2 is a
Figure 1. Velocity Spectrum Indicating a Damaged Cage.
.
Figure 2. Damaged Cage, SKF 22222.
© 2003 SKF Reliability Systems All Rights Reserved
7
Vibration Monitoring of Bearings
This case illustrates how we find damaged
components using frequency analysis. It also
points out the need to use care when
purchasing bearings, even if you are under
pressure to get a machine back in service. The
major bearing manufacturers provide
customer training on care and handling of
rolling element bearings. Somewhere in the
past, someone was not aware that you should
not mount and dismount bearings with
hammers and drift pins.
Cracked Inner Race
There are very specific tolerances for bearing
fits on the shaft and in the housings, and if
followed, one can expect a long bearing life.
In the next example we see that if shaft fits are
not maintained the results can be disastrous.
A bearing slowly rotates if it is loose on the
shaft. The friction generates heat, which in
turn causes the shaft and inner ring to expand.
In this case, the shaft expanded more than the
ring, to the point where all the fit tolerances
were exceeded and the ring cracked. Figure 3
is the enveloped spectrum we collected while
the unit was in operation.
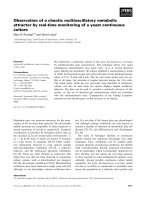
The owner told us the unit was operating at
1200 RPM and the installed bearing was an
SKF 2222. When we first looked at this
spectrum without the bearing frequency
overlay, it appears that we have multiple
harmonics of the shaft speed, 1203 RPM,
which would indicate looseness in the
machine assembly. Figure 4 shows the value
of further evaluation.
Figure 3. Enveloped Acceleration, Suspect Bearing.
© 2003 SKF Reliability Systems All Rights Reserved
8
Vibration Monitoring of Bearings
Figure 4. Suspect Bearing with Bearing Inner Ring Frequency Defect Markers.
The bearing frequency overlay clearly shows
us that we have a problem with the inner ring.
We can see the fundamental inner ring
frequency with harmonics. Inner ring defects
have a unique characteristic in that they
almost always produce sidebands of the shaft
speed. Using software, we can overlay
sideband markers and see that they are the
shaft speed. These sidebands are created by
the natural modulation caused by the flaw
rotating in and out of the load zone.
Figure 5. Suspect Bearing with Shaft Speed Sideband Markers around the Inner Ring Bearing Frequency.
© 2003 SKF Reliability Systems All Rights Reserved
9
Vibration Monitoring of Bearings
With this evidence in hand, it was reported
that the bearing had a damaged inner ring and
the overall amplitudes indicated a need for
immediate action. Figure 6 is a spectrum taken
on the same bearing at the same location and
at the same time as those above. The only
difference, besides the upper frequency limit,
is that the acceleration signal is processed to
read out in velocity. Compare Figure 4 with
Figure 6. The cursor is placed on the bearing
frequency and the amplitude reads 0.0004 IPS.
No one would ever consider changing a
bearing with this low an amplitude; however,
we have enveloped acceleration readings that
show a problem. The visual proof is the photo
of the inner ring after it was removed. This
should convince anyone that enveloped
acceleration is a much more sensitive method
of analyzing bearing conditions.
Figure 7 is a photograph of the bearing. A
piece of paper was inserted into the crack to
make it more visible. Proof that the bearing
had been turning on the shaft is seen on the
inside of the ring, it is scratched, has black and
blue heat marks, and is coated with fretting
corrosion. Of course this is one of those
“which came first” problems: the crack or the
looseness. Once the ring cracks it certainly
turns on the shaft, and if it was not scratched
and blued before, it soon will be. A likely
sequence of events is that the bearing was
mounting too tight, the inner ring is forced to
break, and looseness resulted. An alternative
sequence would be too much looseness,
resulting in fretting, which then initiated the
crack. In any event, the bearing was damaged
and needed replacement.
Figure 6. SKF 2222 Velocity Measurement, Cracked Ring.
© 2003 SKF Reliability Systems All Rights Reserved
10
Vibration Monitoring of Bearings
Figure 7. SKF 2222 With Cracked Inner Ring.
Damaged Outer Raceway
It is not often that we are able to obtain
damaged bearings after they have been
replaced, as repairs often take place during off
shifts. However, in these first few examples
the customer was interested in having a first
hand look.
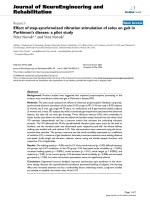
On a cooling fan operating at approximately
1480 RPM, we collected data that indicated
possible damage in the outer ring of an SKF
2218, a double row ball bearing. Figure 8 is
the velocity spectrum we collected. The
amplitude of the velocity measurement for the
BPFO is only 0.021 IPS, but there is a
harmonic present. Although there is damage,
we can see the harmonic. Action would
normally not be taken with just the velocity
reading. As in the previous case, we collected
another spectrum processing the signal using
the enveloped acceleration algorithm.
Figure 8. SKF 2218 Velocity Measurement.
© 2003 SKF Reliability Systems All Rights Reserved
11
Vibration Monitoring of Bearings
Figure 9. SKF 2218 Enveloped Acceleration Measurement.
This time we overlaid both the BPFI and
BPFO to verify that the damage was only in
the outer ring. Note that the amplitude of the
fundamental BPFO is nearly 1.25 gE. At this
rotation speed, any amplitude over 1.0 gE is
cause for concern. Figure 10 is a photograph
of the damaged bearing’s outer race. The
photograph only shows two small ball tracks,
but examination with a 20X lens revealed
pitting and spalling primarily in the load zone,
with some carryover around the entire ring.
Once spalling begins, the degradation process
can be very rapid as the small particles stick to
the rolling elements and are imbedded and
over rolled throughout the remainder of the
bearing ring. At this point, a prediction of
remaining bearing life would only be a guess,
as there are too many variables and any
amplitude trends would be approaching a nonlinear function. Again, this is damage that is
readily apparent using enveloped acceleration,
and would not be apparent with only velocity
measurements.
Figure 10. SKF 2218 Outer Ring Damage.
© 2003 SKF Reliability Systems All Rights Reserved
12
Vibration Monitoring of Bearings
Loose Bearing Installation
There are occasions where velocity is the best
measurement. If you have ever been in a room
where a extremely loud sound is being
created, you know how difficult it is to point
to the source. It just seems to be coming from
everywhere. When looseness becomes
extreme the same effect occurs with the
accelerometer. What you find with the
enveloped signal is a lot of frequency spikes
that are somewhat difficult to interpret. Figure
11 is the velocity spectrum of a taper lock
bearing that was loose on the taper and the
shaft. From a diagnostic point, multiple
harmonics of the shaft speed are usually an
indication of machine component looseness.
Note in the velocity spectrum that the fourth
harmonic is larger than the others. Generally,
when the fourth harmonic of shaft speed is
larger, it is an indication that the bearing is
loose in the housing. Also, if the third
harmonic is largest, it usually means the
bearing is loose on the shaft. Here we had a
situation that appeared to signify that the
bearing was loose in the housing, when in fact
everything was loose.
Figure 12 is the same location measured with
enveloped acceleration. This is a case where
the velocity spectrum provides clearer
information. We can observe the running
speed harmonics in the enveloped
acceleration, along with a lot of other “stuff.”
This is the reason we collect data using
several parameters when trouble shooting.
Figure 13 is a photograph of the taper. It is
scratched and has fretting corrosion inside and
outside, physical evidence the taper was loose
on the shaft and the bearing was loose on the
taper. This was probably due to wrong
mounting.
Figure 11. Velocity Spectrum With Multiple Harmonics of Shaft Speed.
© 2003 SKF Reliability Systems All Rights Reserved
13
Vibration Monitoring of Bearings
Figure 12. Enveloped Spectrum of the Loose Bearing.
Figure 13. Fretting Corrosion on Taper Lock.
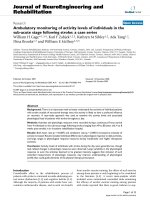
Low Speed Applications
The most efficient way to reduce shaft speed
is to pass it through a reduction gearbox. One
common applications is on conveyor belts
where slow speed is required to move
materials. Figures 14 shows the velocity
spectrum from a reduction gearbox where the
output shaft speed is 8.4 RPM. As stated
earlier, on low speed equipment the velocity
spectrum does not provide useful information
on bearing conditions.
The signals at the low end of the spectrum are
not valid. When an accelerometer signal is
integrated to obtain velocity, the internal
electronic noise in the data collector is also
integrated, producing a false vibration signal.
This is common to all data collectors. The
usual practice is to filter out the signal by
starting the spectrum at 60 or 120 CPM. In
this case we started at “0” to show where the
8.4 RPM would be. Figure 15 shows the
enveloped acceleration spectrum.
© 2003 SKF Reliability Systems All Rights Reserved
14
Vibration Monitoring of Bearings
Figure 14. Velocity Measurement at 8.4 RPM.
Figure 15. Enveloped Acceleration at 8.4 RPM.
© 2003 SKF Reliability Systems All Rights Reserved
15
Vibration Monitoring of Bearings
Figure 15 indicates a problem on the inner
race of this FAG 10414 bearing. The
fundamental BPFI has harmonics, and at a
speed of 8.4 RPM, the amplitude of 0.006 gE
is severe. From a production standpoint, the
replacement time for this bearing is 2.5 days.
When this amount of time can be scheduled,
operating costs are reduced. On average,
unscheduled repairs cost 10 times the cost of a
scheduled repair.
an increase in the vibration level at a
frequency equal to the shaft speed. As the
bearing continues to wear, the shaft will not be
properly supported and will begin to “bounce
around,” generating a spectrum with multiple
harmonics of the shaft speed. In addition, we
have found that oversize or worn journal
bearings produce these harmonics, and the
fourth harmonic has greater amplitude than
the others.
Journal Bearings
Figure 16 illustrates a velocity spectrum of a
recently overhauled screw compressor. The
overall amplitude was excessive, and machine
shut down was recommended. When the
machine was taken off line, they realized the
journal bearing that had been installed during
the overhaul was oversized. The male rotor
movement exceeded the screw mesh
clearances, which could have resulted in a
catastrophic failure.
Journal bearings, also called sleeve or plain
bearings, are best monitored by an oil analysis
program. Theoretically, if the proper oil film
is maintained between the shaft and the
journal, wear does not occur. In real life we
know this does not happen. Oil analysis is the
first indication of excessive wear. If the owner
does not have an oil analysis program then the
first indication of a problem will probably be
Figure 16. Velocity Spectrum of Oversized Journal Bearing with High Fourth Harmonic.
© 2003 SKF Reliability Systems All Rights Reserved
16
Vibration Monitoring of Bearings
Odds and Ends
Often the owner of the machine has no idea
what bearings are installed. Usually, the
machine has been in service many years with
several overhauls by several people and no
one wrote down what bearings were used. A
helpful characteristic of the bearing fault
frequency calculations is that when the contact
angle is greater than “0” the multiplier will
result in a frequency that is a non-integer
multiple of the shaft speed. In Figure 17, the
cursor is placed on an unknown frequency
spike and the Order information in the Single
Value box tells us it is 7.263 gE. Then, we can
place the harmonic marker on this mystery
frequency and see that we have harmonics.
Based on this information it would be prudent
to do a physical inspection of the bearing. In
Figure 17 the owner had deliberately damaged
the bearing to see if we could find it among
several others in the machine. We did.
Remember that the computer-bearing fault
frequencies are calculated based on new
bearing dimensions. The bearings you are
inspecting are probably worn, and
consequently the actual frequencies generated
may not fall exactly on the observed
frequency.
Through experience we have found that most
inner ring failures are caused by poor
installation. When the bearing is placed on the
shaft by pushing on anything but the inner
ring, damage occurs. Force on the cage
damages the cage and pushes the rolling
elements against the lip of the races, causing
damage to the rings. Even if the damage does
not effect machine operation, it results in
noisy bearings.
Care should taken to prevent water from
entering the lubrication. One percent water in
the lube system reduces bearing life by 90%
And finally, over half of machine failures are
caused by the loss of the rolling element
bearings. Why? Because of misalignment!
Other than thrust bearings, rolling element
bearings are designed to carry a radial load.
When misalignment occurs, an axial
component is generated. When this becomes
excessive, the bearings begin to fail. Probably
the one procedure that saves the most money
in any maintenance department would be to
improve alignment methods. For this, we
strongly recommend laser alignment
equipment.
Figure 17. Unknown Bearing With Energy at 7.263 Times Shaft Speed and Harmonics.
© 2003 SKF Reliability Systems All Rights Reserved
17
Vibration Monitoring of Bearings
Conclusion
Resources
Any technology or methodology that provides
us with better information about the condition
of our machine bearings enables us to conduct
more efficient operations. This efficiency is
seen in better scheduling of overhauls, a
reduced overtime budget, an increase in time
between failures, and an increase in
production. Knowing the condition of our
bearings provides the information we need to
increase profits. This article showed various
case histories of damaged bearings that were
diagnosed using vibration analysis.
For more information on vibration analysis
techniques, reference resources on
@ptitudeXchange, such as:
•
Bearing Failure Case Study, MB02009
•
Early Warning Fault Detection in Rolling
Element Bearings Using Microlog
Enveloping, CM3021
•
Vibration Principles, JM02007
•
An Introductory Guide to Vibration,
JM02001
© 2003 SKF Reliability Systems All Rights Reserved
18