Global generational lifestyles report FINAL
Bạn đang xem bản rút gọn của tài liệu. Xem và tải ngay bản đầy đủ của tài liệu tại đây (3.97 MB, 18 trang )
NOVEMBER 2015
GLOBAL
GENERATIONAL
LIFESTYLES
How We Live, Eat, Play, Work and Save for Our Futures
LIFESTYLES OF
THE YOUNG
AND
THE AGING
How much does our age influence how we think, where and what we eat or how we save and spend?
Depending on our age, our approach to something as simple as getting up-to-date news or eating out
can be drastically different. But today’s consumers are bucking yesterday’s preconceived generational
notions. In fact, many older people are embracing a more technology-driven world, and sizeable numbers
of younger people are turning to more traditional values. Yet for all of our differences, in many ways, it’s
remarkable how similar we are no matter the age.
The Nielsen Global Generational Lifestyles Survey polled 30,000 online respondents in 60 countries to
better understand how global consumer sentiment differs across life stage. The findings break some
myths and reaffirm others.
For the purposes of this study, respondents are segmented into five life-stage classifications:
Generation Z
(15-20)
Millennials
(21-34)
Generation X
(35-49)
Boomers
(50-64)
Silent Generation
(65+)
The results reveal insights about how consumers around the world live, eat, play, work and save.
LIFESTYLES OF
THE YOUNG
AND
THE AGING
OLD MYTHS AND NEW REALITIES
•
WHEN IT COMES TO GETTING THE NEWS, TV and search engine sites have
broad appeal for the young and old alike. Not surprisingly, older respondents
prefer traditional sources like print and radio.
•
TRADITIONAL VALUES, such as getting married, having children and buying
a house are still relevant for many Generation Z and Millennial respondents—
even if they aren’t top priorities.
•
YOUNG PEOPLE ARE HIGHLY CONNECTED, but they’re not the only ones
distracted by technology. In fact, Baby Boomers are the most likely to admit that
their mealtimes are not technology free.
About the
GLOBAL SURVEY METHODOLOGY
The findings in this survey are based
on respondents with online access in
60 countries (unless otherwise noted).
While an online survey methodology
allows for tremendous scale and
global reach, it provides a perspective
only on the habits of existing Internet
users, not total populations. In
•
IT’S NOT OLDER CONSUMERS (who often have more time and money) eating
out most often. Millennials are the most avid out-of-home diners. Nearly six-
in-10 eat out at least once a week, and almost one-third say they eat out three
times per week or more.
developing markets where online
•
TV REMAINS A FAVORITE LEISURE-TIME ACTIVITY among respondents of
all ages, but reading is also a top activity—even among Generation Z and
Millennial respondents. In fact, more younger respondents selected reading
over playing online video games and reviewing social media as a top spare-time
activity.
country. In addition, survey responses
•
JOB LOYALTY MAY BE A THING OF THE PAST. Millennials are roughly two
times more likely to leave a job after two years, 1.5 times more likely after five
years and half as likely to stay after 10 years, compared to Generation X and
Baby Boomer respondents.
penetration is still growing, audiences
may be younger and more aff luent
than the general population of that
are based on claimed behavior rather
than actual metered data. Cultural
differences in reporting sentiment
are likely factors in the measurement
outlook across countries. The reported
results do not attempt to control or
correct for these differences, therefore,
caution should be exercised when
comparing across countries and
•
DEBT IS A FACT OF LIFE for more than four-in-10 respondents of all ages,
including more than half of Generation X and Baby Boomer respondents. Older
consumers carefully monitor spending and limit purchases, while younger
respondents take a longer-term approach.
regions, particularly across regional
boundaries.
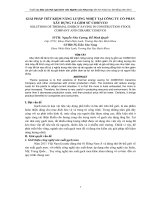
LIVE
PREFERRED NEWS SOURCES
Global Average
53%
TV
Search Engine Sites
TV IS STILL TOPS FOR
GETTING THE NEWS - EVEN
AMONG MILLENNIALS
Global respondents may rely on a mix
of traditional and digital sources to get
up-to-date news, but the age skew on
some sources is not what you may think.
It’s probably no surprise that the majority
of those over age 35 turn to TV to get the
news, but the medium still holds sway
for nearly half of Millennial (48%) and
Generation Z (45%) respondents as well.
Similarly, more Millennials prefer search
engine sites than other generations, but
they’re also among the top three news
sources among respondents of all ages—
even those 65+.
Looking beyond the sources that are
universally preferred, the use of traditional
sources to get the news is not surprisingly
higher among older respondents, while
younger generations are more reliant on
digital ones.
33%
Social Media Sites
Print Newspapers
38%
18%
Online Newspaper Sites
17%
Online TV News Sites
16%
Radio
11%
Print Magazines
8%
Online Magazine Sites
8%
Online Radio Sites
4%
SEARCH ENGINE SITES
TV
45%
48%
Generation Z
Millennials
Generation X
Boomers
Silent Generation
Source: Nielsen Generational Lifestyle Survey, Q1 2015
53%
65%
70%
34%
42%
38%
32%
25%
26%
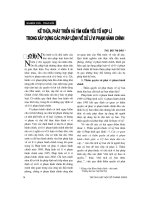
LIVE
TRADITIONAL VALUES ARE
CHANGING, BUT NOT AS
MUCH AS YOU MAY THINK
Big city/urban lifestyles have big
appeal for younger respondents.
More than half of Generation Z and
Millennial respondents (52% and 54%,
respectively) want to live in a big city or
urban neighborhood. But young adults
aren’t entirely shunning the suburbs in
favor of metropolitan settings. More
than one-quarter of Generation Z
and Millennial respondents think the
suburbs are the ideal place to live.
And while marriage and birth rates are
declining in many countries around
the world, not all younger respondents
are opposed to these traditional
aspirations. Buying a home, getting
married and having children remain
important goals for many young adults.
In fact, about one-fifth of Generation
Z and Millennial respondents consider
buying a house (21% and 22%,
respectively) or getting married (19%
and 17%, respectively), and about 10%
(11% and 13%, respectively) consider
having a baby as one of their top three
aspirations for the future.
of Millennials want to live in the suburbs
is a top priority for
22%
getting married is important for
17%
having children is a goal for 13%
Source: Nielsen Generational Lifestyle Survey, Q1 2015
LIVE
FUTURE ASPIRATIONS
Percentage Who Selected Option as One of Their Top Three Aspirations
Generation Z
Millennials
Generation X
Boomers
Silent Generation
SHIFTING PRIORITIES
As we age, our focus shifts from wealth
to health. Making money and working
in a fulfilling career are top priorities
among the highest percentages of
younger respondents, while staying fit
and healthy and spending time with
family are most important among
the highest percentages of
older respondents.
80%
71%
60%
60%
51%
50%
44%
40%
Make Money
20%
37%
31%
29%
20%
Fulfilling Career
Fit and Healthy
Family Time
Source: Nielsen Generational Lifestyle Survey, Q1 2015
39%
36%
29%
28%
39%
32%
19%
21%
11%
10%
3%
Generation Z
Millennials
Generation X
Boomers
Silent Generation
EAT
MILLENNIALS ARE
DISTRACTED, BUT THEY’RE
NOT THE ONLY ONES
Millennials often have a bad reputation
for being constantly connected to their
electronic devices, but it turns out that
larger percentages of older respondents
are more distracted than their younger
counterparts during mealtime.
I eat most of my dinner meals at home while doing something else
Meal Time Distractions
Meal times are NOT technology free
Source: Nielsen Generational Lifestyle Survey, Q1 2015
EAT
TIME AND MONEY MAY
BE IN SHORT SUPPLY, BUT
YOUNGER CONSUMERS
EAT OUT MORE OFTEN
Millennials say they eat out at least
Nearly six-in-10 Millennials (58%) say
they eat out at least once a week, twice
the percentage of Baby Boomers (29%).
And 30% of Millennials eat out three
or more times per week.
twice the percentage of Boomers
Time and money may be in short supply, but younger consumers
46%
58%
44%
29%
26%
Generation Z
Millennials
Generation X
Boomers
Silent Generation
*Those who eat out at least once a week
Source: Nielsen Out-of-Home Dining Habits Survey, Q3 2015
78% 81% 75% 67% 54%
EAT
HEALTH IS A PRIORITY,
BUT THE FOOD
ATTRIBUTES WE SEEK
DIFFER
Consumers of all ages are striving to
lead healthier lives, and many are doing
so by making healthier food choices.
More than half of global respondents
from every generation say they’re willing
to pay a premium for foods with health
benefits, and younger respondents
lead the way. But while certain health
attributes like low sodium and low
sugar appeal to older consumers,
attributes such as organic, gluten
free and high protein appeal more to
younger respondents.
FOODS
WITH BENEFITS
54%
67%
WHO’S WILLING TO PAY MORE?
75%
78%
81%
Silent Generation
Boomers
Generation X
Millennials
Generation Z
DO-GOOD
38%
FOOD
BENEFITS VERY IMPORTANT
IN PURCHASE DECISIONS
Millennials
Boomers
Fair Trade
30%
36%
Organic
33%
34%
High Protein
29%
31%
29%
Portion Control
24%
27%
15%
23%
Source: Nielsen Global Health & Wellness Survey, Q3 2014
Fortification
23%
17%
Caffeine-free
Gluten-free
PLAY
GENERATION Z PICKS
READING AS A TOP
SPARE-TIME ACTIVITY
TV may have universal appeal as a
favorite spare-time activity among all
generations, but among Generation Z,
more respondents selected reading as a
favorite activity than watching TV.
In fact, a higher percentage enjoys
reading than playing video and online
games or reviewing social media.
Other activities, however, have
particular younger or older age skews.
Younger respondents are more likely
to listen to music and play video and
online games, while older respondents
are more likely to enjoy traveling
and gardening.
TOP SPARE-TIME ACTIVITIES
Percentage Who Selected Activity as One of Their Top Three
GENERATION Z
MILLENNIALS
Listen to Music
37%
Read
27%
23%
Watch TV
Connect with
Family/Friends
19%
18%
Exercise
Play Online Games
17%
Review Social Media
17%
Play Video Games
16%
13%
Play Sports
Travel
12%
Shop Online
11%
Cook
Garden
8%
2%
Source: Nielsen Generational Lifestyle Survey, Q1 2015
Watch TV
Connect with Friends/Family
Listen to Music
Read
Travel
31%
28%
27%
20%
18%
GENERATION X
Watch TV
Connect with Friends/Family
Read
Travel
Listen to Music
38%
30%
24%
22%
21%
BOOMERS
Watch TV
Read
Connect with Friends/Family
Travel
Listen to Music
42%
29%
28%
22%
19%
SILENT GENERATION
Read
Watch TV
Connect with Friends/Family
Travel
Garden
42%
40%
29%
25%
22%
WORK
WORK LIFE WAYS
AND WOES
Perhaps our worth is never worthy
enough. More than half across
Millennials, Generation X and Baby
Boomer generations are satisfied with
their occupations, work environment,
co-workers, work/life balance and
boss—and sentiment mostly increases
with age. But less than half are satisfied
with income and other medical,
retirement and savings-plan benefits—
and sentiment largely declines with age.
Thinking about your current job, how
are you with the following:
Millennials
Generation X
Boomers
Occupation (Field of work)
68%
69%
74%
Camaraderie of Co-workers
66%
65%
65%
Work Environment / Setting
59%
60%
65%
Expectations of Boss / Manager / Supervisor
56%
52%
55%
Work / Life Balance
55%
56%
62%
Income / Pay
49%
45%
47%
Corporate Social Responsibility / Sustainability Actions of Employer
49%
44%
44%
Health Care / Medical Benefits
47%
44%
44%
Savings Plan Benefits
44%
34%
29%
Retirement Benefits (Pension)
38%
33%
35%
*Percent completely/somewhat satisfied
Source: Nielsen Generational Lifestyle Survey, Q1 2015
WORK
IS JOB LOYALTY A THING
OF THE PAST?
The days of employees spending their
entire career with the same company
are likely over. Millennials are roughly
two times more likely to leave a job
after two years, 1.5 times more likely
after five years and half as likely to stay
after 10 years, compared to Gen X and
Baby Boomer respondents.
more likely to leave their current jobs
Millennials are
after 2 years compared to Generation X
41%
Millennials
Generation X
21%
Source: Nielsen Generational Lifestyle Survey, Q1 2015
Boomers
26%
WORK
What field of work*
if you could?
DREAM JOBS ALIGN WITH
STATE OF MIND
When considering dream job
aspirations, it turns out that intentions
largely align with generational state of
minds. Among the oldest respondents
(Silent Generation), health-science
professions are tops, while among
those still in the school-age years
(Generation Z), jobs in science,
technology, engineering and math
(STEM) are most wanted. For Baby
Boomers, education and training
careers are highest, while among
those in their prime working years
(Millennials and Generation X),
professions in information technology
are most preferred.
Science
Technology
Engineering
Mathematics
Generation Z
Information
Technology
Millennials
*Career choice with the highest percentage for each generation
Source: Nielsen Generational Lifestyle Survey, Q1 2015
Information
Technology
Generation X
Education &
Training
Boomers
Health
Science
Silent Generation
SAVE
ARE WE “SAVING AND
SOUND” OR “INVESTING,
BUT INSECURE”?
One-third of Generation Z (32%) and
Millennial (34%) respondents are wise
beyond their years when it comes to
saving for their financial futures, but
about half need some help figuring
out what to do with their money, as
they are not confident in their savings
strategies.
Older consumers could use some help,
too. Half of Generation X respondents,
and about four-in-10 Baby Boomers
(41%) and Silent Generation (38%)
respondents are saving some money,
but they are not confident in their
financial futures.
And just over one-third of Baby
Boomers and Silent Generation
respondents do not save at all
for their futures.
SAVING FOR THE FUTURE
I save enough money each month,
and I’m confident in my financial future
I save some money each month,
but I’m not confident in my
financial future
I don’t save any money
each month for my financial future
Generation Z
32%
47%
21%
Millennials
34%
48%
18%
Generation X
23%
50%
27%
Boomers
23%
41%
36%
Silent Generation
28%
38%
34%
Source: Nielsen Generational Lifestyle Survey, Q1 2015
My debt motivates me
to be careful about spending
48%
46%
%
28 31%
%
35
I actively look for ways to lessen
my debt (such as refinancing)
Millennials
Source: Nielsen Generational Lifestyle Survey, Q1 2015
Generation X
I mostly pay in cash
to avoid additional debt
Boomers
Silent Generation
18%
19%
19%
20%
12
While spending strategies for those
with debt varies, nearly half of all
respondents across the four generations
say debt motivates them to be careful
about spending. As we get older, and
presumably closer to the retirement
finish line, we get more serious about
eliminating debt. Baby Boomers are the
most likely to be careful about spending
and take a shorter-term spending strategy
by foregoing the things they want and
need to keep debt down.
Conversely, younger Millennial
respondents are more likely to take a
longer-term view of their debt situation.
They’re the most likely to refinance to
lessen debt. They are also among the
most likely to feel like they must incur
debt to buy the things they want
and need.
29%
57% 48%
32%
%
34 23%
Debt is a fact of life for more than
half of Generation X (58%) and Baby
Boomer (55%) respondents and fourin-10 Millennials and Silent Generation
respondents (44%)—and many are
worried about how they’ll pay the
money owed.
To buy the things I want/need,
I must incur debt
%
THE RACE TO RETIREMENT
My debt prevents me from buying
the things that I want/need
32%
37 3 31%
% 2%
SAVE
DEBT ON THE MIND AFFECTS HOW WE SPEND
Asia-Pacific
COUNTRIES IN THE STUDY
Internet Penetration
AUSTRALIA
CHINA
HONG KONG
INDIA
INDONESIA
JAPAN
MALAYSIA
NEW ZEALAND
PHILIPPINES
SINGAPORE
SOUTH KOREA
TAIWAN
THAILAND
VIETNAM
94%
47%
81%
20%
28%
86%
67%
95%
41%
80%
92%
80%
30%
44%
Latin America
ARGENTINA
BRAZIL
CHILE
COLOMBIA
MEXICO
PERU
VENEZUELA
75%
54%
67%
62%
49%
42%
50%
Source: Internet World Stats, June 30, 2014
Europe
AUSTRIA
BELGIUM
BULGARIA
CROATIA
CZECH REPUBLIC
DENMARK
ESTONIA
FINLAND
FRANCE
GERMANY
GREECE
HUNGARY
IRELAND
ISRAEL
ITALY
LATVIA
LITHUANIA
NETHERLANDS
NORWAY
POLAND
PORTUGAL
ROMANIA
RUSSIA
SERBIA
SLOVAKIA
SLOVENIA
SPAIN
SWEDEN
SWITZERLAND
TURKEY
UNITED KINGDOM
UKRAINE
87%
90%
59%
71%
78%
97%
83%
97%
83%
87%
60%
75%
79%
76%
59%
75%
69%
96%
95%
67%
65%
51%
61%
65%
82%
76%
75%
95%
89%
57%
90%
42%
North America
CANADA
UNITED STATES
95%
87%
Middle East / Africa
EGYPT
PAKISTAN
SAUDI ARABIA
SOUTH AFRICA
UNITED ARAB
EMIRATES
53%
15%
67%
52%
96%
ABOUT THE NIELSEN
GLOBAL SURVEY
ABOUT NIELSEN
The Nielsen Global Survey of Generational Attitudes was conducted Feb. 23 - March 13, 2015 and polled more than 30,000
online consumers in 60 countries throughout Asia-Pacific, Europe, Latin America, the Middle East/Africa and North America.
The sample includes Internet users who agreed to participate in this survey and has quotas based on age and sex for each
country. It is weighted to be representative of Internet consumers by country. Because the sample is based on those who agreed
to participate, no estimates of theoretical sampling error can be calculated. However, a probability sample of equivalent size
would have a margin of error of ±0.6% at the global level. This Nielsen survey is based only on the behavior of respondents
with online access. Internet penetration rates vary by country. Nielsen uses a minimum reporting standard of 60% Internet
penetration or an online population of 10 million for survey inclusion.
Nielsen N.V. (NYSE: NLSN) is a global performance management company that provides a comprehensive understanding
of what consumers Watch and Buy. Nielsen’s Watch segment provides media and advertising clients with Total Audience
measurement services across all devices where content—video, audio and text—is consumed. The Buy segment offers
consumer packaged goods manufacturers and retailers the industry’s only global view of retail performance measurement. By
integrating information from its Watch and Buy segments and other data sources, Nielsen provides its clients with both worldclass measurement, as well as analytics that help improve performance. Nielsen, an S&P 500 company, has operations in over
100 countries that cover more than 90% of the world’s population. For more information, visit www.nielsen.com.