APC308 Financial Management
Bạn đang xem bản rút gọn của tài liệu. Xem và tải ngay bản đầy đủ của tài liệu tại đây (447.83 KB, 18 trang )
APC 308 Financial Management
Nguyen Thi Kieu Anh - ID. 149078874/1
ASSIGNMENT COVER SHEET
UNIVERSITY OF SUNDERLAND
BA (HONS) BANKING AND FINANCE
Student ID: 149078874/1
Student Name: Nguyen Thi Kieu Anh
Module Code: APC 308
Module Name / Title: Financial Management
Centre / College: Banking Academy of Viet Nam
Due Date: 15th May 2015
Hand in Date: 15th May 2015
Assignment Title: Individual assignment
Students Signature: (you must sign this declaring that it is all your own work and all sources of
information have been referenced)
Nguyen Thi Kieu Anh
1
APC 308 Financial Management
Nguyen Thi Kieu Anh - ID. 149078874/1
Financial Management
APC 308
Nguyen Thi Kieu Anh - ID: 149078874/1
Submission date: 15th May 2015
Number of words: 3,500
2
APC 308 Financial Management
Nguyen Thi Kieu Anh - ID. 149078874/1
TABLE OF CONTENTS
Part A: Critically analyse and evaluate whether an optimal capital structure does exist ......... 4
I. Introduction ............................................................................................................................ 4
II. Optimal capital structure: Exist or not?................................................................................. 4
1. David Duran views ............................................................................................................. 4
2. The traditional view ........................................................................................................... 5
3. Modigliani-Miller (MM) views .......................................................................................... 6
3.1 MM without taxes......................................................................................................... 6
3.2 MM with taxes .............................................................................................................. 7
4. Trade-off theory ................................................................................................................. 9
4.1 Static trade-off theory ................................................................................................... 9
4.2 Dynamic trade-off theory ........................................................................................... 10
5. Pecking order theory ........................................................................................................ 11
III. Conclusion ......................................................................................................................... 11
IV. References.......................................................................................................................... 17
Part B: Critically evaluate and analyse the three differing strengths of market efficiency .... 14
I. Introduction .......................................................................................................................... 14
II. Main Body ........................................................................................................................... 14
1. Weak form efficiency ....................................................................................................... 14
2. Semi-strong form efficiency............................................................................................. 15
3. Strong-form efficiency ..................................................................................................... 16
III. Conclusion ......................................................................................................................... 17
IV. References.......................................................................................................................... 17
3
APC 308 Financial Management
Nguyen Thi Kieu Anh - ID. 149078874/1
Part A: Critically analyse and evaluate whether an optimal capital structure does exist
I. Introduction
The capital structure of a firm is the ‘mix of debt and equity financing’ that used to finance its
operations (Brealey et al., 2011, p.418). It is generally believed that the capital structure is an
important area of the financial management as it influences the shareholders’ wealth. In order
to achieve the ultimate goal of financial management - shareholders’ wealth maximization,
financial managers need to strive to determine the optimal mix of debt and equity in the firm’s
capital so that the firm’s value is maximum or the overall cost of capital is minimum.
Nonetheless, whether or not such optimal capital structure exists for individual companies and
businesses still remains a controversial issue in finance. There are two schools of thought on
this. One school supports the existence of the optimal capital structure and other does against
it. Therefore, this study attempts to shed light of this issue with the support of some empirical
findings.
II. Optimal capital structure: Exist or not?
1. David Duran views
In 1952, David Duran propounded two opposing views on the existence of optimal capital
structure, which is Net Income (NI) approach and Net Operating Income (NOI) approach. One
important assumption for these approaches is that there is no tax. According to NI approach,
the cost of equity (KE) and the cost of debt (KD) are independent of each other. Since the cost
of debt (KD) is usually less than the cost of equity (KE), because debt has prior claim on the
firm’s assets and earnings (less risky than equity) (Myers, 2001, p.84), an increase in gearing1
results in reduction of the overall cost of capital (WACC) (Sheeba, 2011, pp.293-294).
Figure 1: Net Income Approach (Sheeba, 2011, p.294)
Under this approach, a firm can reduce the WACC and increase its value by increasing the
proportion of debt in its capital structure to the maximum possible extent. That means the
optimal capital structure would be 100% debt-financed. This approach, therefore, is
1
The proportion of a company’s debt to its equity
4
APC 308 Financial Management
Nguyen Thi Kieu Anh - ID. 149078874/1
considered to be no basis in reality (Saravanan, 2010).
Converse to NI Approach, NOI approach contends that there is no optimal capital structure
for any firm as the proportion of debt and equity in the firm’s capital structure does not have
any impact on the firm’s value or its cost of capital (Sheeba, 2011, p.295).
Figure 2: Net Income Approach (Bhabotosh, 2008, p.200)
The figure illustrates that an increase in the use of cheaper source of debt capital is exactly
offset by an increase in the cost of equity (KE) due to increasing financial risk (shareholders
face higher risk thereby requiring higher return). The overall cost of capital (WACC),
therefore, remains unchanged for all level of gearing. The firm’s value also cannot increase
by debt-equity mix as a result (Bhabotosh, 2008, p.198).
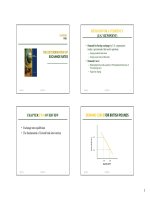
2. The traditional view
Ezra Solomon developed the traditional view2 which lies mid-way between the NI and the
NOI approaches. It holds that there is an optimal capital structure by increasing the debt
proportion in the capital structure to a certain limit (Pandey, 2005, p.316).
Figure 3: The traditional view (ACCA, 2009, p.275)
Look at the graph above, before point X (low gearing), since the proportion of debt in the
capital structure increases within safe limits (either constant or rises slightly), the cost of
equity (KE) rise as the reflection of the increased financial risk, but it does not rise fast
enough to offset the advantage of low-cost debt. Therefore the overall cost of capital
2
Assumptions: No taxes, no transaction costs, net profit are all paid as dividend rather retained
5
APC 308 Financial Management
Nguyen Thi Kieu Anh - ID. 149078874/1
(WACC) initially fall and the firm’s value increase (Khan and Jain, 2006, p. 9.22). After
point X (high gearing), the gearing goes beyond the acceptable limit. Bankruptcy risk causes
the cost of equity curve rise at a steeper rate and also causes the cost of debt to start to rise.
Such thing causes increasing WACC and then decreasing the firm’s value (ACCA, 2009,
p.82). At the point X (critical gearing), when the rising of the marginal cost of borrowing
(KD) is equal to the overall cost of capital (WACC), the firm has reached the optimal capital
structure where the overall cost of capital (WACC) is minimised and the firm’s value is
maximized (Bhabotosh, 2008, p.201).
Horn and Wolinsky (1988) supported traditional view when admitting that a firm could
enhance its market price of shares through the use of reasonable leverage (David et al., 2015,
p.33). However, Pike and Neale (2006, p.479) stated that the critical gearing ratio is thought
to depend on factors such as the steadiness of the company’s cash flow and the saleability of
its assets so the concept of optimal capital structure with the critical gearing ratio is “highly
desirable but illusory and difficult to grasp”. Thus, a firmer theoretical underpinning
regarding the optimal capital structure is really needed to facilitate the capital structure
decision.
3. Modigliani-Miller (MM) views
3.1 MM without taxes
In 1958, Modigliani and Miller advanced a theory which supported the net operating income
approach and rejected the traditional theory of capital structure (Baral, 2004, p.2)
Proposition I
Under supposed conditions of a perfect capital market3, the value of the geared firm (Vg) is
the same as that of the ungeared firm (Vug) due to the existence of arbitrage or switching
process. If the geared firm are priced too much, rational investors will simply borrow on
their personal accounts to buy shares in ungeared firms (known as personal or homemade
gearing) (Ross et al., 2008, p.430). As long as individual investors can borrow at the same
rate of interest as corporations, arbitrage will take place to enable investors to engage in
the personal gearing as against the corporate gearing to restore equilibrium in the market
(Pandey, 2005, p.319). Thus, firm value is not affected by gearing.
3
No taxes, no transaction costs, free information, individual investors can borrow at the same rate of interest as
corporations, no other imperfections
6
APC 308 Financial Management
Nguyen Thi Kieu Anh - ID. 149078874/1
Proposition II
Figure 4: MM model with no taxes (Pandey, 2005, p.322)
Financial gearing causes two opposing effects: it increases the shareholders’ return but it
also increases their financial risk. In case of the ungeared firm, it is not exposed to
financial risk so its cost of equity (Keu) is equal to the WACC. In contrast, the levered firm
will have higher required return on equity as compensation for the financial risk when the
firm gears up. The cost of equity (Keg) will increase enough to offset the advantage of
cheaper source of debt capital (benefits of cheaper debt is equal to increase in Keg) so the
overall cost of capital (WACC) remains constant. Go beyond the NOI approach, MM
argued that in the extreme gearing, the operating risk of shareholders is transferred to debtholders thereby Ke declines and Kd increases as demonstrated in the graph above (Pandey,
2005, pp.321-322). Proposition I and II draw a conclusion that no optimal capital structure
exist.
However, it should be noted that this theory is only valid only if its strict assumptions
regarding a perfect capital market are satisfied. But in fact MM’s assumptions would never
exist in the real world so MM arrived at invalid conclusion. Durand (1959) was the first
financial economist criticized MM model on the ground of this issue. According to Ross et
al. (2008, p.439), Modigliani - Miller themselves also have admitted that real-world
factors may have been left out of the theory. Because of this, Modigliani and Miller (1963)
modified their original zero-tax model to include the tax effect.
3.2 MM with taxes
Proposition I
The previous zero-tax models mentioned that the firm can take advantage of low-cost debt
because the debt is less risky than equity. Now in the world of taxes, the debt further
economizes as it incurs tax advantage (Sheeba, 2011, p.302). The value of the geared firm
7
APC 308 Financial Management
Nguyen Thi Kieu Anh - ID. 149078874/1
is equal to the value of the ungeared firm plus the present value of the tax shield in the
case of perpetual cash flows.
Vg = Vug + t × D
(1)4
Since the tax shield increase with the amount of debt, the firm can raise its value and lower
the WACC by substituting debt for equity (Ross et al., 2008, pp.442-443).
Proposition II
Interest paid on debt is tax deductible so it turns KD into KD (1 - t). The cost of debt is even
cheaper.
Figure 5: MM model with taxes (ACCA, 2009, p.279)
The increasing gearing increase the cost of equity. However, it does not increase as fast as
it increases in the no taxes condition. The increase in the cost of equity is less than the
benefit of interest tax shield on debt (Sheeba, 2011, p.303). Such thing results in declining
in the overall cost of capital (WACC) and increasing the firm’s value. The optimal capital
structure is reached when the firm employs almost 100% debt (Pandey, 2005, p.325).
Unfortunately in practice the firm does not employ extreme level of debt because of tax
advantage. The reason is showed by Miller (1977) that MM model ignored the impact of
personal tax for corporate borrowing. The personal income tax paid by the debt holders on
interest income may completely offset the advantage of interest shield. Besides, some
financial economists also criticised that MM model ignored the financial distress costs
(including bankruptcy cots of debt and agency costs). In the extreme gearing, these costs
may also eliminate benefits of tax shield. Hence, it can be said that MM model actually
overstates the value of gearing (Pandey, 2005, p.325). Even so, despite the criticism of
MM’s framework, MM still stands as a corner of corporate finance because it acts as
4
Vg = the value of a geared firm, Vug: the value of an ungeared firm (no debt), t: the corporate tax rate, D: the
level of debt in the capital structure
8
APC 308 Financial Management
Nguyen Thi Kieu Anh - ID. 149078874/1
paving the way for the development of several theories of capital structure, namely tradeoff theory (Jensen, 2013, p.7).
4. Trade-off theory
Unlike MM theory, the firms should take on as much as debt as possible, trade-off theory
avoids extreme predictions and rationalize moderate debt ratios (Jahan, 2014, p.12).
4.1 Static trade-off theory
Models of static trade-off are connected to the bankruptcy costs and agency costs.
Trade-off models related to bankruptcy costs
This model is presented by Baxter (1967) and Krause and Litzenberger (1973). It suggests
the optimal capital structure exists and is determined by the achievement of balance
between tax benefits and costs of debt (Ghazouani, 2013, p.626).
Figure 6: Static trade off theory of capital structure (Myers, 1984, p.577)
The tax shield increases the value of the geared (levered) firm. Bankruptcy costs lower the
value of the geared (levered) firm. The two offsetting factors produce an optimal amount
of debt as point X in the figure above (Ross et al., 2008, p.465).
Trade-off models related to agency costs
According to Jensen and Meckling (1976), agency costs arise due to conflicts of interest
among management, shareholders and debt-holders. Conflict occurs between management
and shareholders which leads to agency cost of equity. Such conflicts occur when
management’s objectives are not fully aligned with those of shareholders. Since the
company issues debt, conflict arises between debt-holders and shareholders that lead to
agency cost of debt. Such conflict occurs when debt-holders imposes restrictive covenants
on the firm through debt agreement that prevent the manager from investing in high risk
project because the debt-holders do not receive a return which compensates for engaging
9
APC 308 Financial Management
Nguyen Thi Kieu Anh - ID. 149078874/1
in that risky project. Consequently, it prevents the firm’s growth and earnings to
shareholders (Sheeba, 2011, p.306).
Figure 7: Agency costs of debt (Jensen and Meckling,1976, p.55)
A trade-off between the agency costs of equity and the agency costs of debt produce an
optimal capital structure. In other word, the optimal capital structure can be achieved by
finding the point where the total cost of agency costs is minimum (the agency costs of debt
is equal to the agency costs of equity) (Ghazouani, 2013, p.627).
Empirical findings on static trade-off theory conclude mixed results. On one side, many
studies showed that target leverage is not important. For instance, Titman and Wessels
(1988), Raijan & Zingales (1955) and Fama & French (2002) affirmed that higher
profitability firms tend to borrow less that is inconsistent with the actual trade-off
prediction that higher profitability firms should borrow more to reduce tax liabilities.
Graham (2000) estimated the cost and benefit of debt finds that the large and more
profitable firms with low financial distress expectation use the debt conservatively and
Microsoft is an typical example (Jahanzeb et al., 2014, p.13). On the other side, several
studies support trade-off theory and confirm the role of target leverage, namely Marsh
(1982) provided evidence companies appear to make their choice of financing instruments
as if they have target levels of debt in mind. Furthermore, Walsh and Ryan (1997) found
both agency and tax considerations were important in determining debt and equity issues.
But Lasfer (1999) investigated that the relationship between debt and agency costs only
applies to large companies whereas small company debt appears to be driven by
profitability (Beattie et al., 2006, p.6)
4.2 Dynamic trade-off theory
The increasing dissatisfaction of static trade-off theory leads to the birth of dynamic trade-off
theory. It is firstly introduced by the Fischer, Heinkel and Zechner (1989) and further
developed by Strebulaev (2007). It is assumed that the costs of constant capital adjustment
10
APC 308 Financial Management
Nguyen Thi Kieu Anh - ID. 149078874/1
are high and thus firms let their gearing ratios vary within an optimal range instead of specific
optimal point as stated in static trade-off theory. Firms will adjust their gearing only if it
reaches the boundary of the optimal range where benefits exceed costs (Burkhanova et al.,
2012, p.1).
5. Pecking order theory
The pecking order theory is developed by Myers (1984) and Myers and Majluf (1984). They
captured the effect of asymmetric information that arises between managers and investors of
the company upon the mispricing of both debt and equity (Lima, 2009, p.3). To avoid this
problem arising and becomes profitable firms, firms prefer internal funding over external
funding. In case firms require external funding they would prefer debt over equity and equity
is generated as last resort (Sheikh et al., 2012, p.87). Contrary to the trade-off theory, the
pecking order theory has no predictions about the optimal capital structure. Instead its
implications are that the companies will issue or retire debt and equity in accordance to its
funding requirements (Jensen, 2013, p.15).
Empirical evidences surrounding this theory are also mixed. Pecking order theory is
supported by Mullins (1986) and Eckbo (1986) who had shown evidence of adverse selection
relating to equity issues and Fama and French (2000) who found that profitable firms were
less levered as compared to non-profitable firms (Sheikh et al., 2012, p.87). In contrast,
Hamid (1992) and Sigh (1995) stated that in developing countries, there is an inverse pecking
order as corporations rely heavily on external financing, especially stock issues and shortterm finance. Chittenden et al. (1996) also supposed that firms are willing to sell equity when
the market overvalues (David et al., 2015, p.37).
III. Conclusion
Empirical researchers have tried to offer different perspectives and assumptions to prove the
existence or non-existence of capital structure. However, from analysing and evaluating two
schools of thought above, it can be concluded that no theory becomes dominant. Despite of
this, the subjective viewpoint of the author supposed that an optimal capital structure may
exist but a range of optimal capital structure is more likely to exist in practice. A firm can
employ suitable proportion of debt to take advantage of tax shield and less risky financing
source as long as it does not beyond acceptable limit to ensure that the company avoids
financial distress circumstances.
11
APC 308 Financial Management
Nguyen Thi Kieu Anh - ID. 149078874/1
IV. References
ACCA (2009) ACCA Paper F9: Financial Management. London: BPP Learning Media Ltd.
ACCA (2009) Optimum capital: Relevant to ACCA qualification paper F9. Available at:
(Accessed: 09 April 2015).
Baral, K.J. (2004) Determinants of Capital Structure: A Case Study of Listed Companies of
Nepal. The Journal of Nepalese Business Studies, 1(1), pp.1-13
Beattie, V. and Goodacre, A. and Thomson, S.J. (2006) Corporate financing decisions: UK
survey evidence. ournal of Business Finance and Accounting, 33(9-10), pp.1402-1434.
Bhabotosh, B. (2008) Fundamentals of Financial Management. New Delhi: PHI Learning
Private Limited.
Brealey, R. A., Mylers, S. C. and Allen, F. (2011) Principles of Corporate Finance. New
York: McGraw-Hill/Irwin.
Burkhanova, A., Enkov, V. Korotchenko, D. A., Kichkaylo, M. V., Marchenko, K. Y.,
Rozhdestvenskaya, A. L., Smirnova, I. N. and Ulugova, A. E. (2012) Dynamic Trade-off
Theory of Capital Structure: an Overview of Recent Research. Journal Corporate Finance
Research , 3(23), pp.70-86.
David, B., Attipoe, K. K., France, K, O., and Kopodo, B. B. (2015) The Effect of Capital
Structure on profitability of Listed Manufacturing Firms in Ghana.
Durand, D. (1959) The Cost of Capital, Corporation Finance, and the Theory of Investment:
Comment. American Economic Review, 49(4), pp.639-55.
Ghazouani, T. (2013) The Capital Structure through the Trade-Off Theory: Evidence from
Tunisian Firm. International Journal of Economics and Financial Issues , 3(3), pp.625-636.
Jahan, N. (2014) Determinants of Capital Structure of Listed Textile Enterprises of
Bangladesh. Research Journal of Finance and Accounting, 5(20), pp.1-20.
Jahanzeb, A., Rehman, S. U., Bajur, N. H., Karamand, M., and Ahmadimousaabad, A. (2014)
Trade-Off Theory, Pecking Order Theory and Market Timing Theory: A Comprehensive
Review of Capital Structure Theories. International Journal of Management and Commerce
Innovations (IJMCI), 1(1), pp.pp.11-18.
Jensen, M. C., and Meckling, W.H. (1976) Theory of the Firm: Managerial Behaviour,
Agency Costs and Ownership Structure. Journal of Financial Economics, 3(4), pp.305-60.
Jensen, A.W.H. (2013) Determinants of capital structure: An emprical study of danish listed
companies. Aarhus University.
12
APC 308 Financial Management
Nguyen Thi Kieu Anh - ID. 149078874/1
Khan, M. Y and Jain, P. K (2006) Cost Accounting and Financial Management. New Delhi:
McGraw-Hill Publishing Company Limited.
Lima, M. (2009) An Insight into the Capital Structure Determinants of thePharmaceutical
Companies in Bangladesh.
Miller, M.H. (1977) Debt and Taxes. Journal of Finance, 32, pp.261-75.
Myers, S. C. (1984) The capital structure puzzle. Journal of Finance, 34, pp.575-92.
Myers, S.C. (2001) Capital Structure. Journal of Economic Perspectives, 15(2), pp.81-102.
Pandey, I.M., 2005. Financial Management. New Delhi: VIKAS Publishing House Pvt Ltd.
Pike, R. and Neale, B. (2006) Corporate finance and investments: Decisions and strategies.
Harlow: Pearson Education Limited.
Ross, S. A., Westerfield, R. W., Jaffe, J. and Jordan, B. D. (2008) Mordern Financial
Management. New York : Mc. Graw Hill/ Irwin.
Saravanan (2010) Capital Structure Definition. Available at:
(Accessed: 02 April
2015).
Sheeba, K. (2011) Financial Management. India: Dorling Kindersley Pvt. Ltd.
Sheikh, J., Shakeel, A. W., Iqbal, W., and Tahir, M. M. (2012) Pecking at Pecking Order
Theory: Evidence from Pakistan’s Non-financial Sector. Journal of Competitiveness, 4(4),
pp.86-95.
13
APC 308 Financial Management
Nguyen Thi Kieu Anh - ID. 149078874/1
Part B: Critically evaluate and analyse the three differing strengths of market efficiency
I. Introduction
Efficient market hypothesis (EMH) is partly developed by Eugene Fama in 1960s. It states
that the price of a security fully and fairly reflects all available and relevant information so it
is pointless trying to predict trends in the market through fundamental analysis or technical
analysis (Fama, 1970, p.388). Most investors also believed that the securities they are buying
are worth more than the price that they are paying, while securities that they are selling are
worth less than the selling price. But if markets are efficient, actually they are engaging in a
game of chance rather than skills (Karz, 2011). This study will help better understand about
EMH through evaluation and analysis of three differing strengths of market efficiency.
II. Main Body
Three differing strengths of market efficiency include weak form, semi-strong form and
strong form which is divided based on the definition of the available information set.
1. Weak form efficiency
A market is considered as weak form efficient if current prices fully reflect all information
contained in historical prices, which implied that no investor can devise a trading rule based
solely on past price patterns to earn abnormal returns (Poshakwale, 1996, p.605). The future
share price movements depends on new information, since new information arrive at random,
no investor can predict it is good or bad news so share price movements is completely
random. The weak form of EMH was supported through evidence provided in many
empirical studies that focus on the random walk hypothesis (RWH). This random walk
hypothesis asserts that price movements will not follow any patterns or trends and that past
price movements cannot be used to predict future price movements (Karz, 2011). Evidence
supporting the random walk model is the evidence of weak-form efficiency market, but not
vice versa (Ko and Lee, 1991).
Empirical studies of weak form efficiency used serial correlation tests, run tests and filter
tests. Kendall (1953) examined the behaviour of weekly changes in 22 British industrial and
commodity share price indices. The study supported random walk on zero correlation
rationale. Kendall concluded that investors could not make money by watching price
movements. This conclusion had been suggested earlier by Working (1934) through
investigation of small sample (Shamshir and Mustafa, 2014, p.4). Fama (1965) applied serial
correlation test, run test technique to daily data of thirteen individual stocks listed in the
14
APC 308 Financial Management
Nguyen Thi Kieu Anh - ID. 149078874/1
Dow-Jones Industrial Average (DJIA) in the period of 6 years (from 1956 to 1962). He found
a very small positive correlation, which was not statistically different from zero, while the
number of runs was smaller than expected which indicates that the positive correlation found
by the serial correlation test. Both tests show that the independence in successive price
changes in either extremely small or nonexistent (Kiruri, 2009, p.12). Alexander (1961)
applied filter techniques to series of daily closing prices for each of the individual securities
of the Dow-Jones Industrial Average to figure whether the technical trading rule can beat the
buy-and-hold strategy. Alexander’s conclusion is that the results of the filter rule technique
could provide abnormal returns compared with a simple buy and hold strategy; gains were
cancelled out when transaction costs were taken into account (Watson and Head, 2007, p.37).
Hence, it is concluded that all these empirical studies support weak-form efficiency market.
Nonetheless, calendar anomalies produce evidences against weak-form market efficiency.
Some empirical studies showed that stocks have performed better in certain time periods
thereby investors can earn abnormal return. Smirlock & Starks (1986) found that stock have
historically performed better on Fridays than on Mondays (the weekend effect). Studies of
Keim (1983) document the phenomenon of small-company stocks to generate more return
than other asset classes and market in the first two to three weeks of January (January effect)
(Latif et al., 2011, p.6). Abnormal preholiday returns on U.S stocks have been documented by
Merrill (1965) and Fosback (1976) (the holiday effect). For instance, Fosback (1976) reports
high preholiday returns in the S&P 500 index (Kim and Park, 1994, p.145). These anomalies
are difficult to reconcile with the EMH because of it regularity and publicity (Lo, 2015, p.8).
2. Semi-strong form efficiency
Semi-strong form of EMH suggests that current market prices reflect not only past prices but
all other publicly available information as well. If a market is semi-strong form efficient,
stock price will either response immediately with announced news or no response at all
because announced news is not necessary information. Therefore, it is impossible for
investors to achieve excess return by using fundamental and technical analysis (Brigham and
Dave, 2013, p.190). The traditional argument for the semi-strong form efficiency is a timely
and accurate stock price adjustment after key announcement (stock splits, anticipation of
annual reports and mergers and acquisitions…). The research of stock price changes after the
key announcement is known as event studies (Degutis and Novickytė, 2014, p.12). Event
study, undertaken by Fama, Fisher, Jensen and Roll (FFJR 1969), produce useful evidence on
the effects of announced stock splits on stock prices. FFJR concluded that abnormal returns
15
APC 308 Financial Management
Nguyen Thi Kieu Anh - ID. 149078874/1
are flat after month of split and cumulative abnormal returns can be attributed to the fact that
stock splits usually take place following a rise in stock price during ‘good times’. Similar
studies conducted by Ball and Brown (1968) and Rendleman, Jones and Latane (1982) on
dividend and earning announcements generally concluded that only unanticipated
announcements cause significant abnormal returns. The result of Keown and Pinkerton
(1981) showed that the information was already reflected in the share price. These findings
are strongly support semi-strong efficient market (Uh, 2006, p.163). However, there is some
event studies offer evidence of anomalies against semi-strong form efficient market. Beechey
et al. (2000) observed that share prices continue to rise (or fail) for substantial period
following the release of positive (or negative) information. Manganelli (2002) found that the
more frequently a share is traded, the shorter time required for its price to return to
equilibrium having absorbed new information (Watson and Head, 2007, p.38).
3. Strong-form efficiency
Strong form efficient market stated that current prices fully reflect all publicly and privately
information. It means that neither investors relying on generally available information nor
those having access to non-public information can ‘beat the market’ and achieve abnormal
rates of return (Potocki and Świst, 2012, p.160). It is possible to test for strong-form
efficiency directly by investigating the market’s use of insider information as this information
is not publicly available. Tests for strong form efficiency are therefore indirect in approach:
they examine how expert users of information perform when compared against a yardstick
such as the average return on the capital market (Watson and Head, 2007, p.38). One of the
first publications evaluating returns achieved by investment funds was the analysis of 115
investment funds over the years 1954-1964, undertaken by Jensen (1969). The results of the
analysis showed that investment fund almost did not make above-average returns when
investment management fees and expenses were taken into account. Similar results are
showed by Megginson (1997) and Beechey et al. (2000). Nevertheless, Jaffe (1974) produced
contrary results that it is possible to achieve profits superior to the market average by using
non-public information. Koewn and Pinkerton (1981) provided evidence for achieving
abnormal rates of return by insiders before the public announcement of planned mergers.
These results obviously rejected the hypothesis of the strong form efficient market (Potocki
and Świst, 2012, p.160). Whether or not market is strong-form efficient, using insider
information to beat the market obviously is illegal. It is considered as a form of securities
fraud.
16
APC 308 Financial Management
Nguyen Thi Kieu Anh - ID. 149078874/1
Generally speaking, investors are not capable of constantly beating the market as investment
fees, taxes, human emotion working against them; they are more likely to do so through luck.
Peter Lynch and Warren Buffet are exceptionally lucky that have consistently been the
market over long period of time (Fontinelle, 2015).
III. Conclusion
The concept of EMH showed that stock returns are random and investors are unable to earn
abnormal return in such a market. EMH was considered as absolutely truth in the eighties.
However, from analyzing and evaluating of three differing strengths of market efficiency, it
is easy to recognize that EMH fails to explain some anomalies arising in the market so it is
now seen as relative truth.
IV. References
Brigham, E. and Daves, P. (2013) Intermediate Financial Management. 11th edn. USA:
South-Western Cengage Learning, pp. 189-191.
Degutis, A. and Novickytė, L. (2014) 'The efficient market hypothesis: A critical review of
literature and methodology', EKONOMIKA, 93(1), pp.7-23.
Fama, E.F. (1970) 'Efficient capital markets: A review of theory and empirical work', The
Journal of Finance, 25(2), pp.383-417.
Fontinelle, A. (2015) Is it possible to beat the market? Available at:
(Accessed: 24 April
2015).
Karz, G. (2011) The Efficient Market Hypothesis & The Random Walk Theory. Available at:
(Accessed: 22 April 2015).
Kim, C. W and Park, J. (1994) 'Holiday Effects and Stock Returns: Further Evidence', The
Journal of Financial and Quantitative Analysis, 29(1), pp.145-57.
Kiruri, S. (2009) Stock market reactions to macro-economic annoucements in Kenya: A case
of stock prices at the NSE. A management research paper. Business university of Nairobi.
Ko, K. S. and Lee, S. B. A. (1991) 'A comparative analysis of the daily behaviour of stock
return: Japan, the U.S and the Asian NICs', Journal of Business Finance and Accounting,
18(2), pp.219-34.
Latif, M., Arshad, S., Fatima, M. and Farooq, S. (2011) 'Market Efficiency, Market
Anomalies, Causes, Evidences, and Some Behavioral Aspects of Market Anomalies',
Research Journal of Finance and Accounting, 2(9,10), pp.1-13.
17
APC 308 Financial Management
Nguyen Thi Kieu Anh - ID. 149078874/1
Lo, A.W. (2015) Efficient Market Hypothesis. Available at:
(Accessed: 23 April 2015).
Poshakwale, S. (1996) 'Evidence on Weak Form Efficiency and Day of the Week Effect in
the Indian Stock Market', Finance India, 10(3), pp.605-16.
Potocki, T. and Świst, T. (2012) 'Empirical test of the strong form efficiency of the Warsaw
Stock Exchange: The analysis of WIG 20 index shares', South-Eastern Europe Journal of
Economics , 10(2), pp.155-72.
Shamshir, M. and Mustafa, K. (2014) 'Efficiency in stock markets: A review of literature',
International Journal of Economics, Commerce and Management, 2(12), pp.1-22.
Uh, R.S. (2006) Financial Institutions and Services. New York : Nova Science Publishers.
Watson, D. and Head, A. (2007) Corporate Finance: Principles and Practice. Harlow,
England: Pearson Education Limited.
18