GIAO TRINH CHAPTER 7
Bạn đang xem bản rút gọn của tài liệu. Xem và tải ngay bản đầy đủ của tài liệu tại đây (816.49 KB, 46 trang )
Chapter 07
SUBSURFACE MAPPING
AND CROSS SECTION
UA-2011
7.1 SUBSURFACE MAPPING
• INTRODUCTION
• LATERAL CORRELATION OF LOGGED DATA
–
–
–
–
DEFINING SURFACE
USING SURFACES TO DELIMIT UNITS
CONTOUR MAPPING
MECHANICAL & INTERPRETIVE CONTOURING
• STRUCTURAL CONTOUR MAP
• ISOPACH AND OTHER SUBSURFACE MAPS
7.2 CROSS SECTION
• INTRODUCTION
• THE ELEMENTS OF A CROSS SECTION
–
–
–
–
INPUT DATA
LINE OF SECTION
SCALE
DATUM
• THE CONSTRUCTION OF 2-DIMENSIONAL
CROSS SECTIONS
–
–
–
–
STRUCTURAL CROSS SECTIONS
STRATIGRAPHIC CROSS SECTIONS
CORRELATION AND GEOLOGICAL INTERPRETATION
COMPLETING THE CROSS SECTION
• CROSS-SECTION DIAGRAMS IN 3 DIMENSIONS
– FENCE DIAGRAMS
– BLOCK DIAGRAMS
• COMPUTER-DRAWN CROSS SECTIONs
7.1 SUBSURFACE MAPPING
• INTRODUCTION
• LATERAL CORRELATION OF LOGGED DATA
–
–
–
–
DEFINING SURFACE
USING SURFACES TO DELIMIT UNITS
CONTOUR MAPPING
MECHANICAL & INTERPRETIVE CONTOURING
• STRUCTURAL CONTOUR MAP
• ISOPACH AND OTHER SUBSURFACE MAPS
LATERAL CORRELATION OF LOGGED DATA
• Using Data Points to Define Surfaces
Fig 01-Sharp vertical stratigraphic changes are excellent
regional markers
Fig : 02
Fig : 03
……
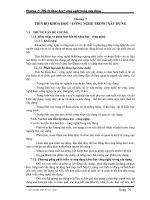
• Using Surfaces to Delimit Units
• Contour Mapping
• Mechanical & Interpretive Contouring
Fig : 04
Fig : 05
800000
700000
900000
Isopach B1
1200000
1200000
15 .1-SD -4X
15 .1-SD -3X
15.1 -SD-1X
15.1-SD-2X
15 .1-SC-1X
01- B - 1X 0 1- R - 1X
0 1- B - 2 X
1 5.1-SV-1X
01- P - 1X
15.1-ST-3X
15.1-ST-2X
15.2-G D-1X
15. 2-VD -2X
15 .2-P D-1X
15.2-VD -1X
15.2-RD-1X
1 6.1-TG T-2X
15 .2-RD-2X 15. 2-R D-3X
16.1 -TGT-1X
1100000
16.1-VT-1X
02- M - 1X
15. 2-R D-4X
16.1-TGT-3X
16.1-VT-2X
1100000
0 9.2- CNV - 2XA
16 .1-BV-1X
BH - 10
16.1-NO-1X
16.1 -VV-1X
0 2- C - 1X
16. 1-TGV-1 X
0 9.2- CNV - 1X
09.2- COD - 1X
BH - 9
BH - 5
16-BD-1X
16 -TD-1X
16.2 -BG-1X
09 .3- SOI - 2X
17 - C -1X
09.3- SOI - 1X
09.3 -DM-1X
17 - N -1X
17 - DD -1X
1 7 - VT -1X
1000000
1000000
700000
800000
900000
800000
700000
900000
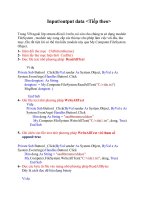
Isopach C
1200000
1200000
15.1-SD-3X
15.1-SD -4 X
15. 1-SD-2X
15.1 -SD-1X
0 1- R - 1X
15. 1-SC-1X
01- B - 2X
01- B - 1X
15 .1-SV-1X
01- P - 1X
15.1-ST-3X
02- C - 1X
15.1 -ST-2X
15.2-GD-1X
15 .2-VD-2X
15.2 -P D-1X
15.2 -VD-1 X
15.2-RD-1X
16.1-TGT-2 X
15.2-RD-2 X
1 6.1-TGT-1X
1100000
15.2-RD-3X
0 2- M - 1X
1100000
15.2-RD-4 X
16.1-TGT-3X
16 .1-VT-1X
1 6.1-VT-2X
09.2- CNV - 2XA
16.1 -BV-1X
16.1-VV-1X
BH - 1 0
16.1 -NO-1X
0 9.2- CNV - 1X
09.2- COD - 1 X
BH - 9
16 .1-TGT-1X
BH - 5
16-BD-1X
16 -TD-1X
16.2 -BG-1X
0 9.3- SOI - 2X
09.3 - SOI - 1X
17 - C -1X
17 - N -1X
17 - DD -1X
09.3- DM - 1X
17 - VT -1X
1000000
1000000
700000
800000
900000
7.2 CROSS SECTION
• INTRODUCTION
• THE ELEMENTS OF A CROSS SECTION
–
–
–
–
INPUT DATA
LINE OF SECTION
SCALE
DATUM
• THE CONSTRUCTION OF 2-DIMENSIONAL
CROSS SECTIONS
–
–
–
–
STRUCTURAL CROSS SECTIONS
STRATIGRAPHIC CROSS SECTIONS
CORRELATION AND GEOLOGICAL INTERPRETATION
COMPLETING THE CROSS SECTION
• CROSS-SECTION DIAGRAMS IN 3 DIMENSIONS
– FENCE DIAGRAMS
– BLOCK DIAGRAMS
• COMPUTER-DRAWN CROSS SECTIONs
INTRODUCTION
Definition: A cross section is a profile showing
geological features in a vertical plane through the
earth
There are two categories of cross sections:
structural and stratigraphic.
Structural cross sections illustrate presentday structural features such as dips, folds, and faults.
Stratigraphic cross sections show
characteristics such as formation thicknesses,
lithologic sequences, stratigraphic correlations, facies
changes, unconformities, fossil zones, and ages.
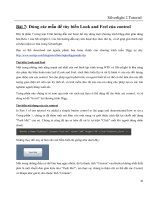
Cross sections are also useful for
display purposes. Diagrammatic cross
sections show broad relationships
and serve to orient the audience to
the general geology of a region (Fig:
06)
Fig : 06
7.2 CROSS SECTION
• INTRODUCTION
• THE ELEMENTS OF A CROSS SECTION
–
–
–
–
INPUT DATA
LINE OF SECTION
SCALE
DATUM
• THE CONSTRUCTION OF 2-DIMENSIONAL
CROSS SECTIONS
–
–
–
–
STRUCTURAL CROSS SECTIONS
STRATIGRAPHIC CROSS SECTIONS
CORRELATION AND GEOLOGICAL INTERPRETATION
COMPLETING THE CROSS SECTION
• CROSS-SECTION DIAGRAMS IN 3 DIMENSIONS
– FENCE DIAGRAMS
– BLOCK DIAGRAMS
• COMPUTER-DRAWN CROSS SECTIONs
• Input Data
Different types of data can be used in
developing a cross section. The
diagram may be based on outcrop
information, or on subsurface data
derived from wells and geophysical
surveys, or it may use both outcrop
and subsurface data.
• Outcrop information are particularly
useful in frontier areas of petroleum
exploration, where subsurface
information is often sparse or
unavailable.
• Many geological cross sections made for
petroleum exploration rely on subsurface
data.
• The geologist should recorrelate all logs
to ensure accuracy and consistency.
Fig : 07
Distortion of true thickness (t) and true dip (d) measurements
due to borehole deviation; tA= apparent thickness and dA=
apparent dip.
Fig : 08
Segments of the borehole which do not lie in the plane of section
are dashed onto the cross sections. Due to foreshortening, the
dashed segments show only apparent deviation. This can be
seen by comparison with the inset plan view
• Line of Section
After gathering available data, the next
in cross section development step is
to choose the line of section, i.e., the
line along which the cross section
would intersect the surface of the
earth (Fig 08)
Cross sections may trend perpendicular
to strike, oblique (uốn theo) to strike,
or parallel to strike (Fig 09)