Bài giảng kinh tế vi mô chap2 premium
Bạn đang xem bản rút gọn của tài liệu. Xem và tải ngay bản đầy đủ của tài liệu tại đây (563.41 KB, 40 trang )
2
Thinking Like An Economist
PRINCIPLES OF
FOURTH EDITION
N. G R E G O R Y M A N K I W
PowerPoint® Slides
by Ron Cronovich
© 2007 Thomson South-Western, all rights reserved
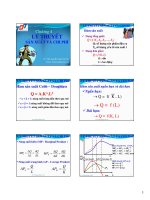
In this chapter, look for the answers to
these questions:
What are economists’ two roles? How do they differ?
What are models? How do economists use models?
What are the elements of the Circular-Flow Diagram?
What concepts does this diagram illustrate?
How is the Production Possibilities Frontier related
to opportunity cost? What other concepts does it
illustrate?
What is the difference between microeconomics and
macroeconomics? Between positive and normative?
CHAPTER 2
THINKING LIKE AN ECONOMIST
2
The Economist as Scientist
Economists play two roles:
• Scientists: try to explain the world
• Policy advisors: try to improve it
In the first role, economists employ the
scientific method: the dispassionate
development and testing of theories about
how the world works.
CHAPTER 2
THINKING LIKE AN ECONOMIST
3
Assumptions & Models
Assumptions simplify the complex world,
make it easier to understand.
Example: When studying international trade,
we might assume the world consists of
two countries and two goods.
Very unrealistic, but simplifies the problem
and yields useful insights about the more
complicated real world.
Economists use models to study economic
issues. A model is a highly simplified
representation of a more complicated reality.
CHAPTER 2
THINKING LIKE AN ECONOMIST
4
Some Familiar Models
A road map
CHAPTER 2
THINKING LIKE AN ECONOMIST
5
Some Familiar Models
A model of human
anatomy from high
school biology class
CHAPTER 2
THINKING LIKE AN ECONOMIST
6
Some Familiar Models
A model airplane
CHAPTER 2
THINKING LIKE AN ECONOMIST
7
Some Familiar Models
The model teeth at the
dentist’s office
CHAPTER 2
THINKING LIKE AN ECONOMIST
Don’t forget
to floss!
8
Our First Model:
Diagram
The Circular-Flow
The Circular-Flow Diagram: A visual model of
the economy, shows how dollars flow through
markets among households and firms.
Includes two types of “actors”:
• households
• firms
Includes two markets:
• the market for goods and services
• the market for “factors of production”
CHAPTER 2
THINKING LIKE AN ECONOMIST
9
Factors of Production
The factors of production are the resources
that the economy uses to produce goods &
services. They include:
• labor
• land
• capital (buildings & machines used in
production)
CHAPTER 2
THINKING LIKE AN ECONOMIST
10
FIGURE 1: The Circular-Flow Diagram
Households:
Households:
own
own the
the factors
factors of
of production,
production,
sell/rent
sell/rent them
them to
to firms
firms for
for income
income
buy
buy and
and consume
consume goods
goods &
& services
services
Firms
CHAPTER 2
Households
THINKING LIKE AN ECONOMIST
11
FIGURE 1: The Circular-Flow Diagram
Firms
Households
Firms:
Firms:
buy/hire
buy/hire factors
factors of
of production,
production,
use
use them
them to
to produce
produce goods
goods
and
and services
services
CHAPTER
sell
&
2 THINKING
LIKE AN ECONOMIST
sell goods
goods
& services
services
12
FIGURE 1: The Circular-Flow Diagram
Revenue
G&S
sold
Markets for
Goods &
Services
Firms
G&S
bought
Households
Factors of
production
Wages, rent,
profit
CHAPTER 2
Spending
Markets for
Factors of
Production
THINKING LIKE AN ECONOMIST
Labor, land,
capital
Income
13
Our Second Model:
The Production
Possibilities Frontier
The Production Possibilities Frontier (PPF):
A graph that shows the combinations of
two goods the economy can possibly produce
given the available resources and the available
technology.
Example:
• Two goods: computers and wheat
• One resource: labor (measured in hours)
• Economy has 50,000 labor hours per month
available for production.
CHAPTER 2
THINKING LIKE AN ECONOMIST
14
PPF Example
Producing one computer requires 100 hours labor.
Producing one ton of wheat requires 10 hours labor.
Employment of
labor hours
Production
Computers
Wheat
Computers
Wheat
A
50,000
0
500
0
B
40,000
10,000
400
1,000
C
25,000
25,000
250
2,500
D
10,000
40,000
100
4,000
E
0
50,000
0
5,000
PPF Example
Production
Point
on
Comgraph puters Wheat
A
500
0
B
400
1,000
C
250
2,500
D
100
4,000
E
0
5,000
CHAPTER 2
E
D
THINKING LIKE AN ECONOMIST
C
B
A
16
ACTIVE LEARNING
Points on the PPF
1:
A. On the graph, find the point that represents
(100 computers, 3000 tons of wheat), label it F.
Would it be possible for the economy to produce
this combination of the two goods?
Why or why not?
B. Next, find the point that represents
(300 computers, 3500 tons of wheat), label it G.
Would it be possible for the economy to produce
this combination of the two goods?
17
ACTIVE LEARNING
Answers
1:
Point F:
100 computers,
3000 tons wheat
Point F requires
40,000 hours
of labor.
Possible but
not efficient:
could get more
of either good
w/o sacrificing
any of the other.
F
18
ACTIVE LEARNING
Answers
1:
Point G:
300 computers,
3500 tons wheat
Point G requires
65,000 hours
of labor.
Not possible
because
economy
only has
50,000 hours.
G
19
The PPF: What We Know So Far
Points on the PPF (like A – E)
• possible
• efficient: all resources are fully utilized
Points under the PPF (like F)
• possible
• not efficient: some resources underutilized
(e.g., workers unemployed, factories idle)
Points above the PPF (like G)
• not possible
CHAPTER 2
THINKING LIKE AN ECONOMIST
20
The PPF and Opportunity Cost
Recall: The opportunity cost of an item
is what must be given up to obtain that item.
Moving along a PPF involves shifting resources
(e.g., labor) from the production of one good to
the other.
Society faces a tradeoff: Getting more of one
good requires sacrificing some of the other.
The slope of the PPF tells you the opportunity
cost of one good in terms of the other.
CHAPTER 2
THINKING LIKE AN ECONOMIST
21
The PPF and Opportunity Cost
slope =
–1000
= –10
100
The slope of a line
equals the “rise
over the run” –
the amount the line
rises when you
move to the right
by one unit.
Here, the
opportunity cost of
a computer is
10 tons of wheat.
CHAPTER 2
THINKING LIKE AN ECONOMIST
22
A C T I V E L E A R N I N G 2:
PPF and Opportunity Cost
In which country is the opportunity cost of cloth lower?
FRANCE
ENGLAND
23
A C T I V E L E A R N I N G 2:
Answers
England, because its PPF is not as steep as France’s.
FRANCE
ENGLAND
24
Economic Growth and the PPF
With additional
resources or an
improvement in
technology,
the economy can
produce more
computers,
more wheat,
Economic
Economic
growth
growth shifts
shifts
the
the PPF
PPF
outward.
outward.
or any combination
in between.
CHAPTER 2
THINKING LIKE AN ECONOMIST
25