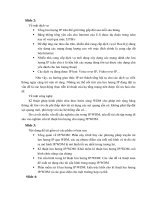
veg fruit presentation
Bạn đang xem bản rút gọn của tài liệu. Xem và tải ngay bản đầy đủ của tài liệu tại đây (344.46 KB, 44 trang )
CPHN
Presenting Nutrition Series
‘Report on the consumption of
vegetables and fruit
in NSW : 2003’
Authors:
Debra Hector
Liz Story
Vicki Flood
Presenting Nutrition Series
Introduction for Users
o The presentations are designed to assist professionals throughout
NSW disseminate information on public health nutrition
o Each presentation is based on an existing CPHN report
o Users are requested to provide full acknowledgement of the authors,
CPHN and the Department of Health
o Notes version of the ppt gives table/figure and page numbers, for easy
reference to the report
o Further information and explanation of each slide should be sought
from the report. Visit
o Users should use Excel to prepare slides with data for other areas,
modelled on the sample provided
o Any questions can be referred to Lesley King on 02 9351 8015.
The Report
•
•
•
•
•
Rationale for the promotion of fruit and
vegetable consumption
Risks and burden of disease associated with
low consumption
Recommended levels of consumption
Current levels of consumption of V & F in NSW
Recommendations for monitoring V & F
consumption in NSW
Conceptual framework
for monitoring
vegetables & fruit
consumption
Dietrelated
diseases/
conditions
Biomedical risk factors
Nutrient intakes
Food and supplement
consumption habits
Food purchasing / acquisition
F&N–related ‘literacy’ (knowledge, attitudes, beliefs)
Food supply / community access
Food / nutrition policy and action
Adapted from: Webb K in Marks et al Monitoring food habits in the Australian population using short questions 2001
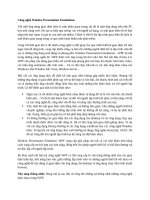
Association between V & F Intake and
Chronic Disease – Evaluation of the Evidence
Disease
Strength of Evidence
Assessment of Evidence
Neural Tube Birth Defects
Substantial, proven
Proven
Cancer – number of sites
Substantial, growing
Extremely convincing
Cardiovascular diseases
Substantial, growing
Very convincing
Diverticulosis
Strong
Convincing
Cataracts/Macular Disease
Growing
Convincing
Type 2 Diabetes
Mixed, Indirect
Convincing
Stroke
Limited, Building
Becoming convincing
Hypertension
Limited
Suggestive
COPD
New
Suggestive
Overweight and Obesity
Sparse, Indirect
Convincing as part of
treatment/prevention
Source: 5+A Day New Zealand
Protective effects of eating vegetables
and fruit …
the MORE the better
the more VARIETY the better
consume WHOLE
vegetables and fruit
the EARLIER the better
Recommended Intakes for Protective
Effects
Quantity and Variety
Exposure period
Dose-Response
↑intake ↓risk
High consumption of V & F
should begin in childhood
‘Extra 50g vegs and fruit
each day could cut risk of
premature death by 20%’
(EPIC)
‘Women consuming at least
2.5 serves daily of V & F as
adolescents were 46% less
likely to develop ovarian
cancer’ (Fairfield et al, 2001)
Burden of Disease
Burden of disease is the amount of ill health
and disability attributable to a given factor
‘Inadequate intake of vegetables and
fruit accounts for around 3% of the total
burden of disease in Australia*’ (Mathers
et al 2000)
*compared to 2% from alcohol and 10% from tobacco – note,
3% is very likely to be an underestimate of the true burden of
disease related to inadequate vegetable and fruit consumption
Burden of disease attributable to
inadequate V & F consumption,
Australia, 1995
Persons
Number
Deaths
YLL
YLD
DALYs
Per Cent
4 057
3.2
55 963
4.2
12 114
1.0
98 077
2.7
Source: AIHW 1999(Mathers et al 2000)
Most of the burden of disease is attributable to cancers
and cardiovascular disease
Burden of cancer related to inadequate
V & F consumption
(in Australia, 1995)
Inadequate V & F consumption accounts for 11% of the total
cancer burden
Low V intake (<4 serves/day) accounts for 17% of risk of
colorectal cancer, 9% lung and prostate cancer, 2% breast
cancer (Marks et al 2001)
Total health care costs associated with low consumption of
vegetables for these 4 cancers is $59 million per year
Increasing average V intake by one serve/day
would potentially save the health care system
$24 million/year for cancer treatment costs alone
Consumption Recommendations
Australian Dietary Guidelines 2003
(children, adolescents, adults and older people)
‘Eat plenty of …. vegetables
(including legumes) and fruit’
Minimum daily serves:
5 vegetables and 2 fruit
Consumption Recommendations
Australian Guide to Healthy Eating
– how many serves?
Vegetables
Adults
Children (4-7 yrs)
Children (8-11yrs)
Adolescents (12-18yrs)
4-8
2-4
3-5
4-9
Fruit
2-4
1-2
1-2
3-4
Note - AGHE includes fruit juice and potatoes as part of the
recommended serves, some other guides exclude these items
How much do we eat?
Two main surveys in the last decade:
• National Nutrition Survey,1995 (n=2881for NSW)
– 24 hr recall, FFQ and short questions
• NSW Health Surveys (1997/1998 in this report)
– Short questions (n=35,025 adults in 97/98)
Usual consumption of VEGETABLES by
FEMALES - results of 2 surveys
NNS 1995 and NSW HS 1997/98
70
56.6
60
%
NSW HS
47.6
50
40
30
NNS
31.2
22.1
22.2
21.2
20
10
0
1 or less
2-3 serves
Number of serves
4 or more
Usual consumption of VEGETABLES by
MALES - results of 2 surveys
NNS 1995 and NSW HS 1997/98
70
57.3
60
%
50
42.4
NNS
NSW HS
40.7
40
30
28.5
20
13.3
16.9
10
0
1 or less
2-3 serves
Number of serves
4 or more
70
Usual consumption of FRUIT by FEMALES
- results of 2 surveys
NNS 1995 (NSW) and NSW HS 1997/98
NNS
60
%
50
43.0
48.4
49.3
NSW HS
44.7
40
30
20
7.5
10
7.0
0
1 or less
2-3 serves
Number of serves
4 or more
Usual consumption of FRUIT by MALES results of 2 surveys
NNS 1995 (NSW) and NSW HS 1997/98
70
60
57.6
60.5
NNS
NSW HS
%
50
35.4
40
32.2
30
20
6.3
10
7.3
0
1 or less
2-3 serves
Number of serves
4 or more
Proportion of adult MALES consuming
serves of VEGETABLES (per day) in NSW,
by AGE (NSW HS 1997/98)
40
All
% consuming
35
18-24
30
25-34
25
35-44
20
45-54
15
55-64
10
65-74
5
75+
0
<1
1<2
2<3
3<4
number of serves
4<5
5+
40
Proportion of adult FEMALES consuming
serves of VEGETABLES (per day) in NSW, by
age (NSW HS 1997/98)
All
% consuming
35
18-24
30
25-34
25
35-44
20
45-54
15
55-64
10
65-74
5
75+
0
<1
1<2
2<3
3<4
number of serves
4<5
5+
Proportion of adult MALES consuming
serves of FRUIT (per day) in NSW, by age
(NSW HS 1997/98)
40
All
% consuming
35
18-24
30
25-34
25
35-44
20
45-54
15
55-64
10
65-74
5
75+
0
<1
1<2
2<3
number of serves
3<4
4<5
Proportion of adult FEMALES consuming
serves (per day) of FRUIT in NSW, by age
(NSW HS 1997/98)
% consuming
45
40
35
All
30
25-34
25
20
35-44
15
55-64
10
5
65-74
18-24
45-54
75+
0
<1
1<2
2<3
number of serves
3<4
4<5
Mean serves of VEGETABLES consumed by
male and female adults in NSW, by age
(NSW HS 1997/98)
3.5
Mean number of serves
3.0
2.9
2.7
2.5
2.5
2.5
2.3
2.2
2.0
2.0
2.1
2.0
2.4
2.7
2.4
2.5
2.4 2.4
2.1
Males
Females
1.5
1.0
0.5
0.0
All
18-24
25-34
35-44
45-54
Age (years)
55-64
65-74
75+
Mean serves of FRUIT consumed by male and
female adults in NSW, by age
(NSW HS 1997/98)
Mean number of serves
2.5
2.0
1.9
1.8
1.6
1.6 1.6
1.5
1.6
1.4
1.7
1.5
1.6
1.9
1.6
1.9
1.7
1.9
1.7
Males
Females
1.0
0.5
0.0
All
18-24
25-34
35-44
45-54
Age (years)
55-64
65-74
75+
VEGETABLE consumption in Central Coast AHS
compared to NSW overall (NSW HS 1997/98)
40
35
% consuming
30
CC Males
NSW Males
CC females
NSW females
25
20
15
10
5
0
<1
1<2
2<3
3<4
Number of serves
4<5
5+
FRUIT consumption in Central Coast AHS
compared to NSW overall (NSW HS 1997/98)
40
% consuming
35
30
CC Males
NSW Males
CC females
NSW females
25
20
15
10
5
0
<1
1<2
2<3
3<4
Number of serves
4+