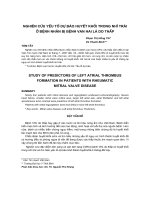
Xơ vữa tân sinh và huyết khối trong stent
Bạn đang xem bản rút gọn của tài liệu. Xem và tải ngay bản đầy đủ của tài liệu tại đây (4.45 MB, 66 trang )
Natural History
of Neoatherosclerosis
In-Stent “Neoatherosclerosis” Is
A Final Common Pathway
of Late Stent Failure
Seung-Jung Park, MD, PhD
Professor of Medicine, University of Ulsan College of Medicine,
Heart Institute, Asan Medical Center, Seoul, Korea
Natural Healing
after BMS Implantation
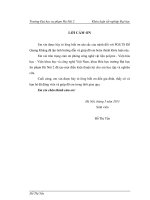
3-Phasic Luminal Response in BMS
Complete Serial Follow-up (131 pts, 7-10 years)
Intermediate-term
Regression
MLD, mm
4.0
2.62±0.40
3.0
2.19±0.49
2.0
1.85±0.56
2.00±0.49
1.0
1.0±0.38
Pre
Post-PCI
p<0.001
p<0.001
6 mo
3 yr
Early
Restenotic Phase
Beyond 4 yr
Late Progression
Neoatherosclerosis
Kimura et al. N Engl J Med 1996;334:561-6, Kimura et al. Circulation 2002;105:2986-91
Pathologic Validation
Of 3 Different Response
3-Phasic Luminal Response in BMS
Complete Serial Follow-up (131 pts, 7-10 years)
MLD, mm
4.0
2.62±0.40
3.0
2.19±0.49
2.0
1.85±0.56
2.00±0.49
1.0
1.0±0.38
Pre
Post-PCI
6 mo
3 yr
Early
Restenotic Phase
Kimura et al. N Engl J Med 1996;334:561-6
Kimura et al. Circulation 2002;105:2986-91
Beyond 4 yr
Early Restenotic Phase
Healing Over Time (<6months)
Smooth muscle cells and Matrix deposition
macrophages
Movat pentachrome stain
Smooth muscle cells
a-actin positive
Thrombus
and Fibrin deposition
Acute
Inflammation
Granulation
Tissue response
Courtesy of Renu Vermani, MD
3-Phasic Luminal Response in BMS
Complete Serial Follow-up (131 pts, 7-10 years)
Intermediate-term
Regression
MLD, mm
4.0
2.62±0.40
3.0
2.19±0.49
2.0
1.85±0.56
2.00±0.49
1.0
1.0±0.38
Pre
Post-PCI
Kimura et al. N Engl J Med 1996;334:561-6
Kimura et al. Circulation 2002;105:2986-91
p<0.001
p<0.001
6 mo
3 yr
Beyond 4 yr
Intermediate Regression
Healing Over Time (6mo- 3 yrs)
Smooth
Muscle Cell
α-Actin
Contents of Extracellular Matrix
Versican
Hyaluronan
Biglycan
Decorin
Type III collagen
3 mos
18 mos
The component of intimal hyperplasia is
changed, which leads to neointimal thinning
and increased MLD.
48 mos
Type I
Decreased
Cellularity
Reduced
Increased
Farb A et al, Circulation, 2004;110:940-947
Replaced
3-Phasic Luminal Response in BMS
Complete Serial Follow-up (131 pts, 7-10 years)
MLD, mm
4.0
2.62±0.40
3.0
2.19±0.49
2.0
1.85±0.56
2.00±0.49
1.0
1.0±0.38
Pre
Post-PCI
p<0.001
p<0.001
6 mo
3 yr
Beyond 4 yr
Late Progression ;
Neoatherosclerosis begin.
Kimura et al. N Engl J Med 1996;334:561-6
Kimura et al. Circulation 2002;105:2986-91
Late Progression
Neoatherosclerosis Began,
Late Progression (>3 yrs)
Early Neoatherosclerosis began,
Pathologic Intimal
Thickening (PIT)
Progressive
Early Fibroatheroma
Early Necrotic Core
CD68 (Macrophage)
Neoatherosclerosis began with
peri-strut foamy macrophage infiltration
with or without calcification.
Courtesy of Renu Vermani, MD
Late Progression (>3 yrs)
Advanced Neoatherosclerosis
5 years after BMS
Ruptures with Thrombosis
in the Neointima.
Thin Cap Fibroatheroma
(TCFA)
CD68 (Macrophage)
Late Necrotic Core
Macrophage Cluster
Nakazawa G et al, JACC, 2011;57:1314-1322
OCT Findings of BMS-ISR
at 10 Years Median F/U time 11 years (9–14)
(%)
100
90
80
70
60
50
40
30
20
10
0
Lipidic Calcium TCFA Rupture Thrombi All*
* All of TCFA, rupture, thrombi
AMC data
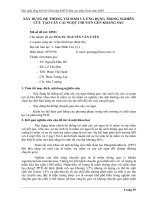
What is the
In-Stent Neoatherosclerosis ?
1.
2.
3.
Newly Developed Atherosclerotic Progression
Inside of Stent.
It began from Macrophage infiltration,
Progressed to Advanced Vulnerable Plaques.
Its Progression was Related to Late Clinical
Presentation from Stable to Acute Coronary
Syndrome.
Natural Healing
after DES Implantation
Angiographic Serial Changes
of MLD After DES at 2 Year
mm
5.0
P<0.0001
MLD
4.0
P<0.0001
3.0
2.0
P < 0.0001
Among 3 groups
2.59
2.41
2.26
1.0
Value was presented as median,
P by Friedman among 3 groups,
P by Wilcoxon between 2 groups
0
PostProcedure
6-Mo
2-Yr
Park SJ et al. Inter J of Cardiol. 2011 Dec;153(2):159-164.
Serial Changes
in %IH Volume Over 2 Years
25
* 6 months vs. 2 years
%IH volume (%)
20
15
*p=0.049
10
*p=0.010
5
*p=0.046
PES
0
-5
Post-stenting
All lesions
6 Mo
2 Yr
Kang et al. Am J Cardiol 2010;105:1402-8
SES
Independent Predictors
for Intimal Hyperplasia
%IH volume at 6 Mo
PES
ß=0.42, p<0.001
95% CI 4.1-8.8
PES
ß=0.36, p<0.001
95% CI=3.7-9.7
Post-stenting
plaque volume
ß=0.19, p=0.020
95% CI=0.1-1.6
Post-stenting
plaque volume
ß=0.26, p=0.002
95% CI=0.2-0.8
%IH volume at 2 yrs
Late change in %IH
volume (6 Mo-2 yrs)
Kang et al. Am J Cardiol 2010;105:1402-8
What’s the Difference in
Instent Neoatherosclesis Between
BMS and DES ?
Angioscopic Validation of
Neoatherosclerosis In BMS and DES
Late Progression ;
Angioscopic Observation
Healing Over Time (>4 yrs) after BMS
Late luminal narrowing (%) is increased and
The segments with yellow plaque is increased.
18.4%
3.6%
Yokoyama S et al. Circ Cardiovasc Interv 2009;2:205-212
Atherosclerotic Transformation
of Neointima after BMS implantation
First Follow-Up ; 6-12 months, Second Follow-Up ; > 4 years
Yokoyama S et al. Circ Cardiovasc Interv 2009;2:205-212
Angioscopic Observation of Serial Changes
After DES at 10 months
1.9
1.4
Increased Yellow Color Grade
Higo et al. JACC Cardiovasc Imaging 2009;2:616-24
Prevalence of Thrombus
Prevalence of Thrombus (%)
After DES at 10 months
30
*
* P<0.01 vs. white
25
20
15
14/55
10
5
0
3/57
Yellow
White
Higo et al. JACC Cardiovasc Imaging 2009;2:616-24
Pathologic Validation of
Neoatherosclerosis In BMS and DES