Xây dựng và phát tiển chiến lược tai công ty cổ phần phân đạm và hóa chất hà bắc
Bạn đang xem bản rút gọn của tài liệu. Xem và tải ngay bản đầy đủ của tài liệu tại đây (807.46 KB, 88 trang )
LUẬN VĂN
Xây dựng và phát tiển chiến lược tai công ty cổ phần Phân đạm và Hóa chất
Hà Bắc
MBA THESIS
DEVELOPMENT STRATEGY FORMULATION OF
HABAC NITROGENOUS FERTILIZER AND
CHEMICAL COMPANY LIMITED (HANICHEMCO)
2011-2020
LIST OF FIGURES
LIST OF FIGURES ii
LIST OF TABLES v
A. INTRODUCTION 1
B. DEVELOPMENT 5
Figure 1.1: The strategic management process 6
Table 1.1: SWOT Matrix 7
Figure 1.2: The External Environment 8
Table 1.2: The general Environment: Segments and Elements 9
Figure 1.3: The 5 force model of M.E. Porter 10
Figure 1.4: Competitor analysis components 12
Figure 1.5: External analyses’ outcomes 13
Table 1.3: Tangible resources 14
Table 1.4: Intangible resources 15
Figure 1.6: Types of business-level strategies 16
Table 1.5: GREAT model 19
Figure 2.1: Top 10 Countries in the 2009 Global Retail Development Index 21
Table 2.1: Selected Economic Indicators of Vietnam 22
Figure 2.2: Internet usage of Vietnam 23
Table 2.3: Forecast of Domestic Demand for Urea by 2015 30
Table 2.4: Capacity of Domestic Fertilizer Manufacturers 31
Figure 2.3: Urea distribution system of HANICHEMCO 31
(Source: Hanichemco’s Third-quarter Sale and Marketing Department report,
p23, 2009) 32
Table 2.5: Urea consumed amount of HANICHEMCO from 2006 to 2008 32
(Source: Hanichemco’s Third-quarter Sale and Marketing Department report,
p24, 2009) 32
Table 2.6: The amount of coal purchased from 2005 to 2008 34
35
ii
Figure 2.4: Coal price (without VAT) between 2005 ÷ 2008 35
Table 2.7: Coal product types 37
Table 2.8: World urea output 38
Table 2.9: Urea price comparison between Ha Bac and Phu My Fertilizer
Company (DPM) 40
Table 2.10: Assessing strengths and weaknesses compared to competitors 41
Table 2.11: Quantity of imported DAP fertilizer in Vietnam from 2003 to 2008 42
Figure 2.5: Organization structure 46
Table 2.12: Operating results of HANICHEMCO from 2005 to 2008 47
Figure 2.6: HANICHEMC’s Revenue and Profits from 2005 to 2008 47
Table 2.13: Quantitative matrix with GREAT criteria 63
Table 3.1: Expected production scales of HANICHEMCO 68
All in all, Hanichemco’s total productivity generated from both current and new
production lines will be 300,000 tons of liquid NH3 and 500,000 tons Urea. 68
Figure 3.1: Waste Treatment system 70
As presented above, most of the tail gases have been taken full use of. This will
bring about better profits for Hanichemco by selling those products and at the
same time reduce the environment treatment cost. This will better serve the part
of cost leadership in the strategy 70
Additionally, the quality of the urea fertilizers will also be controlled strictly to
ensure that the Biuret contents will not go beyond 2% - the level that can harm
the environment. 70
The overall environment protection system is expected to lower the production
cost because the company will not need to pay much money to solve the
environment – related problems like what Lam Thao Chemical and Fertilizer
company face. Additionally, it also helps enhance the company’s images and
brand name. 70
Figure 3.2: HANICHEMCO brand strategy 72
Figure 3.3: HANICHEMCO new organizational structure for the strategy 74
iii
Table 3.4: Total investment of HANICHEMCO 76
(Source: The research group’s Finance and Accounting Proposal) 76
Table 3.5: Expected profit, tax, break-even point, ROI, IRR 77
(Source: The research group’s Finance and Accounting Proposal) 77
Table 3.6: Expected financial resources 77
(Source: The research group’s Finance and Accounting Proposal) 77
Figure 3.5: Roadmap for the implementation of the strategy 78
C. CONCLUSION 79
REFERENCES 81
iv
LIST OF TABLES
Figure 1.1: The strategic management process 6
Table 1.1: SWOT Matrix 7
Figure 1.2: The External Environment 8
Table 1.2: The general Environment: Segments and Elements 9
Figure 1.3: The 5 force model of M.E. Porter 10
Figure 1.4: Competitor analysis components 12
Figure 1.5: External analyses’ outcomes 13
Table 1.3: Tangible resources 14
Table 1.4: Intangible resources 15
Figure 1.6: Types of business-level strategies 16
Table 1.5: GREAT model 19
Figure 2.1: Top 10 Countries in the 2009 Global Retail Development Index 21
Table 2.1: Selected Economic Indicators of Vietnam 22
Figure 2.2: Internet usage of Vietnam 23
Table 2.3: Forecast of Domestic Demand for Urea by 2015 30
Table 2.4: Capacity of Domestic Fertilizer Manufacturers 31
Figure 2.3: Urea distribution system of HANICHEMCO 31
(Source: Hanichemco’s Third-quarter Sale and Marketing Department report,
p23, 2009) 32
Table 2.5: Urea consumed amount of HANICHEMCO from 2006 to 2008 32
(Source: Hanichemco’s Third-quarter Sale and Marketing Department report,
p24, 2009) 32
Table 2.6: The amount of coal purchased from 2005 to 2008 34
35
Figure 2.4: Coal price (without VAT) between 2005 ÷ 2008 35
Table 2.7: Coal product types 37
Table 2.8: World urea output 38
v
Table 2.9: Urea price comparison between Ha Bac and Phu My Fertilizer
Company (DPM) 40
Table 2.10: Assessing strengths and weaknesses compared to competitors 41
Table 2.11: Quantity of imported DAP fertilizer in Vietnam from 2003 to 2008 42
Figure 2.5: Organization structure 46
Table 2.12: Operating results of HANICHEMCO from 2005 to 2008 47
Figure 2.6: HANICHEMC’s Revenue and Profits from 2005 to 2008 47
Table 2.13: Quantitative matrix with GREAT criteria 63
Table 3.1: Expected production scales of HANICHEMCO 68
All in all, Hanichemco’s total productivity generated from both current and new
production lines will be 300,000 tons of liquid NH3 and 500,000 tons Urea. 68
Figure 3.1: Waste Treatment system 70
As presented above, most of the tail gases have been taken full use of. This will
bring about better profits for Hanichemco by selling those products and at the
same time reduce the environment treatment cost. This will better serve the part
of cost leadership in the strategy 70
Additionally, the quality of the urea fertilizers will also be controlled strictly to
ensure that the Biuret contents will not go beyond 2% - the level that can harm
the environment. 70
The overall environment protection system is expected to lower the production
cost because the company will not need to pay much money to solve the
environment – related problems like what Lam Thao Chemical and Fertilizer
company face. Additionally, it also helps enhance the company’s images and
brand name. 70
Figure 3.2: HANICHEMCO brand strategy 72
Figure 3.3: HANICHEMCO new organizational structure for the strategy 74
Table 3.4: Total investment of HANICHEMCO 76
(Source: The research group’s Finance and Accounting Proposal) 76
Table 3.5: Expected profit, tax, break-even point, ROI, IRR 77
vi
(Source: The research group’s Finance and Accounting Proposal) 77
Table 3.6: Expected financial resources 77
(Source: The research group’s Finance and Accounting Proposal) 77
Figure 3.5: Roadmap for the implementation of the strategy 78
vii
TABLE OF CONTENTS
LIST OF FIGURES.....................................................................................................ii
LIST OF TABLES.......................................................................................................v
A. INTRODUCTION...................................................................................................1
1. Rationale .........................................................................................................1
2. Objectives .........................................................................................................2
3. Methodology .....................................................................................................3
4. Structure of the research..................................................................................3
B. DEVELOPMENT....................................................................................................5
CHAPTER I: THEORETICAL BACKGROUND............................................................5
1.1. Definitions of strategy and strategic management process.........................5
1.2. SWOT analysis – the tool to formulate the strategy....................................7
1.2.1. External Environment Analysis ............................................................8
1.2.1.1 Macro environment Analysis .........................................................................8
1.2.1.2 Industrial analysis and Michael Porter’s competitive five forces....................9
1.2.1.3 Competitor analysis.......................................................................................11
1.2.2 Internal Environment Analysis.............................................................13
1.3. Business-level Competition Strategies........................................................15
1.3.1 Cost leadership strategy.........................................................................16
1.3.2 Differentiation Strategy..........................................................................17
1.3.3 Focus Strategies......................................................................................17
1.3.4 Integrated Cost Leadership/ Differentiation Strategy.........................18
1.3.5 Select methods of assessment strategies. ..............................................19
...............................................................................................................................................20
CHAPTER
II:
AN
ANALYSIS
ON
THE
CURRENT
SITUATION
OF
HANICHEMCO..................................................................................................................21
2.1 Current situation of macro and industrial environment............................21
2.1.1. Macro economic conditions .................................................................21
2.1.1.1 Economic.......................................................................................................21
2.1.1.2 Technological................................................................................................23
2.1.1.3 Political-legal.................................................................................................25
2.1.1.4 Demographics: ..............................................................................................26
viii
2.1.1.5 Global environment ......................................................................................27
2.1.2. General industry situations...................................................................28
2.1.2.1 Agricultural Production Situation:................................................................28
2.1.2.2 Domestic fertilizer manufacturing capacity:.................................................30
2.1.2.3 Industry Competitive forces..........................................................................31
2.2 Current situation of HANICHEMCO ........................................................44
2.2.1. An overview on HANICHEMCO ........................................................44
2.2.2 HANICHEMCO’s overall situation.....................................................46
2.3 HANICHEMCO’s internal analysis...........................................................48
2.3.1 Company’s main activities: ..........................................................................48
2.3.2 Evaluation company’s strengths and weaknesses:...........................................54
2.4. SWOT Matrix analysis.............................................................................55
2.5. Options combined strengths, weaknesses, opportunities and threats:.....57
CHAPTER
III: FORMULATION
OF DEVELOPMENT STRATEGY FOR
HANICHEMCO FOR PERIOD 2011-2020......................................................................65
3.1. HANICHEMO’s visions/missions 2011-2020.............................................65
3.2. Selecting development strategy for HANICHEMCO 2011-2020..............65
3.3. Solutions for the implementation of the strategies ....................................67
3.3.1 Expanding manufacturing activities, modernizing technologies with
cost management activities ......................................................................................67
3.3.3 Diversifying products.............................................................................70
3.3.4 Branding ................................................................................................71
3.3.4 Improving the current organizational structure..................................73
3.3.5 Human resource development (HRM) Strategy...................................75
3.3.6 Financial Resource Preparation............................................................75
3.4. Roadmap for the implementation of the strategy ....................................77
C. CONCLUSION......................................................................................................79
REFERENCES...........................................................................................................81
ix
A. INTRODUCTION
1. Rationale
Within the last fifteen years, the world has witnessed three great financial crises,
namely the 1994 Mexico’s currency crisis, the 1997-1998 Asian crisis and the notyet-over 2008 financial global crisis. According to World Bank’s statistics, “43
poor countries are suffering the consequences of the global recession”1.
In that situation, Vietnam still remains one of the fastest-growing economies in the
world, averaging around 8% annual gross domestic product (GDP) growth from
1990 to 1997 and 6.5% from 1998-2003. From 2004 to 2007, GDP grew over 8%
annually. Foreign trade and foreign direct investment have improved significantly.
From 1990 to 2005, agricultural production nearly doubled, transforming Vietnam
from a net food importer to the world's second-largest exporter of rice. The average
Vietnamese savings rate is about 30%. Inflation in 2007 was 7.3% but was in the
double digits and approaching 30% year-on-year by August 2008 2. The 2009 first
quarter’s GDP was 3.1% against same period in 2008, the lowest growth quarter in
recent years, but in second quarter GDP growed by 4.5% and in third quarter by
5.8%. Generally in 9 months, GDP increased by 4.6% against same period in 2008, of
which the agriculture, forestry and fishing rose by 1.6%; the industry and
construction by 4.5% (industry by 3,3% and construction with high increase of
9.7%); the service by 5.9%.3
Vietnam is still considered as an agriculture-based country with more than 60%
total workforce working in the agricultural sector, which generates 20% of GDP.
The productivity of the 60% is only one third as against that of the rest working in
other sectors4. However, the country is getting more and more populated with
85.789.573 people, making the country the most 3rd populous country in Asean and
1
/> />3
/>4
/>2
1
the 13th while its area stands only the 58th in the world.5 Within the last five years,
total agriculture agriculture area has shrunk 366,000 ha; especially the rice area is
now only 3.8 mil hecta, which is a 47.7 % decrease per capita 6.
As the rice field and agricultural area are being turned into urban areas and
industrial parks, food security is seriously threatened. In order to overcome the
situation, the Resolution of the Communist meetings of the Agriculture and Rural
Development Ministry has set the objectives of “developing a commodity-oriented,
diversified, sustainable agriculture taking full advantage of the competitive
advantages and advanced technology in order to improve the use of land, labor and
capital resources …” Consequently, one of the technological inputs that help partly
improve the productivity is to further develop the domestic fertilizing sector. Being
one of the leading fertilizer and chemical producers in the country, Habac
Nitrogenous Fertilizer and Chemical Company Limited (HANICHEMCO) certainly
plays a very important role in contributing to the realization of the vision of the
whole industry. However, despite being founded for 50 years, HANICHEMCO
does not seem to be very active in influencing the trend but rather reactive.
Annually, the targets of the company tend to be based on the previous year
performance with the plus of 10 percent. It can be easily seen that HANICHEMCO
is in a great need for a development strategy in the phase of 2011-2020 to better
prepare itself to actively obtain the industry’s set objectives.
2. Objectives
The project is aims at following objectives:
•
Set up a theoretical foundation for the analysis of the external and internal
environment. The group will actively search for the theories on SWOT and industry
competitive forces, strategies and strategic management in an attempt to pave the
way toward formulating a development strategy for HANICHEMCO in the 20115
6
/> />
2
2020 period.
-
Analyze HANICHEMCO’s strengths, weaknesses, opportunities, threats against
its HANICHEMCO and its competitors
-
Formulating the development strategy for HANICHEMCO in the 2011-2020
period on the basis of the SWOT analysis
-
Proposing an implementation plan for the new strategy with specific roadmap
and plan for the co-ordination of different resources.
3. Methodology
The research methods mobilized in the process of analyzing and formulating the
strategy would be as follows:
•
Quantitative
•
Qualitative
•
Desk research
•
Field visits
4. Structure of the research
The research includes 3 mains parts with following compositions:
A. INTRODUCTION
B. DEVELOPMENT
CHAPTER I: THEORETICAL BACKGROUND
CHAPTER II: AN ANALYSIS ON THE CURRENT SITUATION OF
HANICHEMCO
2.1 Current situation of macro and industrial environment
3
2.2 Current situation of HANICHEMCO
2.3 HANICHEMCO’s internal analysis
2.4. SWOT matrix summary: Strengths, Weaknesses, Opportunities and Threats
CHAPTER III: FORMULATION OF DEVELOPMENT STRATEGY FOR
HANICHEMCO 2011-2020
3.1. HANICHEMCO’s visions/missions 2011-2020
3.2. Selecting development strategy for HANICHEMCO 2011-2020
3.3. Solutions for the implementation of the strategies
3.4. Roadmap for the implementation of the strategy
3.5. Recommendations
C. CONCLUSION
4
B. DEVELOPMENT
CHAPTER I: THEORETICAL BACKGROUND
1.1. Definitions of strategy and strategic management process
The word “strategy” has long been used in military context, because it derives from
the Greek word for “general”. According to Oxford English Dictionary, “a strategy
is a plan of action designed to achieve a particular goal”. Strategy deals with the
“how” part rather than the “what”.
The term “strategy” may have been used in business context long before the
business strategic management as a discipline originated in the 1950s and 60s.
Although there are as many definitions of strategy as the number of scholars trying
to do so, this research adopts the Hitt, A, M; Ireland D.R and Hoskisson E.R’s
definition of strategy put forward in the first chapter of the book “Strategic
Management,
Competitiveness
and
Globalization:
Concepts
and
Cases”.
Accordingly, strategy is defined as “a coordinated series of actions which involve
the deployment of resources to which one has access for the achievement of a given
purpose.” (slide1, chapter 1)
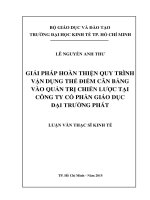
Basing on this definition of strategy, the strategic management process can be may
“involve the full set of commitments, decisions and actions which are required for
firms to achieve strategic competitiveness, sustained competitive advantage and
above-average returns”. In other words, the whole process can be illustrated in the
following graph:
5
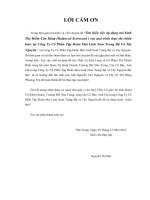
Figure 1.1: The strategic management process
(Source: slide 5, chapter 1, “Strategic Management, Competitiveness and Globalization:
Concepts and Cases”, Hitt, A, M; Ireland D.R and Hoskisson E.R’s, 2007)
Looking at the graph, we can see that a strategic management process’s goals are to
help us gain the strategic competitiveness and above average returns. In order for
the objectives to be realized, the initially vital steps for an effective strategic
management process are to analyze the external environment and internal
environment. The analysis will act as the inputs for the strategic mission and intent
from which we can formulate our strategy and afterward implement it. If all of
those step are successfully fulfilled, then strategic competitiveness will be gained
and eventually bring about the above-average returns. However, the circle does not
just stop there. Continuous feedback is extremely important to further enhance the
inputs quality which in turns betters the mission and the process repeated itself at a
higher level. It is this continuity that brings about the sustainable competitive
6
advantages and above-average returns. Obviously, the external and internal analysis
plays crucial roles in developing an effective strategy. A tool that has been used for
long to generate inputs for the formulation of strategy is SWOT analysis.
1.2. SWOT analysis – the tool to formulate the strategy
SWOT Analysis is a strategic planning method used to evaluate the Strengths,
Weaknesses, Opportunities, and Threats involved in a business. SWOTs are used as
inputs to the creative generation of possible strategies which may com from the use
of the matrix
Table 1.1: SWOT Matrix7
Another use of SWOT is to march and convert.
Matching is used to find
competitive advantages by matching the strengths to opportunities. Converting is to
apply conversion strategies to convert threats or weaknesses into strengths or
opportunities.
7
/>
7
1.2.1. External Environment Analysis
The external environment may be seen not only as the broader external economy
and society but also the industry environment that the business operates in.
1.2.1.1 Macro environment Analysis
In a more general perspective, all businesses and organizations operate in a
changing world and are subject to forces that are more powerful than they are such
as demographic, cultural, technological change, and which are beyond their control.
No business can survive without continued interaction with the external
environment. Any business strategy needs to take account of all these forces so that
the organization can navigate its way to success by matching its internal strengths to
external opportunities.
Therefore, external environment is defined by Hitt, A, M; Ireland D.R and
Hoskisson E.R’s, 2007 as the “Dimensions in the broader society that influence an
industry and the firms within it” (slide 2, chapter 2). To be more specifically, the
external factors that can influence an organization are listed in the following graph:
Figure 1.2: The External Environment
8
To effectively formulate a strategy, a firm should not only look at the current
situations but also the trends in those factors in order to be more actively in
influencing the future since most strategy are usually set in a longer term. The
general environment factors can be summarized in the following table:
Table 1.2: The general Environment: Segments and Elements8
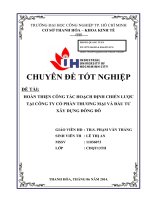
1.2.1.2 Industrial analysis and Michael Porter’s competitive five forces
As seen in the figure 1.1, external environment factors include both the
macroeconomic environment and the industrial environment. The industry is
defined as “a group of firms producing products that are close substitutes or the
firms that influence one another.”9 Moreover, an industry also “includes a rich mix
of competitive strategies that companies use in pursuing strategic competitiveness
and above-average returns”.
8
Hitt, A, M; Ireland D.R and Hoskisson E.R, slide 5, chapter 3
9
Hitt, A, M; Ireland D.R and Hoskisson E.R, Slide 9, chapter 2,
9
A very useful tool that has been long used for industrial analysis is Michael Porter’s
five force model published in the book Competitive Strategy (1980), Free Press,
New York, 1980. Michael Porter developed a framework, which identified 5 forces
that act to either increase or reduce the competitive forces within an industry as
follows.
Threat of New Entrants: The easier it is for new companies to enter the industry,
the more severe competition there will be. Factors that can limit the threat of new
entrants are known as barriers to entry.
Power of Suppliers: This is how much pressure suppliers can place on a business.
If one supplier has a large enough impact to affect a company's margins and
volumes, then they hold substantial power.
Figure 1.3: The 5 force model of M.E. Porter10
Power of Buyers/ Customers: This is how much pressure customers can place on
a business. If one customer has a large enough impact to affect a company's
margins and volumes, then they hold substantial power.
10
Porter, M.E. (1980) Competitive Strategy, Free Press, New York, 1980.
10
Availability of Substitutes: What is the likelihood that someone will switch to a
competitive product or service? If the cost of switching is low, then this poses to be
a serious threat.
Competitive Rivalry: And last but not least, this describes the intensity of
competition between existing firms in an industry. Highly competitive industries
generally earn low returns because the cost of competition is high.
Industry analysis will help a business identify whether an industry is attractive.
Accordingly, an attractive industry would be that with high entry barriers,
suppliers and buyers have weak positions, few threats from substitute
products
and
moderate
rivalry
among
competitors.
With
these
characteristics, an industry is really attractiveness because it has quite high
profit potential. Otherwise, an industry could be seen as unattractive and
low profit potential if there are low entry barriers, suppliers and buyers
have strong positions, there are strong threats from substitutes products and
intense rivalry among competitors.
1.2.1.3 Competitor analysis
As shown in figure 1.3, in addition to macro environment analysis, industry
analysis, analyzing competitors plays crucial roles also. Hitt, A, M; Ireland D.R
and Hoskisson E.R defined “competitor analysis” as a way of “gathering and
interpreting information about all of the companies that the firm competes
against.”11 Understanding the firm’s competitor environment complements the
insights provided by studying the general and industry environments. The aim of
analyzing competitor environment is to focus on predicting the dynamics of
competitors’ actions, responses and intentions.
What should we find out about out competitors? The authors of the textbook
12
suggested that following issues should be put forward:
11
Slides 6, chapter 2
12
Hitt, A, M; Ireland D.R and Hoskisson E.R, Slide 24, chapter 2
11
No.
Criteria of evaluation
The
Competitor 1
company
1
Leadership
2
Technical staff
3
Production technology
4
Machinery and Equipment
5
…………
Competitor
…n
Weak: 1; Average: 2; pretty average: 3; Good: 4; Strong: 5.
Figure 1.4: Competitor analysis components
The purpose of the competitor environment analysis is to identify the key success
factors (KSF) of each business. To find out the key success factors, one
business should be able to find out the basis on which customers choose
between its brands and that of the competitors. A business should be able to
know what it should do to compete successfully and the resources and
competitive capabilities it needs. Then, a business is expected to find out
what it takes for sellers to achieve a sustainable competitive advantage.
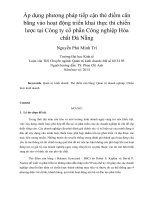
In conclusion, the external analyses’ outcomes are to find out opportunities and
threats exposing to a business from macro, industry and competitors’
environments. The outcomes of the analyses can be illustrated in the
following graph:
12
Figure 1.5: External analyses’ outcomes13
1.2.2 Internal Environment Analysis
Unlike the external analyses’ outcomes that brings about opportunities and threats,
by studying the internal environment, firms identify what they can do. In
other words, a firm is expected to successfully identify unique resources,
capabilities and competencies required for sustainable competitive
advantage.
Resources are defined as “a firm’s assets, including people and the value of its
brand name. Resources represent inputs into a firm’s production process,
such as: capital equipment, Skills of employees, Brand names, Financial
resources. Talented managers”14
There are two types of resources including tangible resources and intangible
resources.
13
Hitt, A, M; Ireland D.R and Hoskisson E.R, slide 4, chapter 3
14
Slide 14, chapter 3
13
Tangible resources are the financial resources and physical assets which are valued
in the firm’s financial statements. Additionally, a business’s tangible resources also
include a company’s technological resources and organizational resources. All of
those have been identified in the following table:
Table 1.3: Tangible resources15
Intangible resources are largely invisible, but over time become more important to
the firm than tangible assets because they can be a main source for a
competitive advantage. Such intangible recourses include Human resources,
Innovation resources, Reputation resources. To be more specific, each of
the above factor can be described in details as in the following table:
15
Hitt, A, M; Ireland D.R and Hoskisson E.R, slide 10, chapter 3
14
Table 1.4: Intangible resources16
Capabilities17 represent the capacity to deploy resources that have been purposely
integrated to achieve a desired end state. They often emerge over time
through complex interactions among tangible and intangible resources and
are often based on developing, carrying and exchanging information and
knowledge through the firm’s human capital.
Four criteria for determining strategic capabilities 18 include Value, Rarity, Costlyto-imitate, and Non-substitutability.
Core Competencies19 are defined as the activities that a firm performs especially
well compared to competitors or the activities through which the firm adds
unique value to its goods or services over a long period of time.
All in all, external environment and internal environment analysis or SWOT
analysis will help us understand better a company’s resource strengths,
resource weaknesses, best opportunities, external threats. The SWOT
analysis will help the company draw conclusions about how best to deploy
resources in light of the company’s internal and external situation. Then,
the company could think strategically about how to strengthen the
company’s resource base for the future.
Once the SWOT analysis has been successfully done, a firm should be able to select
the best possible strategy to take full advantage of the strengths and
opportunities as well as mitigate the weaknesses.
1.3. Business-level Competition Strategies
A business-level strategy is defined as “an integrated and coordinated set of
commitments and actions the firm uses to gain a competitive advantage by
16
Hitt, A, M; Ireland D.R and Hoskisson E.R, slide 14, chapter 3
Hitt, A, M; Ireland D.R and Hoskisson E.R, slide 18, chapter 3
18
Hitt, A, M; Ireland D.R and Hoskisson E.R, slide 20, chapter 3
19
Hitt, A, M; Ireland D.R and Hoskisson E.R, slide 22, chapter 3
17
15
exploiting core competencies in specific product markets.”20 The purpose of a
business-level strategy is to create differences between the firm’s position relative
to those of its rivals. To position itself, the firm must decide whether it intends to
perform activities differently or perform different activities as compared to its
rivals.
Hitt, A, M; Ireland D.R and Hoskisson E.R suggests following types of businesslevel strategies shown in the following graph:
Figure 1.6: Types of business-level strategies21
1.3.1 Cost leadership strategy
Cost leadership strategy is defined as “An integrated set of actions taken to produce
goods or services with features that are acceptable to customers at the lowest cost,
relative to that of competitors with features that are acceptable to customers.”22
This strategy is applied for relatively standardized products with features acceptable
to a wide range of customers with lowest possible competitive price.
20
21
22
Hitt, A, M; Ireland D.R and Hoskisson E.R, slide 2, chapter 4
Hitt, A, M; Ireland D.R and Hoskisson E.R, slide 24, chapter 4
Hitt, A, M; Ireland D.R and Hoskisson E.R, slide 12, chapter 4
16