Combining Process Simulation and Agent Organizational Structure Evaluation in Order to Analyze Disaster Response Plans
Bạn đang xem bản rút gọn của tài liệu. Xem và tải ngay bản đầy đủ của tài liệu tại đây (487.62 KB, 13 trang )
Combining Process Simulation and Agent
Organizational Structure Evaluation in order to
Analyze Disaster Response Plans
Nguyen Tuan Thanh LE, Chihab HANACHI⋆ , Serge STINCKWICH⋆⋆ , and
Tuong Vinh HO⋆ ⋆ ⋆
Abstract. This paper shows how to simulate and evaluate disaster response plans and in particular the process and the organization set up
in such situations. We consider, as a case study, the tsunami resolution
plan of Ho Chi Minh City, Vietnam. We firstly examine the process model
corresponding to this plan by defining three scenarios and analyzing simulations built on top of them. Then, we study the agent organizational
structure involved in the plan by analyzing the role graph of actors and
notably the power, coordination and control relations among them according to the Grossi framework. These evaluations provide recommendations to improve the response plan.
Keywords: agent organization evaluation, crisis management, process
simulation, role graph, decision support system
1
Introduction
In crisis situations (tsunami or earthquake), coordination among the implied
stakeholders (rescue teams and authorities) is of paramount importance to ease
the efficient management and resolution of crises. Coordination may be supported by different related means such as plans, processes, organizational structures, shared artifacts (geographical maps), etc [3].
Most often, coordination recommendations to manage crisis are available in
a textual format defining the actors, their roles and their required interactions
in the different steps of crisis life-cycle: mitigation, preparedness, response and
recovery.
⋆
⋆⋆
⋆⋆⋆
Nguyen Tuan Thanh LE and Chihab HANACHI are with Toulouse 1 University and
members of the IRIT Laboratory (SMAC Team), France
Serge STINCKWICH is with UCBN & UMI UMMISCO 209 (IRD/UPMC), France
Tuong Vinh HO is with Institut Francophone International, Vietnam National University (VNU) & UMI UMMISCO 209 (IRD/UPMC), Hanoi, Vietnam
2
Nguyen Tuan Thanh LE et al.
While coordination recommendations, in a textual format, are easy to manipulate by stakeholders, taken individually, they do not provide direct means
to be analyzed, simulated, adapted, improved and may have various different
interpretations, so difficult to manage in real time and in a distributed setting.
In [4], we propose an approach to transform a textual coordination plan into
a formal process in order to have an accurate representation of the coordination,
to reduce ambiguity and ease an efficient preparedness and resolution of tsunami
at Ho Chi Minh City.
Formalizing coordination and producing models are a first step toward a better understanding and mastering of coordination. Then, it is also important to
evaluate coordination models in order to provide recommendations to authority
to help them improving coordination within resolution plans. Most of the time,
authorities make real-world exercises to validate their plans but do not formally
validate them. Unfortunately real-world exercises are not always possible (cost,
impossibility to reproduce reality, etc.). Therefore simulation and formal validation become unavoidable.
Given these observations, it becomes useful to make formal evaluation of
coordination models used during crisis situations. This is the approach followed
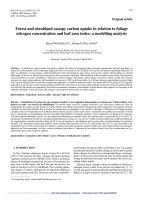
in this work (see lifecycle of Fig. 1). Notably, our contribution consists in the
definition of a framework to evaluate both the underlined process and the agent
(actor) organization set up in a resolution plan. The two evaluation dimensions,
process and organization, are complementary since the first one abstracts the
coordinated behavior of the actors while the second abstracts the relationships
(control, coordination, power ...) between actors. Both are to be evaluated since
they influence the efficiency, the robustness and the flexibility of the disaster
response plans. Even if our work considers a concrete case study (i.e. the Ho Chi
Minh City tsunami response plan), our approach is general enough to be applied
to any crisis management plan.
Fig. 1. Evaluation lifecycle of disaster response plans
Process Simulation and Agent Organization Evaluation
3
The paper is organized as follows. We first recall the formal process model
that we have proposed in [4] corresponding to the Ho Chi Minh City rescue plan.
Related works about business process simulation and organizational structure
evaluation are presented in section 3. We then define three scenarios and analyze
simulations built on top of them. Afterward, we evaluate the agent organizational
structure involved in this plan by analyzing the role graph of the actors and
notably the power, coordination and control relations among them according to
the Grossi framework [8]. These evaluations provide recommendations to improve
the response plan. Finally, we discuss the results and conclude our work.
2
Background
Response plans used during crisis situations involve the interactions of many
actors and tasks organized in a flowchart of activities with interleaving decision
points, that can be roughly be seen as a specific business process. We would
like to apply business process techniques in crisis management. Therefore in
[4], we have presented a process-based model to analyze coordination activities
extracted from tsunami response plan proposed by People’s Committee of Ho Chi
Minh City. This conceptual model (Fig. 2), described with a Business Process
Model and Notation (BPMN) diagram, has been built by analyzing an official
textual plan provided by the suitable authorities.
Fig. 2. Conceptual model of tsunami response plan proposed by Ho Chi Minh City
4
Nguyen Tuan Thanh LE et al.
We can identify in the model above seven organizations (represented by lanes)
involved with their flow of tasks and mutual interactions. In BPMN, a task (like
T1: Detect tsunami risk ) is represented by a rounded-corner rectangle. Several
control structures are possible to coordinate the different tasks: sequence (arrow),
parallelism (diamond including “+”) or alternatives (diamond with “X”). We can
notice, in Fig. 2, that Military and Police organizations are supposed to perform
tasks in parallel. In this case, each organization members should be distributed
over the parallel tasks according to a given policy (proportional distribution,
distribution according to the importance given to each task ). The Health & Red
Cross organization has to choose to carry out only one task among two possible
ones.
This model has been transformed and executed within a workflow system,
namely Yet Another Workflow Language1 (YAWL), to demonstrate the feasibility of managing the plan in a distributed setting. However, this transformation
not only dropped lots of details of our conceptual model, but also did not provide process simulation functions, notably what-if simulation and performance
analysis, useful for decision makers in charge of defining and updating plans. We
will provide later in section 4 a more elaborate model by having more realistic
scenarios and organizational structure evaluations, that will allow more complex
analysis of rescue plans.
3
Related Works
This section will situate our contribution according to three complementary
points of view: coordination in Multi-Agent Systems (MAS), simulation of discrete event systems and organizational perspective.
The problem of coordinating the behaviour of MASs has been regularly addressed [2]. A coordination model is useful in crisis context since it helps in
supporting interdependence between stakeholders, the achievement of common
goals (e.g. saving victims), and the sharing of resources (vehicles, food, houses
for victims, ...) and competencies (medical, carriers, ...). A coordination model
can exploit and/or combine different techniques: 1) organizational structuring
2) contracting 3) negotiating 3) planning 4) shared artefacts. We follow in this
paper a process-oriented technique which can be considered as a combination of
plans within an organizational structure. The advantage of process-oriented coordination is to provide visibility on the whole crisis evolution: past, present and
future activities and their relationships. [1] proposes a very detailed review of
process management systems supporting disaster response scenarios. However,
one main drawback of these systems is to support the real time managing of the
crisis, while we consider the whole life cycle of the process and in this paper the
simulation and validation steps.
From a simulation point of view, a computer-based simulation of processes
can be done following a discrete-event simulation, where a crisis evolution can be
1
/>
Process Simulation and Agent Organization Evaluation
5
represented as a sequence of events. This approach has been applied successfully
in workflow and business processes [5]. Process simulation helps to identify the
bottlenecks in the flow of tasks and then optimize them with alternative ones or
find out the better resource management solution. Rozinat et al. in [6] proposed
an approach by analyzing the event logs (in structured format), then extracting
automatically the useful information about: 1) control flow, 2) decision point,
3) performance, and 4) roles. Using these information, the authors constructed
a four-facets simulation model and simulated it with a Petri nets tool, namely
CPN2 . Unlike [6], our model is created from an unstructured textual guideline so
we cannot use an event miner such as ProM3 tool to extract automatically the
useful information. In our case, we have observed manually the necessary information by studying the textual plan, extracting the actors, their activities, and
finally designed a corresponding conceptual model due to our comprehension.
In [7], the authors combined three types of information to generate a more
accurate simulation model: 1) design information used to form model structure,
2) historic information (event logs) used to set model parameters (such as arrival
rate, processing time) and 3) state information used to initialize the model. In
our work, we have only used the design information to create our simulation
model. We then added the necessary parameters like resource quantity, time
constraints extracted from the official textual plan to the model.
From an organizational point view, Grossi et al. proposed in [8] a framework
to evaluate the organizational structure based on a role graph with three dimensions: power, coordination and control. They introduced the concepts and
the equations involved into the evaluation. Using these equations, we compared
our results with the standard values proposed by Grossi in order to assess the
robustness, the flexibility and the efficiency of our organization.
The novelty of our work is to evaluate resolution plans through a formal
representation and to consider both process and organizational aspects at the
same time and in a coherent framework.
4
Rescue Plans Assessment by Process Simulation
In this section, we will describe how to evaluate a rescue plan by using business process simulations. In order to perform these simulations, a conceptual
model (such as Fig. 2) is not sufficient. Therefore, we need to add extra information (quantity of resources, time constraints) that will allow us to define more
accurate scenarios.
4.1
Definition of Simulation Parameters
Related to business process essence, we consider four input parameters as follows
[9]: 1) the Arrival process expresses the arrival rate of new cases (i.e., process
2
3
/> />
6
Nguyen Tuan Thanh LE et al.
instances); 2) the Probabilities for choices indicates the probability of selecting
one task to perform among several alternative tasks at a time; 3) the Service
time expresses the required time for a task to complete its work; and 4) the
Number of human resources specifies the kind of mobilized organizations and
their quantity, as well as the allocated resources of tasks.
These four parameters are insufficient in our context. Indeed, BPMN simulation lacks some notions such as the actors’ capacities and the priorities or the
important factors of tasks. Hence, we have defined the notion of importance factor of a task T as an evaluation number of the importance of this task regarding
its capacity in term of rescues or good salvage. The more this factor is high,
the more its task can save persons or goods. Hence, we must pay attention to
it since it influences the crisis resolution performance. This factor will be used
in our context for allocating suitably the resources to parallel tasks, even if its
use could be generalized to all types of tasks. As we will demonstrate it, taking
into account this new notion will improve the overall performance of our process
model.
To tune the arrival process and service time parameters, we could apply
different kind of distributions such as Poisson distribution, Duration distribution,
Normal distribution, Triangular distribution, etc.
Different from a typical business process as flight ticket booking, whose arrival
rate is frequent (time distance between two customers’ request is small), in crisis
and disaster context, we do not meet the full queue or resource conflict problem.
In our simulation, we have set the arrival process parameter to one, because we
consider only one tsunami situation at a time.
We have set the probabilities for choices (in number between 0 and 1) of
alternative tasks and the importance factors (in percent) for parallel tasks as
shown in Table 1. We allocate resources to tasks in the order of their importance:
important tasks are first served with the maximum resources according to their
needs.
Tasks
PC
T12/T13 0.8/0.2
Tasks
IF
T4/T5
40/60
T18/T19
30/70
T18’/T19’
70/30
T8/T9/T10 70/20/10
T8’/T9’/T11 10/10/80
Table 1. Probabilities for choices (PC) of alternative tasks and Importance factors
(IF) of parallel tasks
We have also applied a Duration distribution for all tasks’ service time, as
shown in Table 2. We assumed that the time span of a tsunami is three hours.
Furthermore, we have modeled seven roles (or actors) with their corresponding acronym: Institute of Geophysics (abbr. IG), Local Administration (LA),
Process Simulation and Agent Organization Evaluation
Task ST
T1 10m
T8’ 3h
T15 15m
Task ST
T2 15m
T9 3h
T16 10m
Task ST
T3 10m
T9’ 3h
T17 30m
Task ST
T4 30m
T10 3h
T18 1h
Task ST
T5 30m
T11 3h
T18’ 1h
Task ST
T6 1h
T12 3h
T19 1h
Task ST
T7 30m
T13 30m
T19’ 1h
7
Task ST
T8 3h
T14 10m
T20 30m
Table 2. Service time (ST) of all tasks in tsunami response plan
Military (M), Police (P), Local Civil Defense Forces (LCDF), Communication
Unit (CU), and Health & Red Cross (HR). The total number of human resources
for each role is shown in Table 3. For the clarity purpose, we did not take into
account other mobilized non-human materials such as the transport means (e.g.,
ambulances, fire trucks, canoes, etc), or the machines (e.g., sprayer epidemic
prevention machine, GPS machine, etc).
Resource
Quantity Resource
Quantity
Institute of Geophysics
5
Military
6836
Local Administration
160
Communication Unit
170
Local Civil Defense Forces
6700
Police
3700
Health and Red Cross
2600
Table 3. Human resources mobilized in our tsunami response plan
Our expected outputs of the process simulation are two-fold: a) the Time use
representing the total time consumed by our tsunami response process, as well
as the average time, the average waiting time, the minimum or maximum time
for each task; and b) the Resource use depicting the distribution of resources
occupied by each actor.
Practically, we use Bizagi tool4 to model and simulate our case study.
4.2
Definition of Scenarios
Following [10], we could define a scenario by four components: the purpose, the
content, the form and the cycle. Regarding the purpose, crisis management simulation aims at answering the two following questions: a) how could we allocate
efficiently the human resources to tasks? and b) what is the best resources allocation strategy? The content and the form of our scenarios are defined by the
tasks’ services time (in minutes), the number of mobilized actors (in positive
integer values) and the probabilities for alternative tasks (in number) as well as
the importance factor (in percent).
4
/>htm
8
Nguyen Tuan Thanh LE et al.
To demonstrate the efficiency of the importance factor notion, we have fixed
the arrival process, the probabilities for choices, and the service time parameters.
In a nutshell, we have shifted only the number of human resources allocated to
tasks leading to the three scenarios:
– Scenario 1 : We name it full-resource scenario. For each task, we allocate to it
the maximum number of human resources dedicated to it without considering
any other aspects.
– Scenario 2 : We call it importance-focus scenario. It is based on a percentage
distribution of human resources allocated to each parallel and alternative
task. These percentages are stated by the designer according to the importance factors or the probabilities for choices which he/she gives to each
parallel or alternative task, respectively. We allocate a maximum value of
human resources to all the other tasks.
– Scenario 3 : It could be also called all-equal scenario. For parallel and alternative tasks, the same number of human resources is allocated without
regarding to the probabilities for choices or the importance factors of tasks.
The others tasks are allocated a maximum value.
The number of human resources allocated to each task for the three previous
scenarios are shown in Table 4.
Task Scen. 1 Scen. 2 Scen. 3 Task Scen. 1 Scen. 2 Scen. 3
T1 5
5
5
T14 5
5
5
T2 5
5
5
T15 5
5
5
T3 160
160
160
T16 160
160
160
T4 160
64
80
T17 160
160
160
T5 160
96
80
T20 160
160
160
T6 6700
6700
6700
T7 170
170
170
T8 6836
4785
2278
T8’ 3700
370
1233
T9 6836
1367
2278
T9’ 3700
370
1233
T10 6836
683
2278
T11 3700
2960
1233
T18 6836
2050
3418
T18’ 3700
2590
1850
T19 6836
4785
3418
T19’ 3700
1110
1850
T12 2600
2080
1300
T13 2600
520
1300
Table 4. Number of human resources allocated to tasks in the three scenarios
4.3
Simulation & Analysis of three Scenarios
We compare the different scenarios through the utilization rate of the resources.
Fig. 3 depicts the resource utilization (in percent) of each actor after the what-if
simulation. As we see, scenario 1 (full-resource scenario) spends more human resources than others for parallel tasks performed by Military or Police. Otherwise
Process Simulation and Agent Organization Evaluation
9
for the actors having only ordered tasks, scenario 1 consumes the less human
resources. Furthermore, except for the actor Health & Red Cross (in which we
have an exclusive choice between two tasks: T12 and T13 ), we observe that
the resource utilization of scenario 2 (importance-focus scenario) and scenario
3 (all-equal scenario) are identical. For Health & Red Cross actor which has an
alternative way, the resource utilization of importance-focus scenario is more
efficient than the all-equal scenario.
Fig. 3. Utilization of human resources corresponding to three scenarios
We finally have computed the average of resource utilization of all actors as
shown in Table 5. The best strategy is the Importance-focus scenario.
M
P
HR
LA
CU
Scen. 1 79.69% 80.00% 21.82% 16.97% 3.64%
Scen. 2 63.99% 64.00% 38.40% 29.33% 8.00%
Scen. 3 63.99% 63.99% 24.00% 29.33% 8.00%
LCDF IG
7.27% 6.06%
16.00% 13.33%
16.00% 13.33%
Average
30.78%
33.29%
31.23%
Table 5. Comparing the average of resources used in three scenarios
10
Nguyen Tuan Thanh LE et al.
5
Rescue Plans Assessment by Agent Organization
Analysis
In this section, we evaluate the rescue plan organizational structure by using the
framework provided by Grossi and al. [8]. This framework allows us to assess
the robustness, flexibility and efficiency of our organization by using the power,
coordination and control 5 relations between each pair of roles.
Grossi et al. state that: a) the robustness means the stability of an organization in the case of anticipated risks; b) the flexibility is the capacity of an
organization to adapt to the environment changes; and c) the efficiency refers
to the amount of resources used by the organization to perform its tasks.
In our case, we will show that the structure organization is efficient and sufficiently flexible but not enough robust. Obviously, it is not possible to maximize
simultaneously all criteria [8]. Since our organization is devoted to the disaster
response, thus we would like to focus on the amount of resources used by tasks
(the efficiency).
As Grossi’s proposal, evaluating an organizational structure involves three
steps: 1) building a role graph of the organization based on the three dimensions
(power, coordination, control ); 2) measuring specific properties of the organizational structure according to a set of formulas; 3) finally, comparing the obtained
results with the optimum values proposed by Grossi in order to evaluate the
qualities (robustness, flexibility and efficiency) of the organization.
5.1
Building the Role Graph
According to three dimensions described above, we have built the role graph
corresponding to our organizational model (seven roles) as seen in Fig. 4. Each
node corresponds to an organization while an arc corresponds to the relationship
between two organizations. We can identify three types of relationships: power,
coordination and control.
5.2
Computing the Metrics
Based on the role graph above, we have implemented isolation metrics (completeness, connectedness, economy, unilaterality, univocity, flatness) and interaction
metrics (detour, overlap, incover, outcover and chain) as proposed by Grossi.
5.3
Measuring the Qualities
In order to evaluate criteria of our organization, we have compared our results
(right-hand table) with the proposed optimum values (left-hand table) in tables
6, 7 and 8.
5
the power dimension defines the task delegation pattern; the coordination dimension
concerns the flow of knowledge within the organization; and the control dimension
between agent A and agent B means that agent A has to monitor agent B’s activities
and possibly take over the unaccomplished tasks of agent B
Process Simulation and Agent Organization Evaluation
11
Fig. 4. Role graph of the tsunami response plan
Table 6 shows the organizational structure robustness of the rescue plans. We
have three over twelve optimum metrics: ConnectednessCoord, OverlapCoord−P ow
and ChainContr−P ow . The variation of our results with standard values is above
average (0.54), so we can conclude that the organization is not robust enough.
CompletenessCoord
ConnectednessCoord
U nivocityP ow
U nilateralityCoord
U nivocityContr
F latnessContr
1 25/42 OverlapCoord−P ow
1 1
ChainContr−P ow
0 1
ChainContr−Coord
0 1/25 InCoverContr−Coord
0 1 OutCoverP ow−Contr
0 1 OutCoverP ow−Coord
1
1
1
1
1
1
1
1
0
0
2/5
0
Table 6. Organization robustness(on the right) versus standard values (on the left)
Table 7 shows how flexible is the organizational structure. We have two over
six optimum metrics: Chaincontr−pow and Connectednesscoord. The variation of
our results with standard values is below average (0.33), thus our organization
is sufficiently flexible.
CompletenessP ow 0 1/3 CompletenessCoord 1 25/42
ConnectednessP ow 0 1 ConnectednessCoord 1 1
ChainContr−P ow 1 1 OutCoverP ow−Contr 1 2/5
Table 7. Organization flexibility (on the right) versus standard values (on the left)
12
Nguyen Tuan Thanh LE et al.
Table 8 depicts the efficiency of our organizational structure. We have six
over ten optimum metrics: EconomyP ow , OverlapCoord−P ow , U nilateralityP ow ,
U nivocityP ow , EconomyContr and OverlapContr−P ow . The variation of our results with standard values is small (0.193), so our organization is quite efficient.
CompletenessP ow
EconomyP ow
EconomyCoord
OverlapCoord−P ow
OverlapP ow−Coord
1 1/3 U nilateralityP ows
1 1
U nivocityP ow
1 17/36 EconomyContr
1 1 OverlapContr−P ow
1 2/25 OverlapP ow−Contr
1
1
1
1
1
1
1
1
1
2/5
Table 8. Organization efficiency (on the right) versus standard values (on the left)
6
Conclusion
In this paper, we have introduced two complementary evaluations of disaster
management plans: process and organization evaluations. The process evaluation
helps to identify the best allocation strategy of human resources according to
the distribution rules of resources over the tasks. We have defined in our work
three scenarios corresponding to three different distribution policies. In our case
study, the best one corresponds to the “importance focus” i.e. allocating to tasks
a number of resources based on its importance factor. In addition, the agent
organizational structure evaluation assesses three criteria of our organization:
robustness, flexibility and efficiency. In our case study, we have a flexible and
efficient organization due to the fact that the roles are well connected while
retaining a minimal of symmetric and redundant links. Even if we have a “quite
good organization”, it remains not robust. An optimal robustness would require
a complete connectivity between all nodes. This property is useful to guarantee
the plan continuity in case where some resources are destroyed and a role is for
example no more represented.
Thanks to this approach, we can provide interesting recommendations to
improve crisis management plans. In our case study, two recommendations can
be provided to the authorities of Ho Chi Minh City: 1) preferring the “importance
focus” strategy and 2) improving the robustness in case of high-risk situations.
In the future research, we would like to establish a bridge between the
discrete-event (process-oriented) simulation and the agent-based simulation by
implementing a transformation from our business process model to a concrete
multi-agent based model. The actors would be figured as the agents and the flow
of tasks (coordination) would be distributed among agents. While the processoriented simulation provided an aggregate vision of the plan thanks to roles,
agent simulation would help to have an agent-centered view where different
agents could play a same role with different behavior (e.g. following BDI architecture).
Process Simulation and Agent Organization Evaluation
13
References
1. J¨
orn Franke, Fran¸cois Charoy, C´edric Ulmer: Handling Conflicts in Autonomous
Coordination of Distributed Collaborative Activities. WETICE 2011: 319-326
2. Lesser, Victor; Corkill, Daniel. Challenges for Multi-Agent Coordination Theory
Based on Empirical Observations. Proceedings of 13th International Conference
on Autonomous Agents and Multiagent Systems, Lomuscia, A.; Scerri, P.; Bazzan,
A.; and Huhns, M, ed., IFAAMAS, pp. 1157-1160. 2014. In Challenge in Vision
special track.
3. Franke, J.: Coordination of Distributed Activities in Dynamic Situations. The Case
of Inter-organizational Crisis Management. Ph.D. dissertation, University of Nancy,
France (2011)
4. Thanh, L.N.T., Hanachi, C., Stinckwich, S., Vinh, H.T.: Representing, Simulating
and Analysing Ho Chi Minh City Tsunami Plan by Means of Process Models. In:
ISCRAM (Information Systems for Crisis Response and Management) Vietnam
2013 Conference (2013)
5. Dugdale, J., Bellamine-Ben Saoud, N., Pavard, B., Pallamin, N.: Simulation and
Emergency Management. In: Information Systems for Emergency Management (B.
van de Walle, M. Turroff, and S.R. Hiltz eds.), Chapter 10 (2010)
6. Rozinat, A., Mans, R.S., Song, M., Van der Aalst, W.M.: Discovering simulation
models. In: Information Systems, vol. 34, no. 3, pp. 305–327, Elsevier (2009)
7. Rozinat, A., Wynn, M.T., Van der Aalst, W.M., ter Hofstede, A.H.M, Fidge, C.J.:
Workflow simulation for operational decision support using design, historic and
state information. In: Business Process Management, pp. 196–211, Springer (2008)
8. Grossi, D., Dignum, F., Dignum, V., Dastani, M., Royakkers, L.: Structural Aspects of the Evaluation of Agent Organizations. In: Coordination, Organizations,
Institutions, and Norms in Agent Systems II, pp. 3–18, Springer-Verlag (2007)
9. Van der Aalst, W.M., Nakatumba, J., Rozinat, A., Russell, N.: Business Process
Simulation: How to get it right?. In: BPM Center Report BPM-08-07, Citeseer
(2008)
10. Rolland, C., Ben Achour, C., Cauvet, C., Ralyt´e, J., Sutcliffe, A., Maiden, N.,
Jarke, M., Haumer, P., Pohl, K., Dubois, E., Heymans, P.: A proposal for a scenario classification framework. In: Requirements Engineering Journal, vol. 3, no. 1,
pp. 23–47, Springer (1998)
11. Longo, F.: Emergency Simulation: State of the Art and Future Research Guidelines.
In: SCS Modeling and Simulation Magazine, vol. 1 (2010)
12. Ahmad, A., Balet, O., Himmelstein, J., Boin, A., Schaap, M., Brivio, P., Ganovelli,
F., Gobbetti, E., Pintore, G., de la Rivi`ere, J.B.: Interactive Simulation Technology
for Crisis Management and Training: The INDIGO Project. In: Proceedings of the
9th International ISCRAM Conference (2012)